How to control the flow information at your organization - Yammer and Power BI in action! - Joanna Sypuła Tomasz Onyszko - Predica
←
→
Page content transcription
If your browser does not render page correctly, please read the page content below
How to control the flow information at your
organization – Yammer and Power BI in action!

     Joanna Sypuła             Tomasz Onyszko
       Team Lead                 Digital Advisor
       Data Lab         Identity, Security & Infrastructure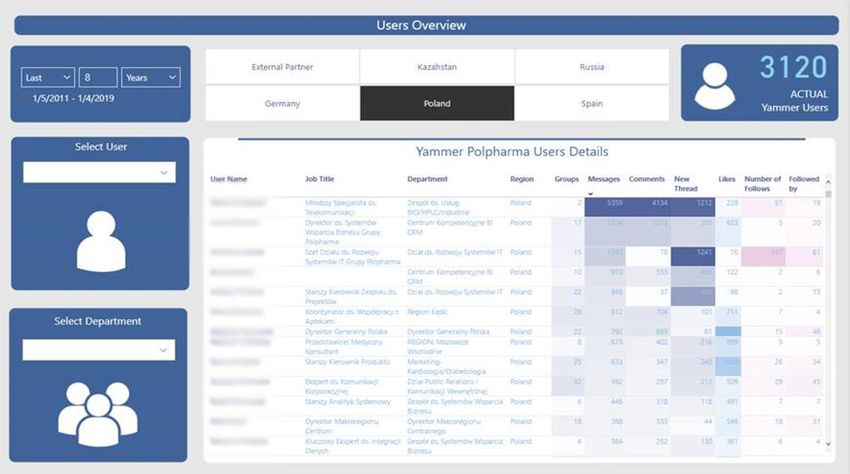
Publication by

Every organization is made of people. People who interact with
each other – over morning coffee, in meetings during the day and
at casual catch-ups in the workplace.

Nowadays, this communication also happens in electronic form:
through e-mail, phone, instant messaging or social media. This
form of interaction gives us a great opportunity to analyze the
data and pick up additional insights.

Let’s be clear: this is not about tracking people. It is about
answering questions.
Have you ever wondered who the most influential person in your
organization is? Who might be an agent of change or whom do
others consult in a given area of expertise?

These questions can be answered based on the analysis of user
interactions on social platforms.

Now: how to get these answers out of the data noise?
This looks like the right task for us and the cloud!

                                                                   2
TABLE OF CONTENTS
Publication by

      TABLE OF CONTENTS
•   The Challenge                                         5
•   Building blocks                                       5
•   The architecture                                      6
•   Rocket science: Logic Apps and their secret sauce!    8
•   About Logic App                                       8
•   Make it beautiful: Power BI                          11
•   Analysis of user activity                            12
•   Group analysis                                       13
•   Content analysis                                     14
•   What are the costs?                                  17
•   Key takeaways                                        20

                                                               4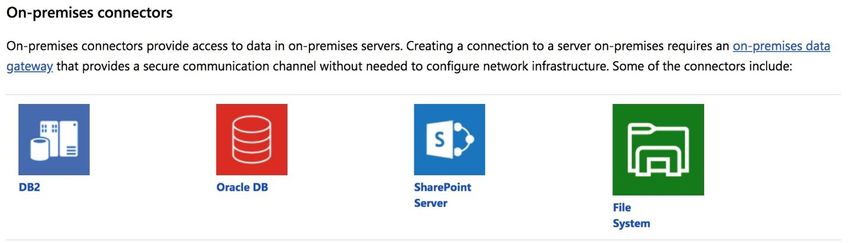
Publication by

The Challenge
You’ve certainly read our case study about implementing Yammer
for a pharmaceutical company (and if you need a recap, check
it out here. If you are not using Yammer, read on; what we’ve
described here applies to other means of communication as well.

Once the project was complete, the questions started to appear.
How are people using the network? Who is the most active
user on a given topic? Who is the focal point of conversations?

All the required data is there in the form of users’ communications
on the platform, however, what was missing was an easy way to
analyze data from these interactions. The good news for us
and our customer was that there are APIs and ways to consume
it through the cloud.

Building blocks
We’ve got our challenge. The aim: to build a solution that provides
insights into the company’s social network interactions.
Yammer provides a Rest API which allows us to consume its content
and get all the messages and interactions from its channels.

                                                                      5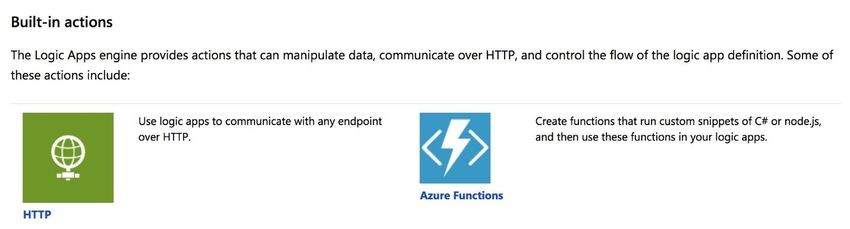
Publication by

To achieve our goal, we had to find a way to:
   •   Ingest this data into some common database
   •   Analyze this data based on the assumed metrics
   •   Present it to business users in an easy way.

Time to pick up the right tools for the job. Our choice was, surprise,
surprise… the Azure platform!

There is a new future ahead of us. A future where solutions
don’t have to be complicated and always created in complex,
customized ways. Instead, even elaborate applications will be
built on top of platform components and enhanced with some
additional code and extensions.

Another part of the future is that we can construct these solutions
on top of platform services. Call it PaaS, call it serverless. The key
is that there is no need for servers – it’s just platform services
and our code.

The architecture
We have used the following elements of the platform:
   •   Azure Functions: a serverless code execution piece of
       Azure. It allows us to execute code for data ingress in
       an easy and efficient way. Its purpose is to import data
       from data sources into common storage
   •   Azure Storage: an intermediate data store for files and
       data which is later processed

                                                                         6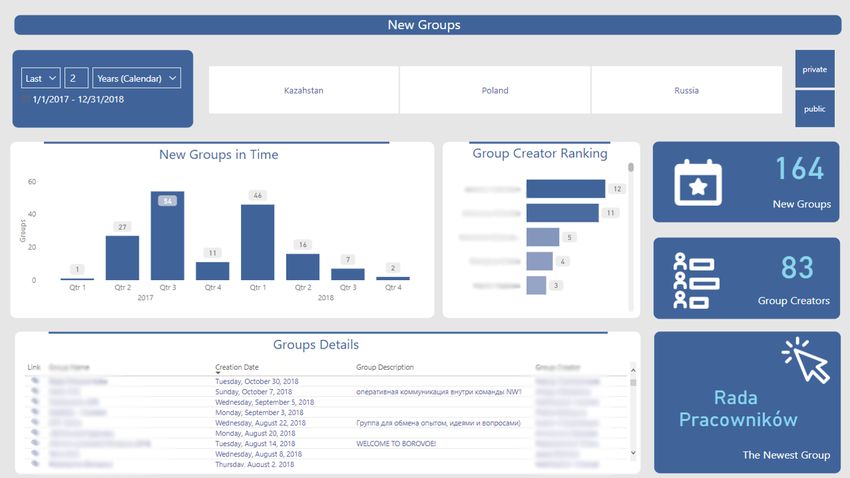
Publication by

   •   Logic App: the key element of the solution. Logic Apps
       implement data ingress and processing logic, and then
       orchestrate the entire flow
   •   Azure Cognitive Services / Text analytics: used to
       detect the sentiment of the messages on Yammer
   •   Azure SQL Database: provides the final storage and data
       warehouse where we store the information gathered
       from Yammer. It also takes part in data processing with
       stored procedures
   •   Power BI: offers an easy to use and navigate presentation
       layer.

And that’s it. The overall solution architecture built with these
components is presented below.

Image 1. Yammer Analytics solution architecture

                                                                    7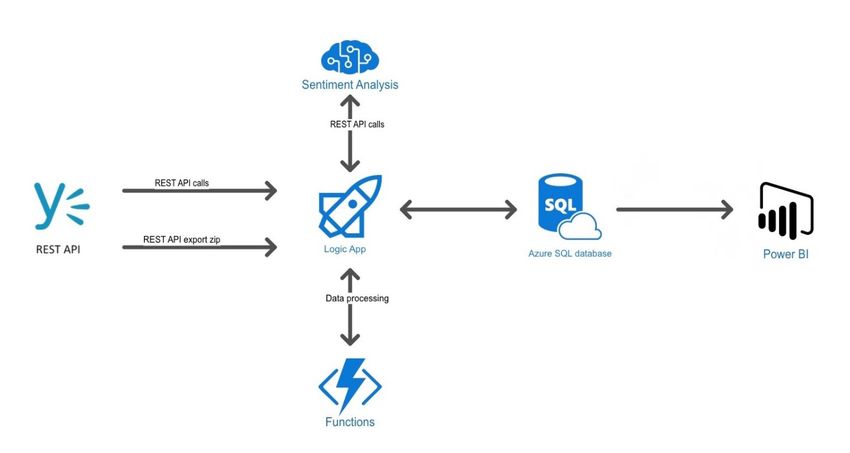
Publication by

Rocket science: Logic Apps and their secret sauce!
Looking at the solution diagram, you will notice the crucial
component of it – a ROCKET! This rocket is not rocket science. It is
Azure Logic App. Have you heard about it? If not, time to change it!

Azure Logic App is an integration platform which allows you to
build complex integration workflows between different data
sources and platforms, with additional logic added to them. Think
of it as a workflow platform for your process where the hassle of
connectivity and orchestrating the steps were taken out for you.

About Logic App
The functionalities of Logic App include:
   •   Connectivity and integration services to various data
       sources like SaaS apps or services, but also on-premises
       solutions like Oracle or SQL database through built-in
       connectors.

Image 2. On-premises connector types

                                                                       8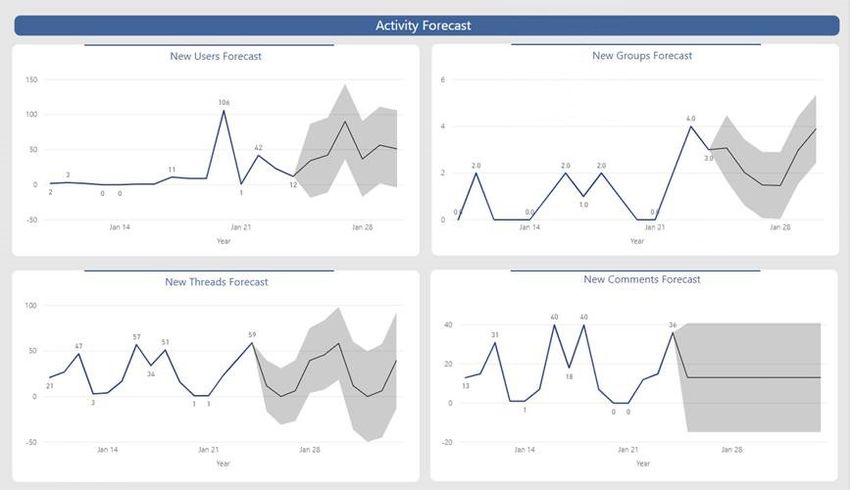
Publication by

    •   Connectivity extensibility with Azure Functions

Image 3. Additional functionalities

    •   Process steps orchestration and control with logic
        components and workflows
    •   Data format support and transformation as a part of
        a process and more.

We’ve put it at the center of our integration for data processing and
aggregation orchestration. The App Logic allows you to build your
process in a graphical way, using steps you can put together into
a solution in the visual editor.
It might be a simple flow of functions executed one after another:

Image 4. App logic basic flow

                                                                        9
Publication by

It can also be a complex app with multiple steps and conditions.
The example below presents a flow we’ve built to analyze the
sentiment of the messages posted on Yammer using Azure
Cognitive Services.

Image 5. App logic extended flow

Overall, Azure App Logic provides you with the possibility to build
your app processes in a new way – without infrastructure,
orchestrated by a platform and based more on platform
capabilities rather than on custom-built code.

Our solution is using five different apps built on top of the Logic
App, delivering the entire data ingress and processing platform.

                                                                      10
Publication by
Make it beautiful: Power BI
Getting data is one thing but getting the right insight and
providing it at the right time for users – that is a completely
different task. Even the best data is not so useful if there is no
way to analyze it easily.
We understand this business need, and we have the tool to
address it – Power BI.
If you do not know this visualization tool and would like to
become familiar with its capabilities, we encourage you to
look at this white paper.
In it you will find there our Power BI implementation analyzing
information from the CRM system for our internal reporting
of marketing data. This material also contains some simple
tips on how to build reports to be able to analyze them well.
Using Power BI, we are providing easy to consume and navigate
dashboards presenting data gathered from Yammer.
Instead of reading about it, you can see it for yourself (parts
of images have been blurred to maintain the privacy of our
customer).
We started the implementation from gathering requirements
from the customer. The client has identified the issues that are
important to he business and which are not so obvious as to be
analyzed through Yammer itself.
11Publication by
We have divided the analysis into three main areas:
• Analysis of user activity
• Group analysis
• Content analysis
Now we will go through each of them in turn.
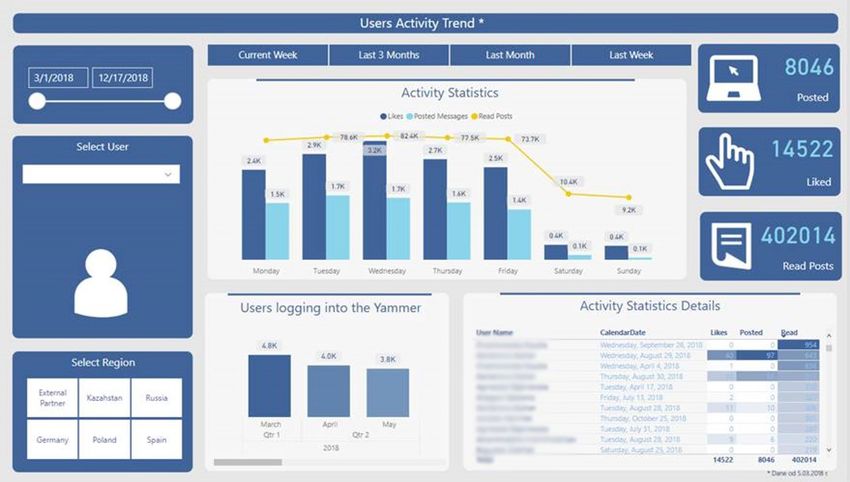
Analysis of user activity
In this part we focused on the analysis of several major activities
such as:
• New threads and comments
• Clicks on the “Like” button
• Logins to the Yammer
• Readership of the content posted on Yammer
… but also: what tools are used by users when publishing content
on Yammer and at what times they usually log on the network.
Image 6. Activity trend
12Publication by
Image 7. Message Statistics
Group analysis
This part of the reports focuses mainly on the activity within
groups. We can check:
• Which groups enjoyed the greatest popularity in the
selected period
• In which groups the messages have the most responses
• Which users have created the largest number of groups
• What are the dynamics of new group formation
Image 8. New Groups
13Publication by
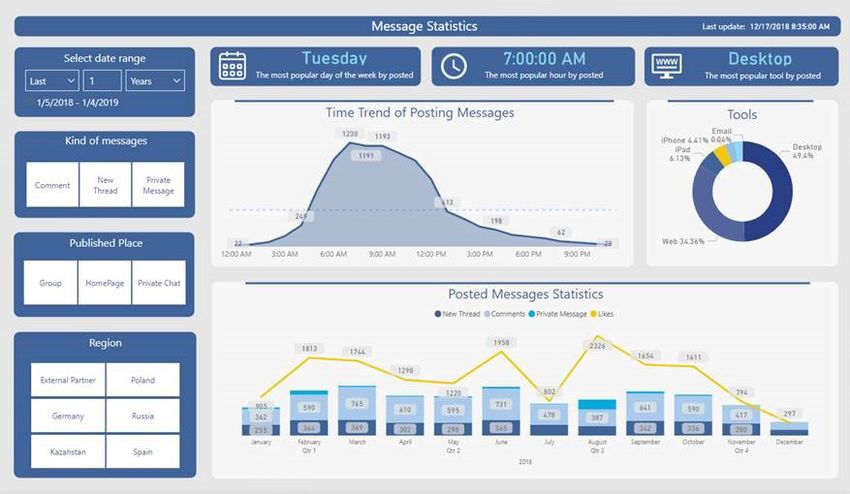
Content analysis
This part allows you to analyze the content in terms of the sentiment
of the speech, the popularity of the content, but also gives the
opportunity to browse through the categories and keywords
separated from the content of posted messages.
Thanks to this solution, we give companies the opportunity
to control the content disseminated in the organization. In
addition, it gives them opportunity to assess in which groups of
content the messages are the most popular and have the highest
response rate, which can be valuable in a situation where we want
to convey important information that is dedicated to a specific
group of employees.
Image 9. Message statistics
Presented screenshots are only a part of the whole project prepared
for our client from the pharmaceutical industry. However, the
solution we developed contains many more pages that answer the
key questions for the organization.
14Publication by
They also help to predict the activity of users in the future, in order
to effectively plan your companions in the company. These
pages show statistics about published messages, such as tools
used by users, as well as statistics on individual users.
Image 10. User overview
This is a short overview of all user activities. We can sort the list
of users and check who is the most active in terms of specific
actions on Yammer, e.g. through: writing new threads, comments,
clicking the ”Like” button or memberships in Yammer groups.
15Publication by
Image 11. Activity forecasts
This report allows us to predict users’ activity in the future by
analyzing historical data.
It is the only subset of reports we could provide to you without
disclosing our customer’s sensitive data. However, there is much,
much more you can get out of it.
16Publication by
What are the costs?
It is an excellent solution, but one can wonder: Is it expensive to
run? It has plenty of components, and we know that costs of cloud
services can get out of control.
Logic App provides a cost-effective way of executing your processes
billed per execution cost. You can find all the details on the product
page.
In our case, we knew the number of items we needed to process
and the central component of a solution, i.e. Azure Logic App.
Here is our estimation of running costs that we prepared upfront,
before project implementation:
Messages on page 50 items (Yammer Rest API constant)
Users 1700 active
Groups 180 active
Average 35 members, average 1.5 page of
Group members
messages per group
Table 1. Cost estimates assumptions
17Publication by
The solution runs on schedule, with the following estimated
elements and loops to process:
Number of billable
Operation Calculation
actions
1700 (users) / 50
(page size) = 34
Read all Users 5 + 3 per page/loop
loops 5 + 3 * 34 =
107
180 / 50 = 4
Read all Groups 5 + 3 per page/loop
5 + 3 * 4 = 17
18 * (5 + 2 *3) =
Members of each
5 + 3 per page/loop 1,980 (10 groups, 2
Group
pages each)
1700 * (5 + 3) =
Followers of each
5 + 3 per page/loop 13600 (1700 users,
User
1 page each)
Table 2. Activity estimates
Total number of actions per 107 + 17 + 1980 + 13600 =
import 15704
15704 * 0.000675 = 10.6002
Daily cost
EUR
30 imports per month 30 * 15704 = 471120
471120 * 0.000338 =
Monthly
159.23856 EUR
Table 3. Action estimates
18Publication by
To analyze the total of around 30 000 messages on a platform with
all their statistics, we estimated the usage and cost as follows:
Number of billable
Operation Calculation
actions
30 000 * (9 + 4 * 1) =
390 000 (assuming
Read all message 9 + 4 per Likes page/
an average message
metadata with Likes loop
doesn’t have more
than 50 likes)
Table 4. Usage estmiate
Total number of action per FULL
390 000
import
Cost 390 000 * 0.000338 = 131.82 EUR
Table 5. Total actions estimate
Run cost 1,245 * 0.000675 = 0.840375 EUR
1,245 * 30 = 37,350
Monthly cost (1 per day) 37,350 * 0.000675 = 25.21125
EUR
1,245 * 30 * 12 = 448,200
Monthly cost (12 per day) 448,200 * 0.000338 = 151,4916
EUR
Table 6. Total cost estimate
How close were we to the true cost? Real data usage shows that in March
2018, the real monthly cost of using App Logic on this platform was 78
EUR.
Yes. You read that right.
The cost of the solution gathering all this information and processing it
is around 80 EUR per month for all the resources.
19Publication by
Pretty good, isn’t it?
For 80 EUR you get invaluable insight into the social interactions at
your company happening on the digital platform. It gives plenty of
opportunities to explore employee potential in your organization.
What if you have a solution other than Yammer? No worries! This
approach is universal; Yammer is just a data source.
Get in touch with us, and we can help you get started!
Key takeaways
• Platform as a Service solutions make it much easier to
create solutions for data processing
• With Azure Logic App you can create a data processing
solution that can help you gain valuable business insights
• Even looking at your Yammer interactions can help you
identify the agents of change at your organization
• A comprehensive data processing solution CAN be easy
to build and inexpensive to maintain. Contact us to find
out how!
20Interested? Contact us news@predica.pl www.predica.pl
You can also read