Research on the method of children's body shape recognition based on big data technology of dressed human body - IOPscience
←
→
Page content transcription
If your browser does not render page correctly, please read the page content below

Journal of Physics: Conference Series

PAPER • OPEN ACCESS

Research on the method of children’s body shape recognition based on
big data technology of dressed human body
To cite this article: Xiaoning Jing 2021 J. Phys.: Conf. Ser. 1790 012015

View the article online for updates and enhancements.

                                This content was downloaded from IP address 46.4.80.155 on 23/03/2021 at 00:25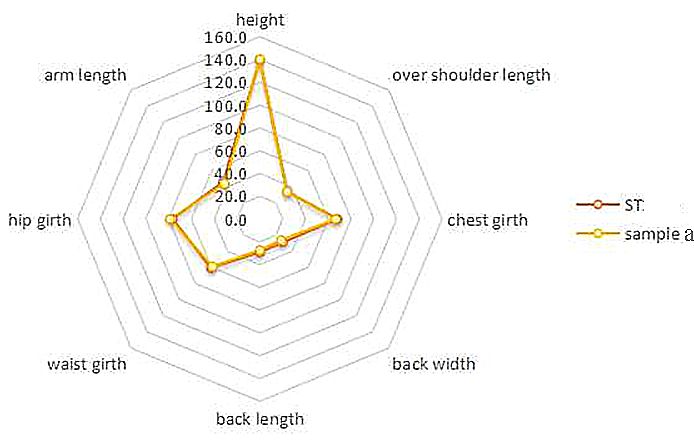
SIFTIC 2020                                                                                                     IOP Publishing
Journal of Physics: Conference Series                         1790 (2021) 012015          doi:10.1088/1742-6596/1790/1/012015

Research on the method of children's body shape recognition
based on big data technology of dressed human body

                     Xiaoning JING
                     School of Textile Science and Engineering, Tiangong University, 399 west Binshui
                     Road, Xiqing District, Tianjin, China
                     Email: jingxiaoning@tiangong.edu.cn

                     Abstract. In this paper, a large number of children samples are collected to establish a database
                     with detailed measurement index information. The data are analyzed and the figure of children
                     are divided into three types. On the basis, the Naive Bayesian (NB) algorithm is applied to the
                     study of figure discrimination, and the discriminant model is established. The discrimination of
                     children figure is realized. At the same time, based on big data theory, the similar body of the test
                     sample in the database is found through querying based on minimum difference algorithm. The
                     unknown detailed measurement data of the test sample can be replaced by the similar body, to
                     provide data support for the relevant application areas or dressed the human body that need to
                     obtain detailed measurement information about the children.

1. Introduction
Classification and discrimination of human figure has been a hot research topic in the field of human
body measurement and clothing engineering[1-3]. Many scholars have carried on the research. Many
studies mainly aimed at the classification and discrimination of adult human figure[4-5]. Children are in
the key period of growth and development, the research on their figure can guide more scientific
guidance of children clothing structure design, to meet the physiological needs. On the other hand, the
soaring consumption level of children clothing market and the growing demand for children health and
safety clothing , also prompt the children clothing industry more concern about the characteristics of
children figure to make a reasonable improvement of children clothing. Therefore, research on children
figure has become a new hot spot. Naive Bayesian algorithm is a classic classification algorithm[6-7],
which is widely used in various fields of research[8-10]. In this paper, this method is used to
discriminate the girl's figure to achieve a ideal discriminant accuracy.

2. Data acquisition and pre-processing

2.1. Data acquisition
The measurement data of 1000 children samples are collected by non-contact 3D body scanning system
of the French Lectra company.
    Measurement object: 4-12 year old girl; Height range: 104.2-160.9 cm; Weight range: 14.0-50.0 kg.
    Measurement indicators( 27 indexes): height, head height, cervical height, cervical height in sitting,
waist height, hip height, crotch height, shoulder height, chest height, neck depth, hip depth, chest depth,
length between waist line and crotch, neck girth, over shoulder length, chest width, chest girth, back
width, back length, distance between the waist and the hip, waist girth, hip girth, arm length, Wrist
              Content from this work may be used under the terms of the Creative Commons Attribution 3.0 licence. Any further distribution
              of this work must maintain attribution to the author(s) and the title of the work, journal citation and DOI.
Published under licence by IOP Publishing Ltd                          1
SIFTIC 2020 IOP Publishing
Journal of Physics: Conference Series 1790 (2021) 012015 doi:10.1088/1742-6596/1790/1/012015
circumference, maximum thigh circumference, knee circumference, ankle girth.
2.2. Data pre-processing
Through the missing value analysis, singular value analysis, normal test and correlation analysis of the
collected data, some data were eliminated, and finally, 868 measurement samples are retained.
3. Figure classification
3.1. Factor analysis to extract figure characteristic factor
Factor analysis is used to extract two feature characteristic factors according to the scree plot.
Table 1. Rotated component matrix.
Figure 1. Scree plot.
The maximum variance is used to make the orthogonal rotation of component matrix, in order to
describe the information of common factors. The rotated component matrix is shown in table 1.
The absolute value of index factor greater than 0.5 represents corresponding to the component.
Therefore, the first principal component factor contains these indexes: neck depth, hip depth, chest
depth, neck girth, over shoulder length, chest width, chest girth, back width, waist girth, hip girth, Wrist
circumference, maximum thigh circumference, knee circumference, ankle girth. Obviously, the first
principal component is a comprehensive characterization represented the lateral and circumference
dimensions of human body.
2SIFTIC 2020 IOP Publishing
Journal of Physics: Conference Series 1790 (2021) 012015 doi:10.1088/1742-6596/1790/1/012015
The second principal component factor contains: height, head height, cervical height, waist height,
hip height, crotch height, shoulder height, chest height, length between waist line and crotch, back
length, distance between waist and hip, arm length. The second principal component factor represents
height and length dimensions of human body. Therefore, according to the connotation of the principal
components, the two figure characteristic factors can be named as the lateral body circumference factor
and the longitudinal body scale factor.
3.2. Figure classification bases on k-means cluster analysis
According to the standard of two figure characteristic factor’s score, the comparison is made , which
probability of no difference between classes is less than 5%. We can get it : when the cluster number is 3
that is the most ideal class. At this time the girl’s figure is divided into three types. The table of ANOVA
is as follows when figure is divided into three types.
Table 2. ANOVA.
Table 3. Number of cases in each cluster.
Figure type “3” contains the largest number in the three figure types, occupies 46.3% of the total.
Followed by it, the proportion of figure type “1” is 27.2%. Figure type “2” is the least, accounting for
26.5% of the total sample.
3.3. Description of the three figure types
Through single factor variance analysis we can get the specific degree of 2 factors influencing on the 3
figure types. They are shown in the table 4 and the table 5. The factor 1 represents the lateral body
circumference factor. The factor 2 represents the longitudinal body scale factor. The higher of graph
feature’ score is, the greater of graph type’s influence is. Then the professional description of the figure
can be made.
Table 4. REGR factor score 1 for analysis 1.
Table 5. REGR factor score 2 for analysis 1.
3SIFTIC 2020 IOP Publishing
Journal of Physics: Conference Series 1790 (2021) 012015 doi:10.1088/1742-6596/1790/1/012015
According to the results of comparative analysis, the characteristics of three figure types are
obtained.
Table 6. The characteristics of three figure types.
figure figure characteristics
1(F) fat
2(ST) short-thin
3(T) tall
The lateral and circumference dimensions of figure type “1” are the largest of all. The horizontal and
vertical dimensions of figure type “2” are the smallest of all. And the longitudinal dimensions of figure
type “3” are the largest of all.
4. Figure discrimination
In the premise of 27 measurement index data have been known, based on the classification results of
girl's figure, the new figure discrimination can be researched. That is to say, we can know the figure type
of the new girl sample.
4.1. Bayesian theory
Bias decision theory method is a basic method in statistical model decision.
The basic idea is that:
Conditional probability density parameter expression and a prior probability have been known.
Using Bayesian formula to convert it to the posterior probability.
According to the size of the posterior probability to make the decision classification.
If, P (A) is a prior probability or edge probability of A.
P (A|B) is known as the conditional probability of A after the occurrence of B. It is called posterior
probability of A.
P (B|A) is known as the conditional probability of B after the occurrence of A. It is called posterior
probability of B.
P (B) is a prior probability of B. Then,
P A | B P B
P B | A
P A
4.2. Figure discrimination algorithm based on naive bayesian classification
Naive Bayesian method is a classification method based on the Bayesian theorem and the independent
assumption of the characteristic condition.
According to Bayesian formula:
P A | B P B
P B | A
P A
Suppose Ti is the figure types. It is known by the classification results: i=1, 2, 3.
S1 is the sample of a girl . S1 =a1,a2,...a27, a1,a2,...a27, is the 27 measurement indexes of the sample.
Then, when the data of 27 measurement indexes in sample S1 coexists and belong to the figure type
Ti ,
P S1 | Ti P Ti
P Ti | S1
The probability is P S1
According to the Naive Bayesian classification principle, hypothesis S1={a1,a2,...a27} is a sample to be
classified. a1,a2,...a27 is the 27 measurement indexes of S1.
Calculate P T1 | S1 , P T2 | S1 , P T3 | S1 ,
If PTK | S1 maxPT1 | S1 , P T2 | S1 , P T3 | S1 , then S1 ∈TK .
The conditional probability estimates of each measurement index in each figure is obtained by those
training samples which figure types have been known. That is,
4SIFTIC 2020 IOP Publishing
Journal of Physics: Conference Series 1790 (2021) 012015 doi:10.1088/1742-6596/1790/1/012015
P a1 | T1 , P a2 | T1 ,..., P a27 | T1 ; P a1 | T2 , P a2 | T2 ,..., P a27 | T2 ; P a1 | T3 , P a2 | T3 ,..., P a27 | T3
If each measurement index is in condition independent, the following deduction is based on Bias's
theorem. Because the denominator for all categories is constant, so we just would maximize the
molecular.
P S1 | Ti P Ti P a1 | Ti P a2 | Ti ...P a27 | Ti P Ti P Ti P a j | Ti
27
j 1
P Ti P a j | Ti
27
P Ti | S1 j 1
That is, P S1
Namely, the probability of each measurement index of S1 respectively belong to Ti ( i 1,2,3 ) is
calculated.
The calculated probability belonged Ti is the maximum, then S1 belongs to figure type Ti
( i 1,2,3 ).
P T2 P a j | T2
27
For example, the calculation result of j 1
is maximum. then S1 belongs to figure type T2 .
5. Algorithm validation
The whole samples are verified by naive bayes algorithm to carry out the model of figure discrimination.
The output result of program is as follows:
0| True Class: 0, Predicted: 1, Confidence: 0.9999994944058159
1| True Class: 0, Predicted: 1, Confidence: 0.9999629044874304
2| True Class: 0, Predicted: 0, Confidence: 0.9985030983737399
3| True Class: 0, Predicted: 0, Confidence: 0.9999960513692685
4| True Class: 0, Predicted: 0, Confidence: 0.9878530888292812.
50 errors were made, 5.768905472636816% error rate
The error rate of the 50 samples is about 6%, and the correct rate of the algorithm is about 94%.
6. Similar body data acquisition
The main measurement indexes of new test sample are provided. That are height, chest girth, waist girth,
hip girth, arm length, over shoulder length, back length and back width. The minimum difference
algorithm is used to search the sample in the database which is closed to the data of test sample, that is
the similar body sample.
Query threshold value is set according to size variation.
The corresponding data of similar body samples are compared with the actual data of test samples.
The fitting diagram are drawn to verify the similarity. As shown in figure 2, 3, 4, the main measurement
index data of test samples a, b, c are very consistent with the similar body samples. Under the premise of
the database sample capacity is large enough, according to the principle of full sample analysis[11-13]
and prediction principle of large data[14], It can be thought that we can use the similar body instead of
the test sample, to provide 27 measurement indexes data information.
In this way, the cumbersome and inconvenient measurement work is omitted and the cost is reduced.
The detailed information of girl’s body can be quickly output to support the related application fields of
human body engineering and garment engineering.
5SIFTIC 2020 IOP Publishing
Journal of Physics: Conference Series 1790 (2021) 012015 doi:10.1088/1742-6596/1790/1/012015
Figure 2. Fitting of main measuring indexes Figure 3. Fitting of main measuring indexes
of sample “a” and similar body. of sample “b” and similar body.
Figure 4. Fitting of main measuring indexes of sample “c” and similar body.
7. Conclusions
In this paper, a large number of girl’s measurement data are collected. The figure classification is made.
Based on Naive Bayesian algorithm, figure discrimination model is established. And the discrimination
accuracy of the model is verified. The similar body of the test sample in the database is searched out
according to the minimum difference algorithm. The main measurement index data of them are fitted.
According to the similarity, the similar body can be used instead of the test sample, to provide more
detailed data to support the data needs of relevant application areas.
References
[1] Summons K and Istook C L 2004 Female Figure Identification Technique (ffit) for Apparel
PartⅠ: Describing Females Shapes ( Journal of Textile and Apparel Technology and
Management vol 4) pp 1-16.
[2] Vuruskan A and Bulgun E 2011 Identification of Female Body Shapes Based on Numerical
Evaluations ( International Journal of Clothing Science and Technology vol 23) pp 46-60.
[3] Connell L J and Ulrich P 2002 Body Scan Analysis for Fit Models Based on Body Shape and
Posture Analysis ( National Textile Center Annual Report vol 11) pp 31-37.
[4] Yang L and Chunting Y 2010 A Novel Method for Body Shape Analysis in E-mtm (Applied
Mechanics and Materials vol 20-23) pp 1482-1486.
[5] Song H K and Ashdown S P 2011 Categorization of Lower Body Shapes for Adult Females
Based on Multiple View Analysis (Source: Textile Research Journal vol 81) pp 914-931.
[6] Yaner RR 2006 An Extension of the Naive Bayesian Classifier (Information Sciences vol 176)
pp 577-588.
6SIFTIC 2020 IOP Publishing
Journal of Physics: Conference Series 1790 (2021) 012015 doi:10.1088/1742-6596/1790/1/012015
[7] Flach P A and Lachiche N 2004 Naive Bayesian Classification of Structured Data (Machine
Learning vol 57) pp 233-269.
[8] Derouin F and Sarfati C 2007 Naive Bayesian Classifier for Incident Duration Prediction
(Transportation Research Board Meeting vol 51) pp 800-807.
[9] Ratanamahatana C A and Gunopulos D 2003 Feature Selection for The Naive Bayesian
Classifier Using Decision Trees (Applied Artificial Intelligence vol 17) pp 475-487.
[10] Wang X Z and He Y L 2014 Non-naive Bayesian Classifiers for Classification Problems with
Continuous Attributes (IEEE Transactions on Cybernetics vol 44) pp 21-39.
[11] Big data successfully predicted USA election [EB/OL].[2014-02-25]. Http://www.china-
bigdata. com.
[12] Mayerschonberger V and Cukier K 2013 Big data: a revolution that will transform how we live,
work and think (England: Hodder Export Press) pp 39.
[13] Big data [EB/OL]. [2014-05-07]. Http://www. wikipedia.org.
[14] Alexander M and Konrad B 2014 Psycho- informatics: big data shaping modern psychometrics
(Medical Hypotheses vol 82) pp405-411.
7You can also read