BlueBay Asset Management Le prospettive dei mercati obbligazionari emergenti nel 2021 Convegno virtuale - Itinerari Previdenziali 19 Gennaio 2021 ...

Page created by Jon Warner
 
CONTINUE READING
BlueBay Asset Management Le prospettive dei mercati obbligazionari emergenti nel 2021 Convegno virtuale - Itinerari Previdenziali 19 Gennaio 2021 ...
BlueBay Asset Management
Le prospettive dei mercati obbligazionari emergenti
nel 2021
Convegno virtuale – Itinerari Previdenziali
19 Gennaio 2021
Polina Kurdyavko
Partner, Head of Emerging Markets,
Senior Portfolio Manager

                                                Per Investitori Professionali
Performance 2020 delle principali classi di attivo

Major asset class returns
              EM Equities                                                                                                                                         18.5%
              US Equities                                                                                                                                        18.4%
                     US IG                                                                               10.2%
        EM IG Corporate                                                               7.6%
           EM Corporate                                                             7.3%
        EM HY Corporate                                                        6.6%
     EM Local Corporate                                                5.5%
            EM Sovereign                                              5.3%
            US High Yield                                            5.2%
     EM Local Sovereign                              2.7%
                   Euro IG                       2.3%
          Euro High Yield                     1.9%

                              0%            2%              4%         6%             8%           10%           12%          14%           16%           18%            20%

Source: JP Morgan, MSCI, BAML, S&P and Bloomberg, as at 31 December 2020. Note: EM Corporate: JPM CEMBI Diversified; EM IG Corporate: JPM CEMBI Diversified IG; EM HY           2
Corporate: JPM CEMBI Diversified HY; EM Sovereign: JPM EMBI Global Diversified; EM Local Sovereign: JPM GBI-EM Global Diversified; US IG: JULI ex EM (US HG); Euro IG: MAGGIE
(Euro HG); US High Yield: ICE BofA US High Yield Index; Euro High Yield: ICE BofA European High Yield Index; EM Local Currency Corporate: BAML ML Diversified Local EM Non-
Sovereign Index USD; US Equities: S&P 500; EM Equities: MSCI Emerging Markets Index
L’incremento dell’indebitamento dei paesi emergenti è inferiore
rispetto a quello dei paesi sviluppati
Increase in gross debt to GDP from end-2019 to end-2020(F)
30                                            28.2                                                                                       End-2020(F) Gross Debt
                         26.0
                                                                                                                            G7                      141% of GDP
25   22.7                                            22.7 22.5                                                              EM                       61% of GDP
                                20.6
20
                                                                                                        17.0         16.5                                                    16.7
                                                                                    15.9
15                14.1                 13.8                                                                                                               14.0
                                                                 11.9
                                                                                                 11.1                                    11.8 12.4 11.9
            9.2                                                                                                                   10.3
10                                                                            9.1          8.9                                                                                      8.7
                                                                                                               8.0                                               8.1
                                                                                                                            6.5
                                                                        4.9                                                                                            5.0
 5

 0

Source: BlueBay Asset Management, [Data: IMF World Economic Outlook], as at 13 October 2020                                                                                               3
Note: End-2020(F): End of year 2020 forecasts by IMF. G7: Major advanced economies (G7), EM: Emerging market and developing economies
Le società dei paesi emergenti sono in una posizione di forza
rispetto alle società dei paesi sviluppati
                                                                                                  Historical default rates: EM HY corporates relative to
Net EM leverage lower than US                            corporates 1                             US peers 2
 3.5                                                                                                                 20%
                     Global EM Net Leverage (x)                                                                                                                                        EM Corporate HY
                                                                                                                     15%                                                               US HY
                     US Net Leverage (x)

                                                                                                  Default rates
 3.0                                                                                                                 10%

                                                                                                                     5%

                                                                                                                     0%
 2.5

                                                                                                                              2000
                                                                                                                              2001
                                                                                                                              2002
                                                                                                                              2003
                                                                                                                              2004
                                                                                                                              2005
                                                                                                                              2006
                                                                                                                              2007
                                                                                                                              2008
                                                                                                                              2009
                                                                                                                              2010
                                                                                                                              2011
                                                                                                                              2012
                                                                                                                              2013
                                                                                                                              2014
                                                                                                                              2015
                                                                                                                              2016
                                                                                                                              2017
                                                                                                                              2018
                                                                                                                              2019
                                                                                                                              2020
                                                                                                                           2021 (F)
 2.0
                                                                                                  EM corporate recovery rates versus US HY 3

                                                                                                                           52%

                                                                                                                                                 50%
                                                                                                                                                 49%

                                                                                                                                                          53%

                                                                                                                                                                  53%

                                                                                                                                                                         48%
                                                                                                                                                                               49%

                                                                                                                                                                                              53%

                                                                                                                                                                                                            50%
                                                                                                                     60%

                                                                                                                                                                                              46%
 1.5

                                                                                                                                                                        45%
                                                                                                                                          42%

                                                                                                                                                                                                                    42%
                                                                                                                                          41%

                                                                                                                                                                                                     40%
                                                                                                                                                                                                     39%

                                                                                                                                                                                                                            38%
                                                                                                                                   36%
                                                                                                                                   35%

                                                                                                                                                                34%

                                                                                                                                                                                        31%
                                                                                                    Recovery Rates

                                                                                                                                                                                       28%
                                                                                                                             27%
                                                                                                                     40%

                                                                                                                                                                                 25%

                                                                                                                                                                                                                               25%
                                                                                                                                                                                                              23%
                                                                                                                                                        21%

                                                                                                                                                                                                                      21%
 1.0
                                                                                                                     20%

 0.5                                                                                                                  0%

                                                                                                                            2008

                                                                                                                                   2009

                                                                                                                                          2010

                                                                                                                                                 2011

                                                                                                                                                         2012

                                                                                                                                                                 2013

                                                                                                                                                                        2014

                                                                                                                                                                                2015

                                                                                                                                                                                       2016

                                                                                                                                                                                              2017

                                                                                                                                                                                                     2018

                                                                                                                                                                                                             2019

                                                                                                                                                                                                                     2020

                                                                                                                                                                                                                             2021(F)
       2008

              2009

                     2010

                            2011

                                   2012

                                          2013

                                                 2014

                                                        2015

                                                               2016

                                                                      2017

                                                                             2018

                                                                                    2019

                                                                                           2020

                                                                                                                                                         EM Corporate HY                US HY

Source: BAML. Notes: 1 Latest data as at 30 June 2020; 2 Source: JP Morgan. Latest data at 31 December 2020.                                                                                                                           4
3 Source: JP Morgan. Recovery rates are issuer-weighted and based on price 30 days after default date. 2021(F) EM corporate recovery rate expectation is 35-40%.
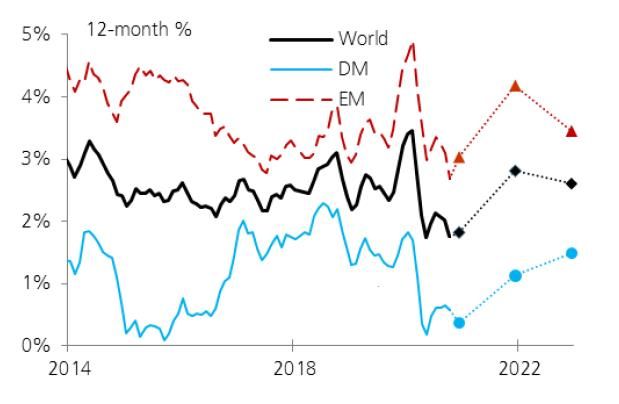
Latest data at 31 December 2020. For illustrative purposes only. There is no assurance that any of the trends depicted or described herein will continue
La ripresa economica prevista nei paesi emergenti supera quella dei
paesi sviluppati
GDP Growth                                                                                          Global Inflation
10
                                                                                        8.2
 8                                                                          7.4
                  6.7
                                          6.1
 6    4.9                                                                         4.6
                              4.0                                                             3.8
 4                      3.0
            2.2                                 2.2             2.1
                                    1.6
 2

 0

 -2
             Developing Economies
                                                      -2.3
 -4          Advanced Economies
                                                                     -3.6
             China
 -6                                                          -5.2
             US
 -8
            2018                    2019                      2020            2021(F)

Source: Bloomberg, BlueBay Asset Management, UBS Global Economic Outlook as at 31 December 2021. For illustrative purposes only. There   5
is no assurance that any of the trends depicted or described herein will continue
Tassi reali USA negativi e miglioramento della bilancia commerciale
dei paesi emergenti sosterranno gli attivi in valuta locale nel 2021
                                                                              Change in current account balance as % of GDP
10 year US      real rates 1                                                  2019–2020 2
 6.0                                                                             4.0    3.0
 5.0                                                                             3.0
                                                                                 2.0                      1.4                 1.6                        1.4
                                                                                                                      1.2
 4.0                                                                             1.0              0.3
 3.0                                                                             0.0
                                                                                -1.0
 2.0
                                                                                -2.0
 1.0                                                                            -3.0
                                                                                                                                       -2.7
 0.0                                                                            -4.0
                                                                                -5.0
 -1.0                                                                                                                                           -4.8
                                                                                -6.0

                                                                                         Brazil

                                                                                                                              Mexico

                                                                                                                                       Russia
                                                                                                                      India

                                                                                                                                                Turkey
                                                                                                  China

                                                                                                          Indonesia

                                                                                                                                                         South Africa
 -2.0
                                    2004

                                                                       2020
        1990

               1994

                      1997

                             2000

                                           2007

                                                  2010

                                                         2013

                                                                2017

Source: Bloomberg, BlueBay Asset Management. Notes: 1 Real 10 year yield based on core CPI. 2 IMF World Economic Outlook, as at                                         6
13 October 2020. For illustrative purposes only. There is no assurance that any of the trends depicted or described herein will continue
Debito EM in valuta locale:
valute attraenti & rendimenti interessanti
Average EM effective real exchange rate 1                                                     Selected EM local yields versus UST5yr 2

1 Note: Average emerging market real (inflation-adjusted) effective exchange rate and deviation from rolling 10-year average. Source: BIS and BlueBay estimates; latest    7
monthly data for July 2020 2 Note: Simple average of Brazil and South Africa10yr and 5yr rates for Chile, Colombia, Czech, Hungary, Indonesia, Malaysia, Mexico, Peru,
Poland, Romania, Russia, Thailand and Turkey. 5yr US Treasury yield. Source: Bloomberg and BlueBay estimates; latest data at 14 January, 2021. For illustrative purposes
only. There is no assurance that any of the trends depicted or described herein will continue
Debito EM in valuta forte: spreads HY ancora interessanti, riteniamo
che la differenziazione relativa tra gli emittenti sarà cruciale nel 2021
EM sovereign HY spread are still wider than pre-Covid
levels, unlike IG which has seen rapid tightening                           Top and bottom performers in Calendar Year 2020
   450        EMBI GD IG STW                                  1,300          EM HC Sovereign     % return     EM HC Corporate     % return
                                                                             Uruguay               17.2       Paraguay              15.0
              5yr IG Average
                                                                             Tajikistan            14.9       Azerbaijan            14.1
   400        EMBI GD HY STW                                  1,100          Dominican Rep         13.8       Egypt                 13.8
              5yr HY Average                                                 Guatemala             13.7       Ukraine               13.3
   350                                                                       Nigeria               13.6       Mexico                12.7
                                                              900            Ivory Coast           13.5       Zambia                12.2
                                                                             Senegal               12.8       Israel                11.2
   300                                                                       Chile                 12.8       Colombia               9.7

                                                                    (HY)
(IG)

                                                              700            Paraguay              12.5       Brazil                 9.6
   250                                                                       Jordan                12.4       Turkey                 9.0
                                                                             Costa Rica            -1.5       Philippines            5.4
                                                              500            El Salvador           -8.3       South Africa           5.4
   200                                                                       Suriname              -9.3       Poland                 5.1
                                                                             Zambia               -17.6       Bahrain                5.0
                                                              300            Belize               -17.9       Argentina              3.6
   150
                                                                             Argentina            -23.8       Chile                  0.3
                                                                             Sri Lanka            -31.3       Ghana                 -2.7
   100                                                        100            Venezuela            -31.6       Jamaica               -3.0
     Dec-18   May-19     Oct-19   Mar-20   Jul-20    Dec-20                  Ecuador              -50.0       Kazakhstan           -15.3
                                                                             Lebanon              -74.6       Tanzania              -19

Source: Bloomberg, BlueBay Asset Management, as at 31 December 2020. For illustrative purposes only. There is no assurance that any of the   8
trends depicted or described herein will continue
Un approccio flessibile che mira a catturare i rialzi di mercato e a
proteggere dai ribassi
Emerging Market Unconstrained Bond Fund: annual performance (gross of fees) (%) 1
          25
                                                                                                                                                      19.01                     1      QE driven EM bull market
          20                                                                                                                                                                           2010–2012
                                                                                                                                         15.88
          15                                 13.11                                                                                                                              2      EM bear market since Taper
                                                                                                 10.52         10.69                                                                   Tantrum
                                                                                                                                                                                       2013–2015
          10
                   6.43
    (%)

                                5.66                                                                                                                                            3      EM recovery
           5                                                                                                                                                                           2016–2017

                                                                                                                                                                                4      EM external funding crisis
           0                                                                                                                                                                           2018
                                                                       -0.09                                                -1.06
                                                          -1.38                                                                                                                 5      EM recovery driven
           -5                                                                                                                                                                          by global central bank easing
                                                                                     -4.62
                                                                                                                                                                                       2019
          -10                     1                                       2                                3                   4            5            6
                                                                                                                                                                                6      EM twin shock from covid-19/oil
                  Partial       2011         2012         2013         2014          2015         2016         2017         2018          2019         2020                            price crisis
                   2010                                                                                                                                                                2020 YTD
Performance analysis (gross of fees) 2
                                                                                                 Fund (Gross) 1                     50/50 sovereign market 3
Annualised return (%)                                                                                     6.84                                         4.37
Annualised volatility(%)                                                                                  7.34                                         9.34
Return/volatility                                                                                         0.93                                         0.46

Source: BlueBay Asset Management, as at 31 December 2020. Note: 1 Fund inception date: 20 July 2010. 2 Risk statistics are annualized and calculated using weekly data points since inception. Risk statistics will be        9
produced once there are 12 complete months of data available; for meaningful results, a minimum sample of 36 data points is recommended and where history is less than 3 years caution should be taken with the
interpretation and representation of this data. Returns for periods of less than 1 year have not been annualized in accordance with current industry standard reporting practices. 3 50/50 blended sovereign market is: 50%
JPM EMBI Global Div, 50% JPM GBI – EM Global Div USD unhedged Past performance is not indicative of future results. Performance based on gross returns. Please refer to the Disclaimer located at the back of this
presentation for important information regarding the past, gross performance shown above
Tassi d’interesse locali, rischio sovrano e valute attivamente gestiti
Local interest rate duration (years)                                                                Total spread duration (years)
                     6.0                                                                                10.0

                     4.0
                                                                                                            5.0

                                                                                                    Years
   Years

                     2.0
                                                                                                            0.0
                     0.0

                -2.0                                                                                        -5.0
                   Dec-15       Oct-16   Aug-17    Jun-18   Apr-19     Feb-20     Dec-20                       Dec-15   Oct-16   Aug-17   Jun-18   Apr-19   Feb-20    Dec-20

FX delta (+1%) (exposure, % of NAV)
                     100
Exposure, % of NAV

                     50

                      0

                     -50
                       Dec-15       Jun-16        Dec-16      Jun-17            Dec-17     Jun-18             Dec-18        Jun-19        Dec-19      Jun-20         Dec-20

Source: BlueBay Asset Management, 31 December 2015 to 31 December 2020. For illustrative purposes only. There is no assurance that any                                        10
of the trends depicted or described herein will continue
Conclusioni per gli investitori EM nel 2021
 Crescita economica                                              Inflazione
• Recovery in growth likely to remain key focus for             • After a period of unprecedented monetary and fiscal
  investors in 2021                                               easing we would be cautiously watching the signs of
• The roll out of the vaccines will play a key role in this       inflation picking up
  regard                                                        • Higher energy prices in 2021 relative to 2020 also likely
• It is likely that there would be some differentiation           to play a role
  driven by the speed of the rollout and resulting growth
  recovery

 Differenziazione della performance tra gli emittenti            Opportunità nelle ristrutturazioni del debito
• With beta return likely to be muted in 2021 relative to       • Stressed issuers who are looking to possibly
  last year, the sources of alpha generation will, in our         restructure their debt stock could be a source of strong
  view, be driven by bottom up differentiation                    return
• We see many areas of opportunity in EM corporate              • We would be focussed on names such as Sri Lanka,
  sector as well as Sovereign HY sector                           Zambia as well as corporates in Argentina for possible
                                                                  opportunities

Source: BlueBay Asset Management views, as at 10 January 2021                                                             11
Disclaimer
This document may be produced and issued by the following entities: in the European Economic Area (EEA), by BlueBay Funds                Any investor who proposes to subscribe for an investment in any of the BlueBay products must be able to bear the risks involved
Management Company S.A. (the ManCo), which is regulated by the Commission de Surveillance du Secteur Financier (CSSF). In                and must meet the respective products suitability requirements. No assurance can be given that the investment objectives will
Germany and Italy, the ManCo is operating under a branch passport pursuant to the Undertakings for Collective Investment in              be achieved. BlueBay products may be speculative and involve a substantial degree of risk. The products may be leveraged and
Transferable Securities Directive (2009/65/EC) and the Alternative Investment Fund Managers Directive (2011/61/EU). In the               engage in other speculative investment practices that may increase the risk of investment loss. An investor must realise that he
United Kingdom (UK) by BlueBay Asset Management LLP (BBAM LLP), which is authorised and regulated by the UK Financial                    or she could lose all or a substantial amount of his or her investment. The investments and strategies discussed here may not be
Conduct Authority (FCA), registered with the US Securities and Exchange Commission (SEC) and is a member of the National                 suitable for all investors; if you have any doubts you should consult your investment adviser. You should read the prospectus or
Futures Association (NFA) as authorised by the US Commodity Futures Trading Commission (CFTC). In United States, by BlueBay              offering documents carefully before investing in any BlueBay Strategy.
Asset Management USA LLC which is registered with the SEC and the NFA. In Switzerland, by BlueBay Asset Management AG                    Investments in the BlueBay products may be highly illiquid and there may not be a secondary market for an investor’s interest in
where the Representative and Paying Agent is BNP Paribas Securities Services, Paris, succursale de Zurich, Selnaustrasse 16, 8002        the products, in which case none should be expected to develop. There are restrictions on transferring interests in the funds. The
Zurich, Switzerland. The place of performance is at the registered office of the Representative. The courts of the registered office     fees and expenses charged may offset the funds trading profits. The instruments in which the products invest may involve
of the Swiss representative shall have jurisdiction pertaining to claims in connection with the distribution of shares in                complex tax structures and there may be delays in distributing important tax information. The funds are not required to provide
Switzerland. The Prospectus, the Key Investor Information Documents (KIIDs), where applicable, the Articles of Incorporation and         periodic pricing or valuation information to investors with respect to its individual investments.
any other document required, such as the Annual and Semi-Annual Reports, may be obtained free of charge from the                         While gross of fee figures would reflect the reinvestment of all dividends and earnings, it would not reflect the deduction of
Representative in Switzerland. In Japan, by BlueBay Asset Management International Limited which is registered with the Kanto            investment management and performance fees. An investor’s return will be reduced by the deduction of applicable fees which
Local Finance Bureau of Ministry of Finance, Japan. In Australia, BlueBay is exempt from the requirement to hold an Australian           will vary with the rate of return on the fund. For example, if there was an annualised return of 10% over a 5-year period then the
financial services license under the Corporations Act in respect of financial services as it is regulated by the FCA under the laws of   compounding effect of a 0.60% management fee and a 0.20% performance fee would reduce the annualised return to 9.32%
the UK which differ from Australian laws. In Canada, BBAM LLP is not registered under securities laws and is relying on the              (figures used are only to demonstrate the effect of charges and are not an indicator of future performance). In addition, the
international dealer exemption under applicable provincial securities legislation, which permits BBAM LLP to carry out certain           typical fees and expenses charged to a fund will offset the fund’s trading profits. A description of the specific fee structure for
specified dealer activities for those Canadian residents that qualify as "a Canadian permitted client”, as such term is defined          each BlueBay strategy is contained in the fund’s prospectus.
under applicable securities legislation. The BlueBay group entities noted above are collectively referred to as “BlueBay” within         Unless otherwise stated, performance data is unaudited and net of management, performance and other fees. The investments
this document. The registrations and memberships noted should not be interpreted as an endorsement or approval of BlueBay                discussed may fluctuate substantially in value and you may not get back the amount invested. An investor’s actual performance
by the respective licensing or registering authorities. To the best of BlueBay’s knowledge and belief this document is true and          and fees may differ from the performance information shown due to capital contributions, redemptions or withdrawals. All
accurate at the date hereof. BlueBay makes no express or implied warranties or representations with respect to the information           investments involve risk including the loss of principal and there is no guarantee that the fund investment objectives will be
contained in this document and hereby expressly disclaim all warranties of accuracy, completeness or fitness for a particular            achieved. You should read the prospectus carefully before investing in any BlueBay fund.
purpose. The document is intended only for “professional clients” and “eligible counterparties” (as defined by the Markets in
                                                                                                                                         Net performance figures reflect the reinvestment of all dividends and earnings, and the deduction of investment management
Financial Instruments Directive (“MiFID”) )or in the US by “accredited investors” (as defined in the Securities Act of 1933) or
                                                                                                                                         and performance fees. In addition, the typical fees and expenses charged to a fund will offset the fund’s trading profits. The
“qualified purchasers” (as defined in the Investment Company Act of 1940) as applicable and should not be relied upon by any
                                                                                                                                         specific fee structure is detailed in the fund’s offering materials and/or prospectus.
other category of customer.
                                                                                                                                         Any indices shown are presented only to allow for comparison of the BlueBay fund’s performance to that of certain widely
In the United States, this document may also be provided by RBC Global Asset Management (U.S.) Inc. ("RBC GAM-US"), an SEC
                                                                                                                                         recognised indices. The volatility of the indices may be materially different from the individual performance attained by a
registered investment adviser. RBC Global Asset Management (RBC GAM) is the asset management division of Royal Bank of
                                                                                                                                         specific fund or investor. In addition, the BlueBay fund holdings may differ significantly from the securities that comprise the
Canada (RBC) which includes BBAM LLP, RBC GAM-US, RBC Global Asset Management (Asia) Limited and RBC Global Asset
                                                                                                                                         indices shown. Investors cannot invest directly in an index.
Management Inc., which are separate, but affiliated corporate entities.
                                                                                                                                         Return objectives, to the extent they are provided, are used solely for illustration and discussion purposes and as an aid to
This document has been prepared solely for informational purposes and does not constitute an offer or recommendation to buy
                                                                                                                                         prospective investors to evaluate a particular investment strategy. Such targets or objectives reflect the subjective input of the
or sell any security or investment product or adopt any specific investment strategy in any jurisdiction. No BlueBay fund will be
                                                                                                                                         Investment Manager based upon a variety of factors, including but not limited to, the investment strategy and it prior
offered, except pursuant and subject to the offering memorandum and subscription materials for such fund (the “Offering
                                                                                                                                         performance, volatility measures, portfolio characteristics, risks and market conditions. Performance targets or objectives should
Materials”). This document is for general information only and is not a complete description of an investment in any BlueBay
                                                                                                                                         not be relied upon as an indication of actual or projected performance. Actual volatility and returns depend upon a variety of
fund. If there is an inconsistency between this document and the Offering Materials for the BlueBay fund, the provisions in the
                                                                                                                                         factors. No representation is made any targets or objectives will be achieved, in whole or in part.
Offering Materials shall prevail. You should read the Key Investor Information Document, where applicable, or the Prospectus
carefully before investing in any BlueBay fund. Recipients are strongly advised to make an independent review with their own             No part of this document may be reproduced, redistributed or passed on, directly or indirectly, to any other person or published,
advisors and reach their own conclusions regarding the investment merits and risks, legal, credit, tax and accounting aspects of         in whole or in part, for any purpose in any manner without the prior written permission of BlueBay. Copyright 2021 © BlueBay, is
all transactions.                                                                                                                        a wholly-owned subsidiary of RBC and BBAM LLP may be considered to be related and/or connected to RBC and its other
                                                                                                                                         affiliates.® Registered trademark of RBC. RBC GAM is a trademark of RBC. BlueBay Funds Management Company S.A., registered
Past performance is not indicative of future results.
                                                                                                                                         office 4, Boulevard Royal L-2449 Luxembourg, company registered in Luxembourg number B88445. BlueBay Asset Management
The investments discussed may fluctuate in value and you may not get back the amount invested. There is no guarantee that the            LLP, registered office 77 Grosvenor Street, London W1K 3JR, partnership registered in England and Wales number OC370085. The
objectives shown will be achieved. Changes in rates of exchange may have an adverse effect on the value of investments.                  term partner refers to a member of the LLP or a BlueBay employee with equivalent standing. Details of members of the BlueBay
Investment in derivatives may involve a high degree of gearing or leverage, so that a relatively small movement in the price of          Group and further important terms which this message is subject to can be obtained at www.bluebay.com. All rights reserved.
the underlying investment results in a much larger movement in the price of the instrument, as a result of which prices are more
volatile. The BlueBay products are subject to various other risk factors and conflicts of interest.
You can also read