BOYD GROUP SERVICES INC - Investor Presentation January 2022

Page created by Joel Washington
 
CONTINUE READING
BOYD GROUP SERVICES INC - Investor Presentation January 2022
BOYD GROUP SERVICES INC.
    Investor Presentation
       January 2022

                            1
BOYD GROUP SERVICES INC - Investor Presentation January 2022
Forward-Looking Statements

This presentation contains forward-looking statements, other than historical facts, which
reflect the view of the Company's management with respect to future events. Such
forward-looking statements reflect the current views of the Company's management
and are made on the basis of information currently available. Although management
believes that its expectations are reasonable, it can give no assurance that such
expectations will prove to be correct. The forward-looking statements contained herein
are subject to these factors and other risks, uncertainties and assumptions relating to
the operations, results of operations and financial position of the Company. For more
information concerning forward-looking statements and related risk factors and
uncertainties, please refer to the Boyd Group’s interim and annual regulatory filings.

                                                                                         2
BOYD GROUP SERVICES INC - Investor Presentation January 2022
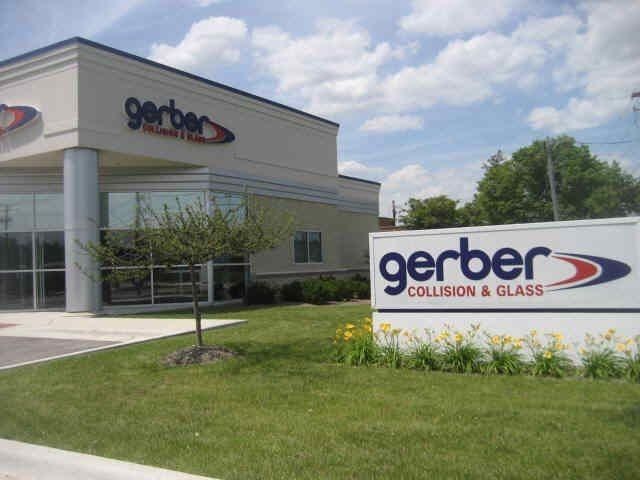
Capital Markets Profile (as at January 3, 2022)

 Stock Symbol:                          TSX: BYD.TO

 Shares Outstanding:                       21.5 million

 Price (January 3, 2021):                   C$199.62

 52-Week Low / High:                 C$183.00/$267.00

 Market Capitalization:              C$4,286.3 million

 Annualized Dividend (per share):             C$0.576

 Current Yield:                                  0.3%

                                                          3
BOYD GROUP SERVICES INC - Investor Presentation January 2022
Company Overview

 •     Leader and one of the largest operators of collision repair shops in North
       America by number of locations (non-franchised)
 •     Consolidator in a highly fragmented US$36.9 billion market
 •     Second largest retail auto glass operator in the U.S.
 •     Only public company solely focused on auto collision repairs in North America
 •     Recession resilient industry

     Revenue Contribution:
                                                         By Payor
                 By Country                                             < 10%
 10-15%                                                                 Customer Pay/Other
 Canada

                      U.S.                                 > 90%
                                                         Insurance

                                                                                      4
BOYD GROUP SERVICES INC - Investor Presentation January 2022
Collision Operations

  •   841 company operated collision
      locations across 31 U.S. states and 5
      Canadian provinces
  •   Operate full-service repair centers
      offering collision repair, glass repair
      and replacement services
  •   Strong relationships with insurance
      carriers
  •   Process improvement initiatives

                                                5
BOYD GROUP SERVICES INC - Investor Presentation January 2022
North American Collision Repair Footprint
 Canada
 •
 •
     Ontario (84)
     British Columbia (17)
                                                  132
                                                  locations
 •   Alberta (14)
 •   Manitoba (13)
 •   Saskatchewan (4)

Note: The above numbers include 35 intake locations.

 U.S.
 •   Michigan (74)         •   Louisiana (14)
                                                  709
                                                  locations
 •   Illinois (71)         •   Kansas (13)
 •   Florida (69)          •   Maryland (12)
 •   New York (40)         •   Oregon (12)
 •   Washington (38)       •   Nevada (10)
 •   Indiana (37)          •   Tennessee (10)
 •   Georgia (35)          •   Pennsylvania (9)
 •   North Carolina (32)   •   Alabama (7)
 •   Ohio (32)             •   Missouri (7)
 •                                                                Hawaii
     Wisconsin (30)        •   Kentucky (4)
 •   Arizona (27)          •   Utah (4)
 •   Oklahoma (27)         •   Hawaii (3)
 •   California (25)       •   Arkansas (2)
 •   Texas (24)            •   Idaho (1)
 •   Colorado (21)         •   Iowa (1)
 •   South Carolina (18)
Note: The above numbers include 35 intake locations and 2 fleet
locations co-located with collision repair centers.

                                                                           6
BOYD GROUP SERVICES INC - Investor Presentation January 2022
Glass Operations

 • Retail glass operations across 35 U.S.
   states
     ▪ Asset light business model

 • Third-Party Administrator (“TPA”)
   business that offers glass, emergency
   roadside and first notice of loss services
   with approximately:
     ▪ 5,500 affiliated glass provider locations
     ▪ 15,000 affiliated roadside and towing service
       providers

 • Canadian Glass Operations are
   integrated in the collision business

                                                       7
BOYD GROUP SERVICES INC - Investor Presentation January 2022
North American Glass Footprint

     U.S.

 •    Alabama                           •   Nevada
 •    Arizona                           •   New Hampshire
 •    California                        •   New York
 •    Colorado                          •   North Carolina
 •    Connecticut                       •   Ohio
 •    District of Columbia              •   Oklahoma
 •    Florida                           •   Oregon
 •    Georgia                           •   Pennsylvania
 •    Idaho                             •   Rhode Island
 •    Illinois                          •   Tennessee
 •    Indiana                           •   Texas
 •    Kentucky                          •   Utah
 •    Louisiana                         •   Virginia
 •    Massachusetts                     •   Washington
 •    Maryland                          •   West Virginia
 •    Michigan                          •   Wisconsin
 •    Minnesota                         •   Wyoming
 •    Missouri

Note: TPA business provides glass services in the balance of
the 50 states through affiliated glass providers.

                                                               8
BOYD GROUP SERVICES INC - Investor Presentation January 2022
Market Overview & Business
         Strategy

                             9
BOYD GROUP SERVICES INC - Investor Presentation January 2022
Large, Fragmented Market
   U.S. Collision Repair Market

      •      Revenue for North American collision repair industry is estimated to be
             approximately US$36.9 billion annually (U.S. $34.6B, CDA $2.3B)
      •      31,400 shops in the U.S., 4,320 shops in Canada
      •      Composition of the collision repair market in the U.S.:

                                                                      Dealer-
                                                                      owned
                                                                      Shops
                                 Large MSO                            17.7%
                                   31.2%

                 Single Shops
                    57.0%
                                                               Independent
                                                               Repair Shops
                                                                  82.3%
                                             Small MSO
                                                and
                                             Franchises
                                               11.8%
Source: The Romans Group, 2020

                                                          10                           10
Evolving Collision Repair Market

     • Large multi shop collision repair operator (“MSO”) market share
         opportunity
             ▪ The top 3 consolidators represent an 18.2% share of collision repair
               revenue in 2020 as compared to 18.8% in 2019 and only 1.7% in 2006.
             ▪ 90 MSOs had revenues of $20 million or greater in 2020
             ▪ The top 3 consolidators together represent 42.2% of revenue of large
               MSOs
             ▪ MSOs benefit from standardized processes, integration of technology
               platforms and expense reduction through large scale supply chain
               management

Source: The Romans Group, 2020

                                                                                      11
Strong Relationships with
Insurance Companies through DRPs

 •   Direct Repair Programs (“DRPs”) are established between insurance
     companies and collision repair shops to better manage auto repair claims
     and the level of customer satisfaction

 •   Auto insurers utilize DRPs for a growing percentage of collision repair
     claims volume

 •   Growing preference among insurers for DRP arrangements with multi-
     location collision repair operators

 •   Boyd is well positioned to take advantage of these DRP trends with all
     major insurers and most regional insurers

 •   Boyd’s relationship with insurance customers
        ▪   Top 5 largest customers contributed 46% of revenue in 2020
        ▪   Largest customer contributed 13% of revenue in 2020

                                                                               12
Insurer Market Dynamics

            Top 10 Insurer Market Share (U.S.)    Insurer DRP Usage

                      Other
                    Insurers
                     26.5%                       Other
                                                 38.0%

                                                                DRP
                                  Top 10                       62.0%
                                 Insurers
                                  73.5%

Source: The Romans Group, 2020

                                                                       13
Impact of Collision Avoidance Systems

      •     CCC estimates technology will
                                                                                                                                                    *

            reduce accident frequency by
            ~30% in next 25-30 years

      •     As per industry studies, decline
            should be somewhat offset by
            increases in average cost of repair
            (increased expense of technology)
            and vehicle miles driven

      •     Large operators could also mitigate
            market decline by continued
            market share gains in consolidating
            industry

                                                                                                All Rights Reserved Copyright 2020 CCC Information Services Inc.
Source: CCC Information Services Inc. Crash Course 2020. Updated projection expands the ADAS technology to include systems like lane
departure warning, adaptive headlights, and blind spot monitoring, uses IIHS/HLDI’s predictions in regard to the ramp-up in percent of registered
vehicle fleet equipped with each system, and includes projections of the number of vehicles in operation in the U.S. Projections based on current
projected annual rate of change - impact may increase with changes in market adoption and system improvements

                                                                                                                                                            14
Business Strategy

                                       Expense management
              Operational
              excellence

              Enhance
   SHARE
             Shareholder
                            THE BOYD
  HOLDERS                    GROUP
                Value

                                        Same-store sales growth
      New location and                  and optimize returns from
      acquisition growth                existing operations

                                                            15
Operational Excellence
 •   Best-in-Class Service Provider
     ▪   Average cost of repair
     ▪   Cycle time
     ▪   Customer service
     ▪   Quality
     ▪   Integrity
 •   “WOW” Operating Way
     ▪   Embedded as part of our operating culture
 •   Company-wide diagnostic repair scanning
     and calibration technology
 •   I-Car Gold Class facilities
 •   Industry leader in OE Certifications
 •   Industry leader in technician training

                                                     16
Expense Management
                                                           Well managed operating expenses as a % of sales
                                                       Pre-IFRS 16                                              Post-IFRS 16
                                   40.0%                                                               35.0%
                                             37.1%      36.8%      36.5%     35.9%                             31.4%           32.0%
Operating Expenses as % of Sales

                                   35.0%
                                                                                                       30.0%

                                   30.0%
                                                                                                       25.0%
                                   25.0%
                                                                                                       20.0%
                                   20.0%

                                                                                                       15.0%
                                   15.0%

                                                                                                       10.0%
                                   10.0%

                                    5.0%                                                               5.0%

                                    0.0%                                                               0.0%
                                              2015       2016      2017       2018                             2019            2020

                                   *Results for 2020 were severely impacted by the COVID-19 Pandemic

                                                                                                                                       17
SSSG - Optimizing Returns from Existing Operations

                                                                                            Same-store sales increases in 31 of 40 most recent quarters
                            35%
                                                     10-year average SSSG: 4.5%*                                                                                   5-year average SSSG: 4.0%*
                            30%
                                                                                                                                                                                                                                         3-year average SSSG: 3.2%*
Same-Store Sales Growth**

                            25%

                            20%

                            15%

                            10%

                             5%

                             0%

                            -5%

                            -10%

                            -15%

                            -20%

                            -25%

                            -30%

                            -35%
                                     Q1-11

                                             Q2-11

                                                      Q3-11

                                                              Q4-11***

                                                                         Q1-12

                                                                                 Q2-12

                                                                                         Q3-12

                                                                                                 Q4-12

                                                                                                         Q1-13

                                                                                                                 Q2-13

                                                                                                                         Q3-13

                                                                                                                                 Q4-13

                                                                                                                                         Q1-14

                                                                                                                                                 Q2-14

                                                                                                                                                         Q3-14

                                                                                                                                                                 Q4-14

                                                                                                                                                                         Q1-15

                                                                                                                                                                                 Q2-15

                                                                                                                                                                                         Q3-15

                                                                                                                                                                                                 Q4-15

                                                                                                                                                                                                         Q1-16

                                                                                                                                                                                                                 Q2-16

                                                                                                                                                                                                                         Q3-16

                                                                                                                                                                                                                                 Q4-16

                                                                                                                                                                                                                                         Q1-17

                                                                                                                                                                                                                                                 Q2-17

                                                                                                                                                                                                                                                         Q3-17****

                                                                                                                                                                                                                                                                     Q4-17

                                                                                                                                                                                                                                                                             Q1-18

                                                                                                                                                                                                                                                                                     Q2-18

                                                                                                                                                                                                                                                                                             Q3-18*****

                                                                                                                                                                                                                                                                                                          Q4-18

                                                                                                                                                                                                                                                                                                                  Q1-19

                                                                                                                                                                                                                                                                                                                          Q2-19

                                                                                                                                                                                                                                                                                                                                  Q3-19

                                                                                                                                                                                                                                                                                                                                          Q4-19

                                                                                                                                                                                                                                                                                                                                                  Q1-20

                                                                                                                                                                                                                                                                                                                                                          Q2-20*

                                                                                                                                                                                                                                                                                                                                                                   Q3-20*

                                                                                                                                                                                                                                                                                                                                                                            Q4-20*

                                                                                                                                                                                                                                                                                                                                                                                     Q1-21*

                                                                                                                                                                                                                                                                                                                                                                                              Q2-21*

                                                                                                                                                                                                                                                                                                                                                                                                       Q3-21*
                                   * The results for Q2, Q3 and Q4 2020, as well as Q1 2021 were significantly impacted by the COVID-19 pandemic. Due to the nature and significant impact
                                   of COVID-19 on the results, SSSG for Q2, Q3 and Q4 2020, as well as Q1, Q2, and Q3 2021 have been excluded from the 3-year, 5-year and 10-year
                                   SSSG calculations.
                                   ** Total Company, excluding FX.
                                   *** Adjusting for the positive impact of hail in Q4-11, SSSG was 4.7%
                                   **** Adjusting for the negative impact of Hurricane Irma and Hurricane Harvey, Q3-17 SSSG was 1.0%
                                   ***** Normalizing for the impact of hurricanes in the comparative period, Q3-18 SSSG was 3.6%

                                                                                                                                                                                                                                                                                                                                                                                              18
Focus on Accretive Growth

• Goal: double the size of the business during the five-year period from 2021
  to 2025, based on 2019 revenues, on a constant currency basis

• Implied compound average annual growth rate of 15%:
    •   Same-store sales
    •   Acquisition or development of single locations
    •   Acquisition of multiple-location businesses

• Well positioned to take advantage of large acquisitions

                                                                            19
Strong Growth in Collision Locations

  140                                                                                                          900

                                                                                                         841
                                                                                                               800
  120

                                                                                                               700
  100
                                                                                                               600

   80                                                                                                          500

   60
                                                                                                      127      400

                                                               105                      108
                                                                                                               300
   40                                                                     81
                        64                       58                                                            200
                                                                                               54
   20       42
                                     29                                                                        100

    0                                                                                                          0
          2013         2014         2015        2016          2017       2018           2019   2020   2021
                                                 Annual additions     Total Locations

  *Results for 2020 were severely impacted by the COVID-19 Pandemic

                                                                                                                   20
Financial Review

                   21
Revenue Growth
 (C$ millions)

   $2,500
                                                                            $2,283.3
                                                                                       $2,089.1
   $2,000                                                        $1,864.6

                                          $1,569.4
   $1,500          $1,387.1

   $1,000

     $500

       $0
                     2016                  2017                   2018       2019       2020

  *Results for 2020 were severely impacted by the COVID-19 Pandemic

                                                                                                  22
Pre-IFRS 16 - Adjusted EBITDA Growth

 (C$ millions)

   $300

   $250
                                                                                               $215.6
   $200
                                                                                      $173.4
                                                                  $145.6
   $150
                                           $124.3
                   $101.7
   $100

     $50

      $0
                    2015                    2016                   2017               2018     2019

*Adjusted EBITDA for 2019 is shown on a Pre-IFRS 16 basis for comparative purposes.

                                                                                                        23
Post-IFRS 16 - Adjusted EBITDA

 (C$ millions)

 1-YR Decline of 8.23%

                                           $319.9
                                                                       $293.6
  $300

  $250

  $200

  $150

  $100

   $50

     $0
                                            2019                       2020
  *IFRS 16 was adopted effective January 1, 2019
  **Results for 2020 were severely impacted by the COVID-19 Pandemic

                                                                                24
Q3 2021 Financial Summary

                                                                                                      3-months ended                                    9-months ended
    (US$ millions, except per share and percent amounts)
                                                                                                   Sept 30,                 Sept 30,                 Sept 30,                 Sept 30,
                                                                                                    2021                     2020                     2021                     2020

  Sales                                                                                              $490.2                   $381.7                 $1,356.5                 $1,157.5

  Gross Profit                                                                                       $215.7                   $180.3                   $614.8                   $533.9

  Adjusted EBITDA*                                                                                     $51.5                    $63.5                  $162.2                   $159.6

  Adjusted EBITDA Margin*                                                                             10.5%                    16.6%                    12.0%                   13.8%

  Adjusted Net Earnings*                                                                                $2.4                    $16.4                   $22.1                    $26.8

  Adjusted Net Earnings* per share                                                                     $0.11                    $0.76                   $1.03                    $1.28

*Adjusted EBITDA and adjusted net earnings are not recognized measures under International Financial Reporting Standards ("IFRS"). Adjusted EBITDA has been presented above on a post-IFRS 16 basis.
See BGSI’s Q3 2021 MD&A for more information.

                                                                                                                                                                                         25
Canadian Emergency Wage Subsidy ("CEWS")

•   CEWS was put into place on April 11, 2020 and remained in place until
    October 23, 2021
•   The amount of the CEWS has decreased as the program phases out
•   As is the objective of the program, Boyd has been able to retain more of its
    employees than would have been possible, absent the subsidy
•   Adjusted EBITDA for the three months ended September 30, 2021 benefited
    from the CEWS in the amount of approximately $0.5 million USD, as
    compared to $7.5 million USD in the same period of the prior year

                                                                             26
Strong Balance Sheet

                 (in US$ millions)                Sept 30, 2021   Dec 31, 2020

Cash                                                  $31.2          $61.0

Long-Term Debt                                       $385.1          $180.2

Net Debt before lease liabilities
(total debt, including current portion and bank      $353.9          $119.2
indebtedness, net of cash)

Lease liabilities                                    $543.0          $419.3

Total debt, net of cash                              $896.9          $538.5

Net Debt before lease liabilities /
Adjusted EBITDA                                       2.8x            0.9x
(adjusted for property lease payments)

                                                                              27
Financial Flexibility

 •   Cash of US$31.2 million

 •   Net Debt to EBITDA TTM ratio of 2.8x

 •   Over US$500 million in cash and available credit

 •   Only public company in the industry: access to all capital markets

                                                                          28
Dividends

                    Annualized dividends have increased by 9.1% since 2017

    Annualized Dividend per Share (C$)
$0.60
                                                                                     0.576
                                                                  0.564
                                                0.552
$0.55                          0.54
            0.528

$0.50

$0.45

$0.40
        Nov 17 - Oct 18   Nov 18 - Oct 19   Nov 19 - Oct 20   Nov 20 - Oct 21   Nov 21 - Present

                                                                                             29
Five-year Return to Shareholders

                                     Boyd Group                        S&P/TSX Composite

  250%
              5-year
              total return:
  200%
              138.07%*
  150%

  100%                                                                                                 S&P/TSX
                                                                                                       Composite
                                                                                                       39.29%
  50%

   0%

  -50%
    31-Dec-16               31-Dec-17               31-Dec-18              31-Dec-19       31-Dec-20         31-Dec-21

    *Source: Irwin. Total return based on reinvestment of dividends.

                                                                                                                         30
Delivering long-term value to shareholders

    •     Best or second best 10-year performance on the TSX for 6 consecutive years
             •      Best 10-year performance on the TSX in 2015 and 2016
             •      Second best 10-year performance on the TSX in 2017, 2018, 2019 and 2020

         +9966.5%
                                                               10-year Total Return

                                    +5795.6%                   +5901.2%

                                                                                        +4236.0%
                                                                                                         +3786.0%
                                                                                                                          +3026.9%

                                                                                  +118.0%          +163.2%
+30.0%                     +58.6%                     +57.5%                                                        +105.8%

 2006 - 2016                  2007-2017                  2008-2018                  2009-2019        2010-2020        2011-2021

                                                           S&P/TSX Composite Index          Boyd
               *Source: Irwin. Total return based on reinvestment of dividends.

                                                                                                                          31
Experienced & Committed Management Team

       Timothy O’Day       Narenda “Pat” Pathipati
         President & CEO    Executive Vice-President & CFO

                                                             32
Outlook
• Boyd has taken specific actions to enhance the sales and margin opportunities, including:
      •   Investing in and growing our Technician Development Program
      •   Increasing recruitment support staff to improve lead generation and follow-up
      •   Proactively evaluating compensation levels and making appropriate adjustments to ensure we
          remain competitive in the rapidly changing environment
      •   Driving high levels of execution for on-boarding and orientation programs to increase retention
      •   Implementing the WOW Operating Way Human Resources systems and leveraging this process
      •   Having constructive discussions with large key clients about the urgent need for price increases to
          reflect the current environment
      •   Prioritizing production towards higher margin business
      •   Suspending business relationships with a few lower margin clients that are not willing to increase
          pricing, in order to better serve core clients and accelerate margin recovery efforts
• Boyd believes the part availability and margin challenges related to supply chain disruption
    is transitory and will normalize as manufacturing and distribution issues are resolved
•   Boyd expects revenue throughput, gross margins, and Adjusted EBITDA margins to
    recover in the coming quarters; however, the actions noted are unlikely to have a material
    impact on the fourth quarter

                                                                                                      33
Summary

                            ✓ Strong balance sheet
     Stability              ✓ Insurer preference for MSOs
                            ✓ Recession Resilient

        +
                            ✓ US$36.9 billion fragmented industry
                            ✓ High ROIC growth strategy
      Growth                ✓ Market leader/consolidator
                              in North America
        =
                            ✓ Cash dividends/conservative payout ratio
 Shareholder Value
                            ✓5-year total shareholder return of 138.07%

                 Focus on enhancing
                 shareholders’ value
                                                                    34
You can also read