RBC Capital Markets Financial Institutions Conference 2021 - Terry Dolan Vice Chair and Chief Financial Officer
←
→
Page content transcription
If your browser does not render page correctly, please read the page content below

RBC Capital Markets
Financial Institutions Conference
2021

Terry Dolan
Vice Chair and Chief Financial Officer

Jeff von Gillern
Vice Chair, Technology and Operations Services

March 10, 2021

                                                 U.S. BANCORP
Forward-looking statements and additional information

        The following information appears in accordance with the Private Securities Litigation Reform Act of 1995:
        Today’s presentation contains forward-looking statements about U.S. Bancorp. Statements that are not historical or current facts, including
        statements about beliefs and expectations, are forward-looking statements and are based on the information available to, and assumptions and
        estimates made by, management as of the date hereof. These forward-looking statements cover, among other things, anticipated future revenue
        and expenses and the future plans and prospects of U.S. Bancorp. Forward-looking statements involve inherent risks and uncertainties, and
        important factors could cause actual results to differ materially from those anticipated. The COVID-19 pandemic is adversely affecting
        U.S. Bancorp, its customers, counterparties, employees, and third-party service providers, and the ultimate extent of the impacts on its business,
        financial position, results of operations, liquidity, and prospects is uncertain. Continued deterioration in general business and economic conditions
        or turbulence in domestic or global financial markets could adversely affect U.S. Bancorp’s revenues and the values of its assets and liabilities,
        reduce the availability of funding to certain financial institutions, lead to a tightening of credit, and increase stock price volatility. In addition,
        changes to statutes, regulations, or regulatory policies or practices could affect U.S. Bancorp in substantial and unpredictable ways.
        U.S. Bancorp’s results could also be adversely affected by changes in interest rates; further increases in unemployment rates; deterioration in the
        credit quality of its loan portfolios or in the value of the collateral securing those loans; deterioration in the value of its investment securities; legal
        and regulatory developments; litigation; increased competition from both banks and non-banks; civil unrest; changes in customer behavior and
        preferences; breaches in data security; failures to safeguard personal information; effects of mergers and acquisitions and related integration;
        effects of critical accounting policies and judgments; and management’s ability to effectively manage credit risk, market risk, operational risk,
        compliance risk, strategic risk, interest rate risk, liquidity risk and reputation risk.
        For discussion of these and other risks that may cause actual results to differ from expectations, refer to U.S. Bancorp’s Annual Report on
        Form 10-K for the year ended December 31, 2020, on file with the Securities and Exchange Commission, including the sections entitled “Risk
        Factors” and “Corporate Risk Profile” contained in Exhibit 13, and all subsequent filings with the Securities and Exchange Commission under
        Sections 13(a), 13(c), 14 or 15(d) of the Securities Exchange Act of 1934. In addition, factors other than these risks also could adversely affect
        U.S. Bancorp’s results, and the reader should not consider these risks to be a complete set of all potential risks or uncertainties. Forward-looking
        statements speak only as of the date hereof, and U.S. Bancorp undertakes no obligation to update them in light of new information or future
        events.
        This presentation includes non-GAAP financial measures to describe U.S. Bancorp’s performance. The calculations of these measures are
        provided in the Appendix. These disclosures should not be viewed as a substitute for operating results determined in accordance with GAAP, nor
        are they necessarily comparable to non-GAAP performance measures that may be presented by other companies.

                                                                                                                                                                       U.S. BANCORP | 2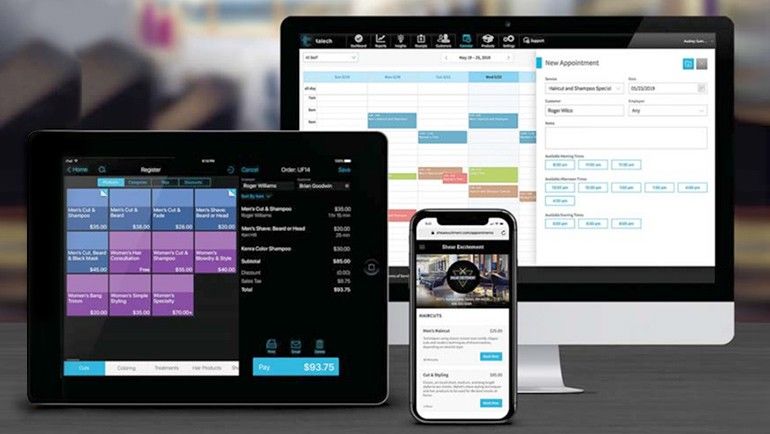
U.S. Bancorp

                    NYSE Traded                    USB     Branches              2,434       Assets               $554B
                    Founded                        1863    ATMs                  4,232       Deposits             $430B
                    Market Value                   $79B                                      Loans                $298B

                    Regional                              National                         International
                    Consumer & Business Banking           Corporate & Commercial Banking   Payment Services and
                    and Wealth Management                 and Wealth Management &          Investment Services
                                                          Investment Services

As of 12/31/20, except market value as of 3/5/21
                                                                                                                          U.S. BANCORP | 3
Our position in the industry

           Assets                                                 Deposits                           Market Value
         1          J.P. Morgan                        $3,386     1    J.P. Morgan          $2,144   1    J.P. Morgan          $461
         2          Bank of America                      2,820    2    Bank of America       1,795   2    Bank of America       319
         3          Citigroup                            2,260    3    Wells Fargo           1,404   3    Wells Fargo           155
         4          Wells Fargo                          1,955    4    Citigroup             1,281   4    Citigroup             147
         5          U.S. Bancorp                            554   5    U.S. Bancorp           430    5    U.S. Bancorp           79
         6          Truist Financial                        509   6    Truist Financial       381    6    Truist Financial       79
         7          PNC                                     467   7    PNC                    365    7    PNC                    75
         8          Fifth Third                             205   8    Fifth Third            159    8    Fifth Third            26
         9          Citizens Financial                      183   9    Citizens Financial     147    9    KeyCorp                20
         10         KeyCorp                                 170   10   KeyCorp                135    10   Citizens Financial     19

 Source: company reports and Bloomberg
 Assets and deposits as of 12/31/20; market value as of 3/5/21                                                                   U.S. BANCORP | 4
Our differentiated business mix supports consistent growth
Consumer & Payment
Business Banking Services
43% 25%
Corporate & Wealth Management
Commercial Banking & Investment Services
19% 13%
Consumer & Business Banking Corporate & Commercial Banking Payment Services Wealth Management & Investment Services
Branch banking, small business banking, Corporate Banking, Commercial Banking and Retail Payment Solutions, Wealth Management, Asset Management,
consumer lending, mortgage banking and Commercial Real Estate Global Merchant Acquiring and Corporate Trust, Fund Services and Custody
omnichannel delivery Corporate Payment Systems
Full Year 2020 taxable-equivalent basis
Business line revenue percentages exclude Treasury and Corporate Support; see slide 16 for reconciliation U.S. BANCORP | 5Long history of industry-leading returns…
Return on Average Common Equity Return on Average Common Equity Return on Average Common Equity
(5-Year Average)* (10-Year Average)* (15-Year Average)*
14.9%
14.3%
13.3%
12.0% 11.8%
11.4% 11.5% 11.5%
11.2% 11.1% 10.9%
10.7%
10.3%
9.3% 9.1% 9.2%
9.0% 9.0% 8.9%
8.5% 8.4% 8.1%
7.1%
6.6%
5.6% 5.4% 5.4%
3.3%
2.5% 2.5%
USB Peer 1 Peer 2 Peer 3 Peer 4 Peer 5 Peer 6 Peer 7 Peer 8 Peer 9 USB Peer 1 Peer 2 Peer 3 Peer 4 Peer 5 Peer 6 Peer 7 Peer 8 Peer 9 USB Peer 1 Peer 2 Peer 3 Peer 4 Peer 5 Peer 6 Peer 7 Peer 8 Peer 9
Source: S&P Global Market Intelligence; Peer banks include: BAC, CFG, FITB, JPM, KEY, PNC, RF, TFC and WFC
* 5-Year average ranges from 2016-2020, 10-Year average ranges from 2011-2020, 15-Year average ranges from 2006-2020
U.S. BANCORP | 6… driven by superior PPNR* and credit quality performance
Pre-Provision Net Revenue* Pre-Provision Net Revenue* Pre-Provision Net Revenue*
/ Avg Assets / Avg Assets 2.7%
/ Avg Assets
(5-Year Average)** (10-Year Average)** (15-Year Average)**
2.4% 2.3%
2.1% 2.2%
2.0% 2.1%
1.9% 1.9% 1.9% 1.9% 1.9%
1.8% 1.7%
1.7% 1.7% 1.6% 1.7%
1.6% 1.6% 1.5% 1.6%
1.4% 1.4% 1.4% 1.4%
1.3%
1.1%
1.0% 1.0%
USB Peer 1 Peer 2 Peer 3 Peer 4 Peer 5 Peer 6 Peer 7 Peer 8 Peer 9 USB Peer 1 Peer 2 Peer 3 Peer 4 Peer 5 Peer 6 Peer 7 Peer 8 Peer 9 USB Peer 1 Peer 2 Peer 3 Peer 4 Peer 5 Peer 6 Peer 7 Peer 8 Peer 9
Net Charge-off Rates
3.0%
• Our NCO ratios tend to run higher than peer
average in periods of economic strength due
2.5% to our higher-than-average mix of credit card
loans
2.0%
• During periods of stress, our disciplined
NCO Rate
1.5%
underwriting is validated by lower NCO ratios
1.0%
vs peers
0.5%
0.0%
2005 2006 2007 2008 2009 2010 2011 2012 2013 2014 2015 2016 2017 2018 2019 2020
Recession Indicator NCO Rate for USB NCO Rate for Peers
Source: S&P Global Market Intelligence; Peer banks include: BAC, CFG, FITB, JPM, KEY, PNC, RF, TFC and WFC
* PPNR defined by S&P Global Market Intelligence as: Net interest income, on a fully tax-equivalent basis, plus fees and other noninterest income minus non-credit-related expenses. Nonrecurring
revenue and nonrecurring expense and securities gains and losses are excluded. U.S. BANCORP | 7
** 5-Year average ranges from 2016-2020, 10-Year average ranges from 2011-2020, 15-Year average ranges from 2006-2020Investing for the future
Innovation
is providing opportunities for
We are investing in
people and technology
with the goal of improving Optimization
growth and efficiency
and driving
Superior Returns
U.S. BANCORP | 8Modernization at U.S. Bank has accelerated
As the world has been rapidly transforming, we have been Our investments have proven to be dependable
investing for the future
• COVID-19 has accelerated the shift to digital banking
External Factors
• This shift has allowed us to capitalize on efficiencies which have led to increased returns
FinTech
Competition
Data Increased Need
• Our technology strategy, paired with our current capabilities, will allow us to grow our
Security for Flexibility
digital banking even further
Operational COVID-19
Efficiency
Digital Active Customers Transactions Loan Sales
Increased (% of Total Active Customers)* (% of Total) (% of Total)
Innovation
Digitization USB 78%
77% 80% 80%
80% 70%
66%
58% 58%
Emerging Competition for 60% 52% 60% 60%
Technologies Top-talent
40% 40% 40% 33% 34%
Changing Customer Artificial 20% 20% 20%
Expectations Intelligence
Accelerated Digital 0% 0% 0%
Usage Mobile Online Total 12/31/18 12/31/19 12/31/20 12/31/18 12/31/19 12/31/20
Digital
Total Digital Total Digital
Data as of 12/31/20
*Represents core Consumer Banking customers active in at least one channel in the previous 90 days
Total Digital includes both online and mobile platforms U.S. BANCORP | 9Technology will continue to power us forward
Our current technology spend of $2.5 billion includes both offensive and defensive investments
Current Capabilities Technology Modernization Strategy
Best In Class Application
Mobile App rated 5 out of 5 stars by more than 1 million users
#1 Named Best in Industry #1
Digital Mortgage Tools
Mobile Check Deposit Customer Service Features Engineering
Cornerstone Advisors Kiplinger Business Insider Intelligence Cloud Single Source of
Engrain Security Culture & Up-
Acceleration Data
skilling
Ample DIY & DIT services
Smart Assistant has answered more than 1 million questions Modernize our Create a unified Place security Streamline how
DIY since launched in summer 2020 technology stack to data platform & within the we work to
enable flexibility and APIs for scalability technology fabric improve time to
#1 agility and analytics of everything we market and cost
Overall Superregional Bank do
DIT 11th consecutive year in Fortune magazine
Current Cloud Infrastructure
Business Targets:
Migrating applications into the public cloud
~20% lower incremental costs for new features
60% of digital consumer touchpoints serviced by the cloud
Full Technology Consolidation of Acquisitions
Mainframe usage reduced by 20%
All acquisitions are brought to our technology platform
U.S. BANCORP | 10Creating a “reusable” tech stack will enhance modernization
A New Tech Stack… …Will Impact All Business Lines
Consumer & Business Banking
Legacy tech stack Targeted tech stack
• Significantly improve reliability and performance for branch and call center systems
• Reduce fixed costs per customer account
Use case specific software
• Simplify customer touchpoints
Re-usable modular shared services
Unified Data platform Corporate & Commercial Banking
Cloud DevSecOps Foundation
• Accelerate trading platform capabilities for capital markets
• Simplify vendor integration complexity, costs, and risks
Streamlined Core Systems
Monolithic Core Systems
Wealth Management & Investor Services
• “Crush the paper” faster
• Quicker and cheaper testing of acquisition strategies
Create a unified data platform and APIs, for scalability and analytics
Modernize our technology stack to enable flexibility and agility Payments
• Reduce data warehouse infrastructure and costs
Enhance how we work, to improve time to market and cost
• Improve time to market for new capabilities
Simplify our systems in a secure and reliable infrastructure • Assist in bridging the gap of business banking and payment capabilities
U.S. BANCORP | 11Bridging the gap between banking and payments services
• Leveraging data to drive One U.S. Bank, removing
Deposits Card issuing complexity, creating value and differentiation
Lending
Merchant • Creating an easy and frictionless experience for
processing customers
Capital solutions U.S. Bank
Payments Omni-commerce • Investing in the digital evolution in payments
Ecosystem capabilities
Cash management
• Over the last few years, we’ve focused our investment
AR and AP on the tech-led segment within merchant services. Tech-
Investment services
solutions
led includes digital, omni-commerce and e-commerce as
well as investments in integrated software providers
Banking services Payments services
• These investments are paying off as “tech-led” is our
Data fastest growing segment
Technology
• As the lines between traditional Payments
banking and payments
services
capabilities blur, the opportunity is here for us to provide Over 100% growth in new
integrated banking and payments solutions through a tech-led partnerships*
complete payments ecosystem
* Increase in new tech-led partnerships ranges from 12/31/2018-12/31/2020
U.S. BANCORP | 12Modernization use case: talech
Helping us lead the banking and fintech evolution
The Right Fit for Small Businesses Bridging the Banking & Payments Gap
Restaurants
A new integrated dashboard, to be
talech provides cloud-based software • Menu and order management completed in 2021, will help small
that allows businesses to manage multiple • Table and position management businesses manage both their payment
operational tasks in a single POS and business banking activities in one
solution • Split checks place
Retail
When acquired in 2019, talech serviced • Inventory management The dashboard will enable customers to
$2.3 billion in processing volume spend more time on growing their
• Employee management business
• Customer management tools
Services
Over $18 trillion of consumer payments
are still done through traditional • Appointment scheduling We expect to see an increase in both
methods, and only 14% of global retail digitally acquired customers and in
• Billing
spend is done digitally* digital product usage by current banking
• Online payment portal customers
* Per Visa’s 2020 investor day; global retail spend excludes travel and event ticket sales.
U.S. BANCORP | 131Q21 guidance update
• Net interest income
• Noninterest income
• Expenses
• Credit quality
• Tax rate
U.S. BANCORP | 14Appendix
U.S. BANCORP | 15Non-GAAP financial measures
($ in millions) Net Revenue
Line of Business Financial Performance FY20
Corporate and Commercial Banking $ 4,337
Consumer and Business Banking 9,623
Wealth Management and Investment Services 2,873
Payment Services 5,654
Treasury and Corporate Support 838
Total Company 23,325
Less Treasury and Corporate Support 838
Total Company excl. Treasury and Corporate Support $ 22,487
Percent of Total Company
Corporate and Commercial Banking 19%
Consumer and Business Banking 41%
Wealth Management and Investment Services 12%
Payment Services 24%
Treasury and Corporate Support 4%
Total 100%
Percent of Total Company excl. Treasury and Corporate Support
Corporate and Commercial Banking 19%
Consumer and Business Banking 43%
Wealth Management and Investment Services 13%
Payment Services 25%
Total Company excl. Treasury and Corporate Support 100%
U.S. BANCORP | 16You can also read