BUILDING A GLOBAL CPG COMPANY - TSX: CWEB | OTCQX: CWBHF - Amazon AWS
←
→
Page content transcription
If your browser does not render page correctly, please read the page content below

BUILDING A GLOBAL CPG COMPANY

       TSX: CWEB | OTCQX: CWBHF   October 2019
DISCLAIMERS
    Forward-Looking Information
    Certain statements contained in this presentation constitute forward-looking statements and forward-looking information (collectively, “forward-looking statements”). Such forward-looking statements relate to possible
    events, conditions or financial performance of Charlotte’s Web Holdings, Inc. (the “Company”) based on future economic conditions and courses of action. All statements other than statements of historical fact are
    forward-looking statements. The use of any words or phrases such as “seek”, “anticipate”, “plan”, “continue”, “estimate”, “expect”, “may”, “will”, “project”, “predict”, “potential”, “targeting”, “intend”, “could”, “might”,
    “should”, “believe”, “will likely result”, “are expected to”, “will continue”, “is anticipated”, “believes”, “estimated”, “intends”, “plans”, “projection”, “outlook” and similar expressions are intended to identify forward-
    looking statements. These statements involve known and unknown risks, assumptions, uncertainties and other factors that may cause actual results or events to differ materially from those anticipated in such forward-
    looking statements. The Company believes there is a reasonable basis for the expectations reflected in the forward-looking statements, however no assurance can be given that these expectations will prove to be
    correct and the forward-looking statements included in this presentation should not be unduly relied upon by investors. The forward-looking statements speak only as of the date of this presentation and are expressly
    qualified, in their entirety, by this cautionary statement.
    In addition, the Company’s assessment of, and targets for, sales of hemp-derived cannabidiol (“CBD”) products, expansion of retail locations through which the Company’s products may be sold, expansion of the
    Company’s distribution channels, including overseas distribution, development of improvements to the Company’s products and related bioavailability technology, the isolation of additional cannabinoid products,
    annual revenue, Adjusted EBITDA, and the Company’s outlook on expected regulatory developments regarding the 2018 Farm Bill , are considered forward-looking statements.
    The forward-looking statements and other forward-looking information are based on management’s opinions, estimates and assumptions in light of our experience and perception of historical trends, current trends,
    current conditions and expected future developments, as well as other factors that management currently believes appropriate and reasonable in the circumstances. Despite a careful process to prepare and review the
    forward-looking statements, there can be no assurance that the underlying opinions, estimates, and assumptions will prove to be correct. For further details on the forward-looking statements included in this
    presentation, see the Company’s public filings available on SEDAR at www.sedar.com. All of the forward-looking statements and information contained in this presentation is expressly qualified by the foregoing
    cautionary statements. Investors should read the the Company’s public filings and consult their own professional advisors to ascertain and assess the income tax, legal, risk factors and other aspects of their investment
    in any securities of the Company.
    Non-IFRS Measures and Industry Metrics
    This presentation makes reference to certain non-IFRS measures including key performance indicators used by management. These measures are not recognized measures under IFRS and do not have a standardized
    meaning prescribed by IFRS and are therefore unlikely to be comparable to similar measures presented by other companies. Rather, these measures are provided as additional information to complement those IFRS
    measures by providing further understanding of our results of operations from management’s perspective. Accordingly, these measures should not be considered in isolation nor as a substitute for analysis of the
    Company’s financial information reported under IFRS. The Company uses non-IFRS measures including “EBITDA” and “Adjusted EBITDA” which may be calculated differently by other companies. These non-IFRS
    measures and metrics are used to provide investors with supplemental measures of the Company’s operating performance and liquidity and thus highlight trends in its business that may not otherwise be apparent
    when relying solely on IFRS measures. The Company also believes that securities analysts, investors and other interested parties frequently use non-IFRS measures in the evaluation of companies in similar industries.
    Management also uses non-IFRS measures and metrics, in order to facilitate operating performance comparisons from period to period, to prepare annual operating budgets and forecasts and to determine
    components of executive compensation. Prospective investors should review the section entitled “Management’s Discussion and Analysis” in the Company’s public filings for a discussion of the use of “EBITDA” and
    “Adjusted EBITDA” and reconciliations thereof to the most directly comparable IFRS measures.

    Third Party Information
    This presentation includes market and industry data which was obtained from various publicly available sources and other sources believed by the Company to be true. Although the Company believes it to be reliable,
    the Company has not independently verified any of the data from third-party sources referred to in this presentation or analyzed or verified the underlying reports relied upon or referred to by such sources, or
    ascertained the underlying assumptions relied upon by such sources. The Company does not make any representation as to the accuracy of such information.

2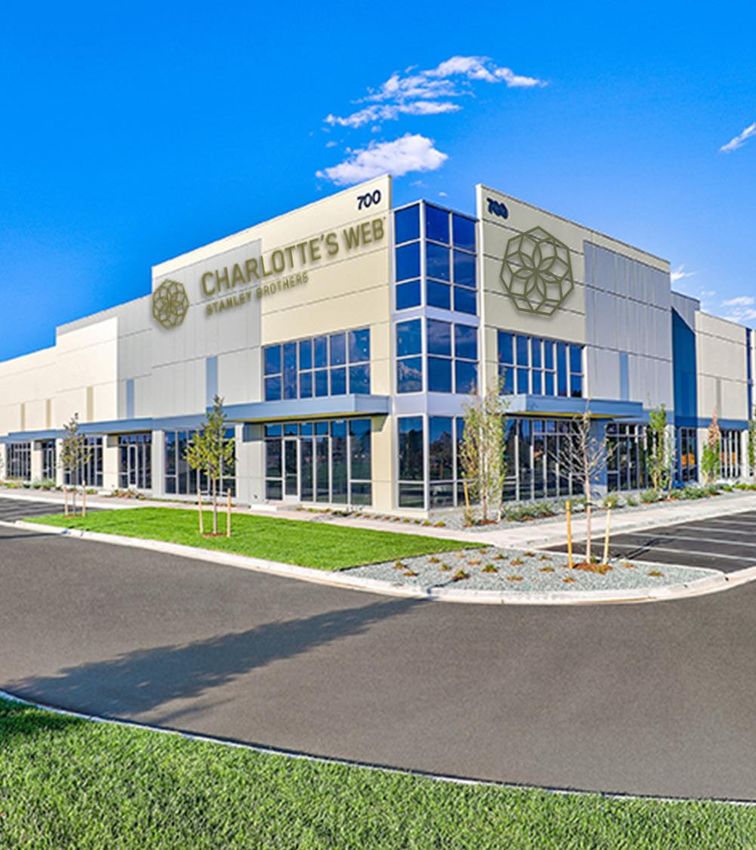
Founded in 2013
    The Stanley Brothers                                                                                 Boulder, Colorado

    CHARLOT TE’S WEB WAS NOT                             Our dedication to creating the best hemp extracts makes us an
    STARTED AS A COMPANY,                                industry leader for product quality, safety and consistency.
                                                         We believe our high-quality hemp extract harnesses powerful
    IT WAS STARTED AS A MISSION                          botanical benefits. We simply serve as nature’s stewards.
3     Charlotte’s Web, Inc. - Confidential Information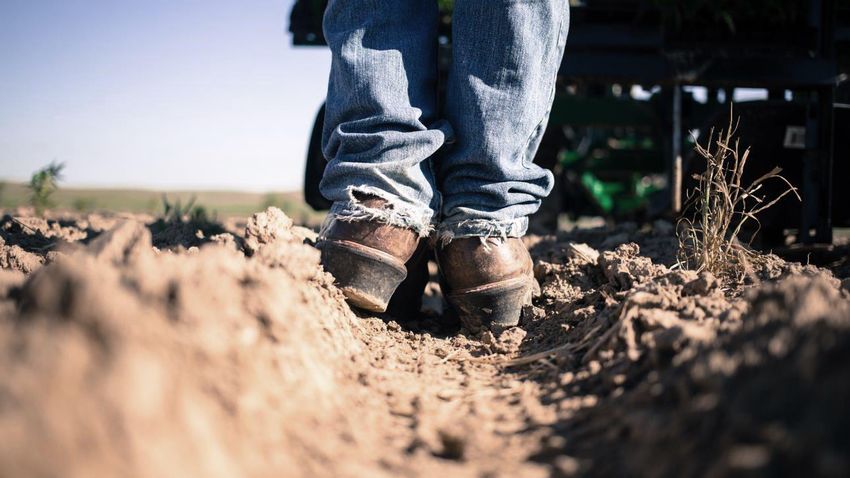
ST RO N G         PREMIER   S C A L I N G TO
    F U N DA M E N TA L S    BRAND    AC C E L E R AT E

4
#1 BRAND IN THE
    TOTAL HEMP - DERIVED                                    CHARLOTTE’S WEB
                     CBD MARKET                       1   ANNUAL REVENUE ($MM)
                                                                           69.5

    OUTPACING THE INDUSTRY WITH
      2018 REVENUE GROWTH OF

                                                                    40.0

                              74%   year-over-year2        14.7 3

                                                            2016    2017   2018

    (1) By market share Company estimates
5   (2) Represents 2018 growth over 2017
    (3) Charlotte’s Web Holdings Inc. revenue
VERTICALLY INTEGRATED SUPPLY CHAIN ADVANTAGE

    PROPRIETARY GENETICS

                            • Quality, consistency and trust
    LONG-TERM CULTIVATION
        PARTNERSHIPS
                            • Traceability of ingredient streams
     HARVEST & PROCESS
         BIOMASS            • Transparency of the manufacturing process

    IN-HOUSE EXTRACTION     • Grown in the U. S. A.

        PRODUCTION          • Production Cost Advantages

        WAREHOUSE
       & DISTRIBUTION
6
TESTED. CERTIFIED. RESEARCHED.

    All Products Tested up to 20 Times
    • Testing through entire cultivation, extraction and manufacturing to final packaged product
    • Includes 60-panel toxins test
    • Batch test results available for every item sold

    Safe. Certified. Trusted.
    • FDA approved cGMP certified facilities
    • Hemp Authority certified products

    Strategic R&D Partnerships
    • Johns Hopkins University
    • Harvard University

7
    7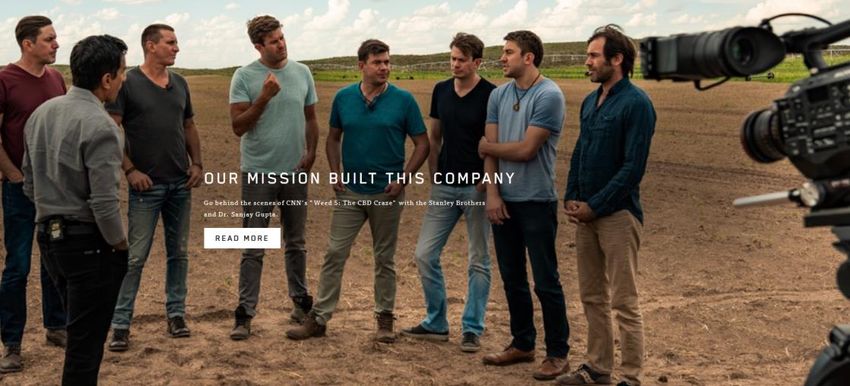
EXPANDED PRODUCT PORTFOLIO

12 Liquid Products               4 Capsule Products   4 Topical Products   12 Canine Products – 11 New!   3 Gummies – NEW!

       Note: Product offering as of August 1, 2019
8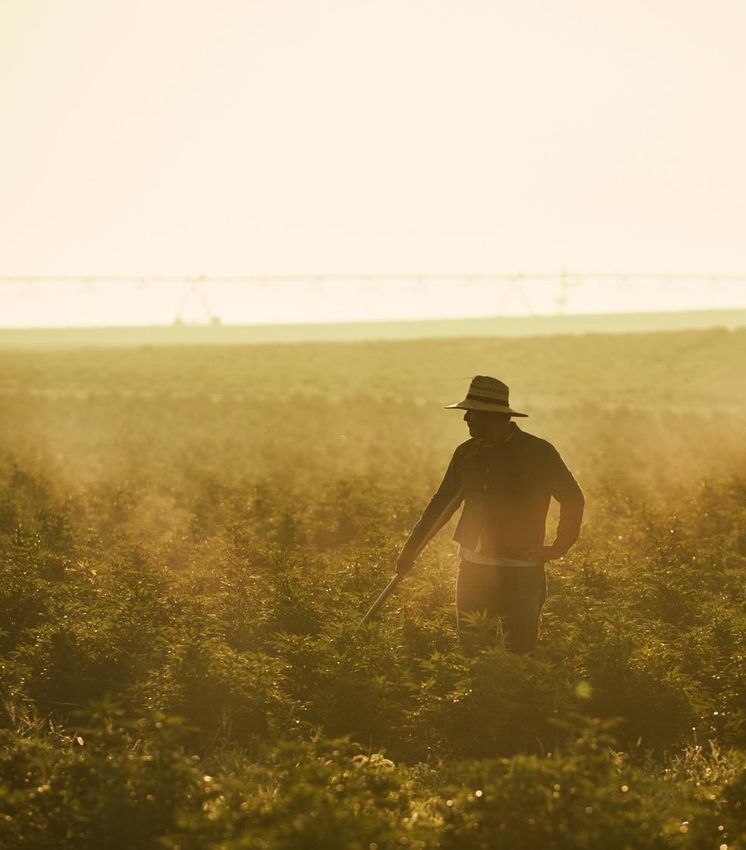
STRO NG FINANCIAL PERFO RMANCE

                   Revenue and Growth                                                Gross Profit and Margin                                        Adjusted EBITDA and Margin2

                                                      69.5                                               75%                 75%
                                                                                       65%                                                                                 35%    30%
                                                                                                                             52.3

                                                                                                                                                        14%                       21.1
                                                                                                         29.9
                                  40.0                                                                                                                                     14.1

             14.7 1                                                                   9.6
                                                                                                                                                        2.0
              2016                2017               2018                            2016                2017                2018                       2016               2017   2018

        All figures in USD $MM

9   (1) Charlotte’s Web Holdings Inc. revenue
    (2) Adjusted EBITDA is not a recognized measure under International Financial Reporting Standards ("IFRS"). See “Non-IFRS Measures and Industry Metrics” on slide 2.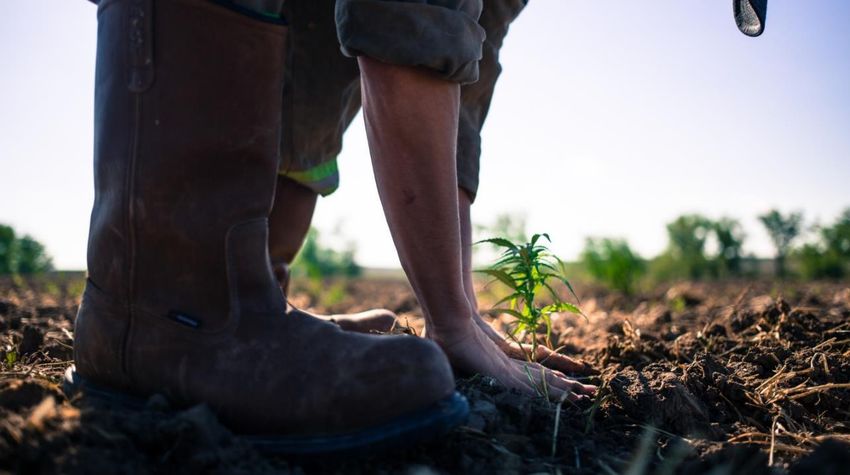
QUARTERLY PERFO RMANCE

                                                          30
                                                                            Revenue Growth ($MM)
                                                                                                25
 Q2 - 2019 Financial Highlights                           25

                                                                            21.7                                                 21.3

                                                          20
                                                                                                                   17.7
     ➢   $25M revenue: +45% vs Q2-2018; +15% vs Q1-2019                                  17.2

     ➢   75% gross margin                                 15
     ➢   16% adjusted EBITDA of $3.9 million                         13.1
                                                                                                                          12.5
                                                                                                            11.3
     ➢   47% revenue from e-commerce
                                                          10                       9.1
     ➢   53% revenue from retail outlets
                                                               7.1

• Uplisted to the Toronto Stock Exchange (TSX)            5

                                                          0
                                                                     Q1                  Q2                        Q3            Q4
                                                                                         2017        2018     2019
                                                          All revenue in USD $MM
10
CATEGO RY GROWTH - FDA and FDM are the Catalysts
US Hemp Market
$25b (2018 - 2022F)
Aggressive Scenario
$21.9b ► US Hemp market is estimated to be
$21.9b in 2022 from $0.6b in 2018
$20b ► Broad consumer acceptance across all segments
► FDA sets a regulatory environment for ingestibles
$17.0b
► FDM channel fully engages product lines
$15b
$11.2b
$10b
Conservative Scenario
► Total US Hemp market - $4.4b by2022
$5.7b ► Consumer limits adoption across some segments
$5b
$4.4b
► Assumes slow FDA regulatory provisions set
$2.8b
$0.6b $1.7b
$1.0b
$0b $0.0b
2018 2019F 2020F 2021F 2022F
HEMP CBD Gap: Household penetration vs. Interest
• 7% Household penetration
• 86% “Interested in learning more/trying CBD”
11 Source: Brightfield Group, Hemp Business JournalCO MPETITIVE EXPANSIO N
CBD Category – Competitive Landscape
2500 90%
81% 80%
2000
2000 70%
60% 60%
1500
50%
40%
1000
30% 30%
650
500 20%
200 10%
0 0%
2017 2018 2019
Brands Top 20
2017 2018 2019 Q1
200 Brands 650+ Brands 2000+ Brands
12
12 Source: Brightfield Group, Q1 2019CHANNEL GROWT H
US Hemp Market by Retail Format
(2018 - 2022F) CAGR
('18-'22)
100%
$0.6b $11.2b $21.9b 147%
82% Chained Retailers estimated to
90%
80%
70%
n/a
represent 64%
of Total Hemp
60%
Sales by 2022
50%
40%
30% 103%
6% %
20% 95%
10% To s u c c e e d g o i n g f o r w a r d ,
97%
0%
companies must shift to becoming a
2018 2020F 2022F Marketing /CPG Company
Others Dispensaries
Chained Retailers Online
Medical Companies Natural Food Stores
13 Source: Bright Hemp Industry Daily (U.S. Census Bureau, National Association of Convenience Stores, Pharmacy Time, Progressive Grocer)CATEGORY PIONEERS BUILDING A PREMIER BRAND
CNN WEED 5 Sept 29, 2019
Quality and safety are critical
during CBD craze
Our consumers trust the quality
C h a r l o t t e ’s We b h e m p - d e r i v e d C B D
14# 1 AWARENESS AND # 1 SATISFAC TIO N
AWARENESS
Charlotte’s Web is #1 in awareness
Charlotte’s Web is #1 in converting awareness to loyalty
SATISFACTION
Charlotte’s Web is #1 in satisfaction.
Charlotte’s Web is #1 in intent to repurchase.
Charlotte’s Web is #1 in willingness to recommend.
15
Source: Brightfield survey of 3500 people who have used CBD in the past year. Respondents rated brands they had purchased. Sept. 2019BUILDING A GLOBAL CPG COMPANY TO
ACCELERATE GROWTH
BUILD OUT OF CPG LEADERSHIP TEAM and top tier sales organization
DEVELOP OPERATIONAL EXCELLENCE and corporate governance
STRUCTURE DATA FOR INTELLIGENCE
LAUNCH AGILE MARKETING
EXPAND ACROSS CHANNELS
INTERNATIONAL EXPANSION
16Deanie Elsner Russ Hammer Stephen Lermer Tony True Eugenio Mendez
CEO CFO COO CCO CGO
BUILDING
THE CPG
LEAD ERSHIP
T EAM
Paul Lanham Jared Stanley Nathan Gerhardt Tamarah Saif Cory Pala
CIO CULTIVATION REGULATORY TALENT CAPITAL MARKETS
17OPERATIONAL EXCELLENCE
EXPAND CULTIVATION
Hemp Production (Lbs)
Cultivation Operations 2019
• Over 6 years of experience in hemp plant cultivation Harvest
Projection
• Company operated farms in Colorado and contract partner farms in
Kentucky and Oregon
• Participating in regenerative organic hemp farming research initiative
675,000
Strategic Partnerships
Rodale Institute and Natural Care
To pioneer regenerative farming practices in the Appalachian region
Center for Discovery 63,000
41,000
Extending a 3-year commitment to develop optimal hemp genetics in NY
2016 2017 2018 2019
Hemp Acres Planted 45 70 300 862
Hemp (Lbs)/Acre 911 900 2,250 (Q4-19)
18
18OPERATIONAL EXCELLENCE
EXPAND PRODUCTION & DISTRIBUTION
In-House Production
• New 137,000 sq ft cGMP grade manufacturing and R&D facility
in addition to current 40,000 ft2 facility
• Extraction, production, distribution and R&D expansion
• CPG level shipping and distribution
• Staged build-out - Online early 2020
Rigid Quality Management
• Leading CO2 and alcohol extraction extraction technologies
• Proprietary Extraction and Isolation Processes1
• Current Good Manufacturing Practices (cGMP) Certifications
(1) Patents applied
19
19STRUCTURE DATA FOR INTELLIGENCE
• Operational Efficiency
• Sales Effectiveness
• Personalized Marketing
• Business Analytics
• Rapid Test & Learn
20
20LAUNCH ING AG ILE M A R KET ING 21
Charlotte’s Web, Inc. - Confidential
Information
Charlotte’s Web, Inc. - Confidential
Information
EXPAND ACROSS CHANNELS

                                                                       CHARLOTTE’S WEB
                                                                    TOTAL RETAIL DOORS (EOY)
                                                             9000
                                                                                          8000+
                                                             8000

                                                             7000

                                                             6000

                                                             5000

                                                             4000

                                                             3000

                                                             2000

     • Mass retailers entering the category                  1000

     • Regulatory uncertainty causing tempered uptake          0
                                                                     2016   2017   2018   2019 YTD
     • Most national retailers taking topicals only
     • Positive FDA resolutions would be a demand catalyst
24
INTERNATIONAL EXPANSION
GLOBAL AMBITIONS FOR INTERNATIONAL LEADERSHIP
25TSX:CWEB | OTCQX:CWBHF
Charlotte’s Web Holdings, Inc.
1600 Pearl Street
Boulder, Colorado
USA
www.charlottesweb.com
Cory Pala
Director of Investor Relations
(720) 484-8930
26 IR@CharlottesWeb.comYou can also read