Building the Largest Digital Healthcare Marketplace - Building the Leading Digital Platform for Consumer Healthcare May 2021

Page created by Phillip Santiago
 
CONTINUE READING
Building the Largest Digital Healthcare Marketplace - Building the Leading Digital Platform for Consumer Healthcare May 2021
Building the Leading   Building the Largest
Digital Platform for   Digital Healthcare
Consumer Healthcare    Marketplace
May 2021               MARCH 2020
Building the Largest Digital Healthcare Marketplace - Building the Leading Digital Platform for Consumer Healthcare May 2021
Disclaimer
This presentation contains forward-looking statements within the meaning of the Private Securities Litigation Reform Act of 1995. All statements contained in this presentation that do not relate to matters of historical fact should be
considered forward-looking statements, including without limitation statements regarding our future operations and financial results, the underlying trends in our business, our market opportunity, competitiveness of our prices, our
potential for growth, demand for our offerings, our strategic growth priorities and future offerings and our strategy. These statements are neither promises nor guarantees, but involve known and unknown risks, uncertainties and other
important factors that may cause our actual results, performance or achievements to be materially different from any future results, performance or achievements expressed or implied by the forward-looking statements, including, but
not limited to, risks related to our limited operating history and early stage of growth; our ability to achieve broad market education and change consumer purchasing habits; our ability to continue to attract, acquire and retain
consumers in a cost-effective manner; our reliance on our prescription offering and ability to expand our offerings; changes in medication pricing and pricing structures; our inability to control the categories and types of prescriptions for
which we can offer savings or discounted prices; our reliance on a limited number of industry participants; the competitive nature of industry; risks related to pandemics, epidemics or outbreak of infection disease, including the COVID-
19 pandemic; the accuracy of our estimate of our total addressable market and other operational metrics; the development of the telehealth market; our ability to maintain and expand a network of skilled telehealth providers; risks
related to negative media coverage; our ability to respond to changes in the market for prescription pricing and to maintain and expand the use of GoodRx codes; our ability to maintain positive perception of our platform and brand;
risks related to our material weaknesses in our internal control over financial reporting and any future material weaknesses; risks related to use of social media, emails, text messages and other messaging channels as part of our
marketing strategy; our ability to accurately forecast revenue and appropriately plan our expenses in the future; risks related to information technology and cyber-security; compliance with government regulation of the internet, e-
commerce and data and other regulations; our ability to utilize our net operating loss carryforwards and certain other tax attributes; management’s ability to manage our transition to being a public company; our ability to attract,
develop, motivate and retain well-qualified employees; risks related to general economic factors, natural disasters or other unexpected events; risks related to our acquisition strategy; risks related to our debt arrangements;
interruptions or delays in service on our apps or websites; our reliance on third-party platforms to distribute our platform and offerings; our reliance on software as-a-service technologies from third parties; systems failures or other
disruptions in the operations of these parties on which we depend; changes in consumer sentiment or laws, rules or regulations regarding tracking technologies and other privacy matters; risks related to our intellectual property; risks
related to operating in the healthcare industry; risks related to our organizational structure; as well as the other important factors discussed in our Annual Report on Form 10-K for the year ended December 31, 2020, and our other
filings with the SEC. These factors could cause actual results to differ materially from those indicated by the forward-looking statements made in this presentation. Any such forward-looking statements represent management’s
estimates as of the date of this presentation. While we may elect to update such forward-looking statements at some point in the future, we disclaim any obligation to do so, even if subsequent events cause our views to change.

This presentation also contains estimates and other statistical data made by independent parties and by the Company relating to market size and growth and other data about the Company’s industry. This data involves a number of
assumptions and limitations, and you are cautioned not to give undue weight to such estimates. Neither the Company nor any other person makes any representation as to the accuracy or completeness of such data or undertakes any
obligation to update such data after the date of this presentation. In addition, projections, assumptions and estimates of our future performance and the future performance of the markets in which the Company operates are necessarily
subject to a high degree of uncertainty and risk.

In light of the foregoing, you are urged not to rely on any forward-looking statement or third-party data in reaching any conclusion or making any investment decision about any securities of the Company.

This presentation includes certain financial measures that are not presented in accordance with generally accepted accounting principles in the United States, ("GAAP"), such as Adjusted EBITDA and Adjusted EBITDA Margin, to
supplement financial information presented in accordance with GAAP. There are limitations to the use of non-GAAP financial measures and such non-GAAP financial measures should not be construed as alternatives to financial
measures determined in accordance with GAAP. The non-GAAP measures as defined by the Company may not be comparable to similar non-GAAP measures presented by other companies. The Company's presentation of such
measures, which may include adjustments to exclude unusual or non-recurring items, should not be construed as an inference that the Company's future results will be unaffected by other unusual or non-recurring items. A reconciliation
is provided elsewhere in this presentation for each non-GAAP financial measure to the most directly comparable financial measure stated in accordance with GAAP.

                                                                                                                                                                                                                                                    2
Building the Largest Digital Healthcare Marketplace - Building the Leading Digital Platform for Consumer Healthcare May 2021
Our management team is mission-driven and committed to improving
healthcare in America

                                                   Karsten Voermann   Andrew Slutsky     Justin Fengler                   Jim Sheninger
                                                   Chief Financial    President,         SVP, Corporate Strategy          SVP, Pharmacy Strategy
                                                   Officer            Consumer           & Business Operations            Officer

         Doug Hirsch
         Co-CEO

                                                   Bansi Nagji        Jody Mulkey        Babak Azad                       Gracye Cheng
                                                   President,         Chief Technology   Chief Marketing Officer,         Vice President &
                                                   Healthcare         Officer            SVP Marketing & Communications   General Counsel

         Trevor Bezdek
         Co-CEO
                  Biowire      Tryarc
                            acquired by NTT Data

                                                                                                                                             3
Building the Largest Digital Healthcare Marketplace - Building the Leading Digital Platform for Consumer Healthcare May 2021
Today’s large consumer spending markets are served by successful
           consumer-focused, tech-enabled solutions

                                           $0.8Tn                                                        $1.2Tn                                    $1.5Tn     $1.5Tn       $2.8Tn
                                     Restaurants1                                              Transportation2                                     Travel3   Education4   Real Estate5

1.     Statista: 2017 total US restaurants food and drink sales.
2.     Bureau of Transportation Statistics: 2016 expenditures on transportation.
3.     Statista: 2017 contribution of travel and tourism to GDP in the United States.
4.     Zion Market Research: 2020 projection.                                                                                                                                            4
5.     Euromonitor Report: 2019 annual spending on Real Estate in the United States.
Note: spend figures indicate total spend in these markets – not spend for the specific platforms shown or spend through online platforms at all.
Building the Largest Digital Healthcare Marketplace - Building the Leading Digital Platform for Consumer Healthcare May 2021
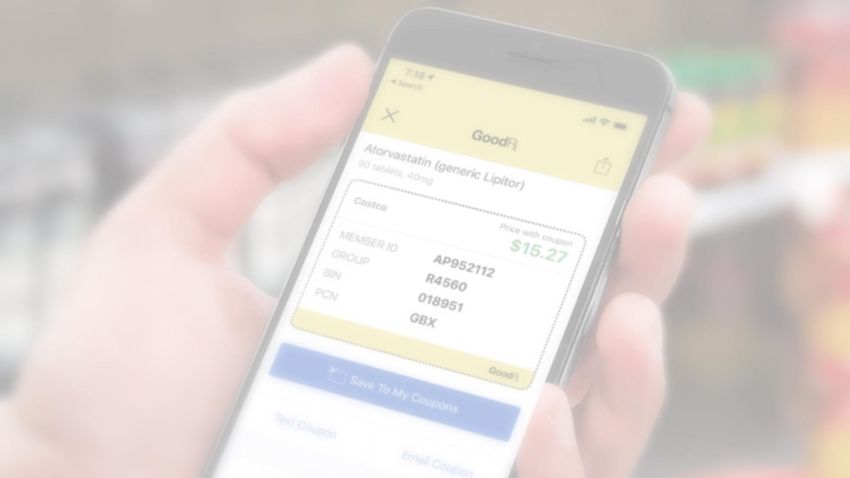
Healthcare spending is significantly higher than in other consumer markets

                            $0.8Tn                                      $1.2Tn        $1.5Tn      $1.5Tn        $2.8Tn         $4.0Tn
                   Restaurants1 Transportation2                                       Travel3   Education4   Real Estate5   Healthcare6

1.   Statista: 2017 total US restaurants food and drink sales.
2.   Bureau of Transportation Statistics: 2016 expenditures on transportation.
3.   Statista: 2017 contribution of travel and tourism to GDP in the United States.
4.   Zion Market Research: 2020 projection.                                                                                               5
5.   Euromonitor Report: 2019 annual spending on Real Estate in the United States.
6.   Centers for Medicare & Medicaid Services (CMS): 2020 projection.
Building the Largest Digital Healthcare Marketplace - Building the Leading Digital Platform for Consumer Healthcare May 2021
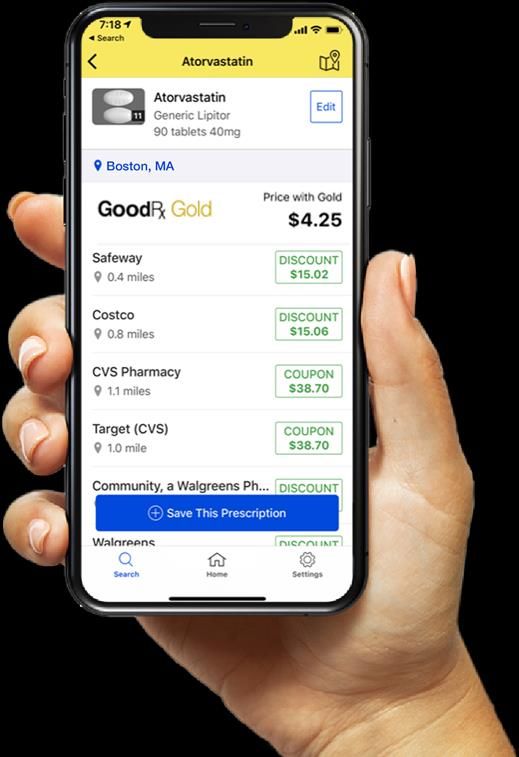
Healthcare in America versus other developed nations

           lowestUnited
                   healthcare
                        Kingdom quality1…                                                                            1
                                                                                                                                                                              …with some of the highest costs2
                               Australia                                                                             2

                               Netherlands                                                                           3

                               New Zealand                                                                           4

         Health CareNorway                                                                                           5
                     System Performance Rankings                                                                                                                                                                      per capita spend on healthcare by
                               Sweden                                                                                6
                                                                                                                 OVERALL
                                                                                                                 RANKING
                                                                                                                                                                                             2x                       Americans compared to citizens of
                                                                                                                                                                                                                      other OECD countries3
                               Switzerland                                                                           7

                               Germany                                                                               8

                               Canada                                                                                9

                               France                                                                               10                                                                                                of all personal bankruptcies are linked
                                                                                                                                                                                         66%                          to medical costs4
                               United States                                                                        11

Source: Lancet 2018 Human Capital Study; American Public Health Association 2019 Study; OECD Data
1.    Commonwealth Fund: 2017 study (as compared to Australia, Canada, France, Germany, the Netherlands, New Zealand, Norway, Sweden, Switzerland, and the United Kingdom)
2.
3.
      Peterson-KFF Health System Tracker; CMS; Commonwealth Fund: 2017 study (as compared to Australia, Canada, France, Germany, the Netherlands, New Zealand, Norway, Sweden, Switzerland, and the United Kingdom)
      Commonwealth Fund: 2017 study (as compared to Australia, Canada, France, Germany, the Netherlands, New Zealand, Norway, Sweden, Switzerland, and the United Kingdom)
                                                                                                                                                                                                                                                            6
4.    Study published in American Journal of Public Health; 2013-2016
Building the Largest Digital Healthcare Marketplace - Building the Leading Digital Platform for Consumer Healthcare May 2021
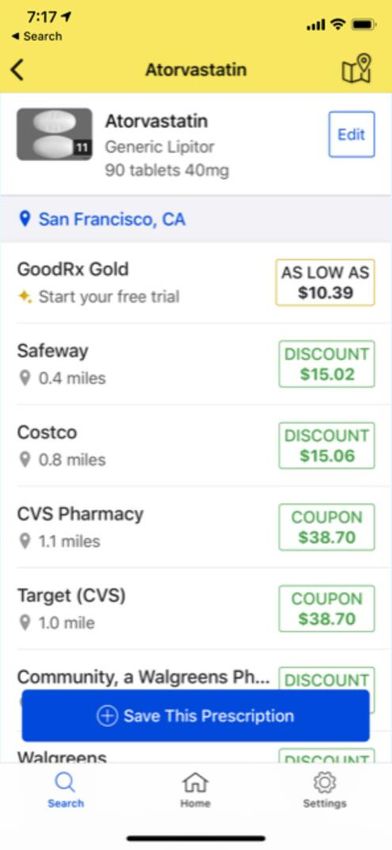
We started with prescriptions
          Now we have expanded our platform
                                                                                                                                                                                                                                                                      •        5Bn+ annual
            US healthcare market                                                                                                                                                                                                                                               prescriptions2

            $4.0 Trillion1                                                                                                                                                                                                                                            •        800MM+ annual
                                                                                                                                                                                                                                                                               physician visits3

                                                                                                                                                                                                                                                                      •        We estimate that most
            TAM of our current offerings                                                                                                                                                                                                                                       healthcare interactions
            $800 Billion4                                                                                                                                                                                                                                                      with consumers occur
                                                                                                                                                                                                                                                                               at the pharmacy

                                                                                                                                                                                                                                                                      •       Fragmented
                                       Telehealth4                                                                                                                                                                                                                            marketplace
                                       $250Bn
                                                                                                                                                                       Prescription Drugs4
                                                                                                                                                                       $524Bn                                                                                         •        Limited technology
                                                                                                                                                                                                                                                                               innovation in the last
                                                                                                                                                                                                                                                                               20 years
                                                                                                            Manufacturer Solutions4
                                                                                                            $30Bn

1.   CMS: 2020 projection
2.   Drug Channel Institute; measured in 30-day equivalent prescriptions: 2018 data
3.   KFF.org and CDC: 2018 data                                                                                                                                                                                                                                                                     7
4.   Prescription drugs market size based on CMS projected 2020 market size + company estimate regarding unfilled prescriptions; Manufacturer solutions market size based on 2016 medical marketing and advertising spend published in Journal of the American Medical Association in 2019;
     Telehealth market size based on 2020 projection by McKinsey & Company
Building the Largest Digital Healthcare Marketplace - Building the Leading Digital Platform for Consumer Healthcare May 2021
GoodRx improves Americans’ health and makes healthcare more affordable

                                20-30% of prescriptions in the U.S. not filled1                                                                                           GoodRx helps insured & uninsured consumers4

                                                                                                                                                                                     Uninsured
               $                Nearly $300Bn in cost from non-adherence2                                                                                                               26%

                                Someone dies every 4 minutes in the U.S.                                                                                                  Medicaid
                                from not taking prescribed medicine as directed or                                                                                          4%
                                at all3
                                                                                                                                                                                                            Medicare
                                                                                                                                                                                                              34%

                        We believe we have helped millions of consumers
                       afford to fill a prescription that would otherwise have
                                                                                                                                                                            Commercial
                                             gone unfilled5                                                                                                                    36%

1.   Internal estimate; Annals of Internal Medicine: The incidence and determinants of primary nonadherence with prescribed medication in primary care: a cohort study.
2.   New England Journal of Medicine: Taking Our Medicine — Improving Adherence in the Accountability Era; 2018
3.
4.
     American Journal of Health System Pharmacy: Meta-analysis of trials of interventions to improve medication adherence.
     GoodRx survey, July 2020
                                                                                                                                                                                                                        8
5.   GoodRx internal research; all-time number
Building the Largest Digital Healthcare Marketplace - Building the Leading Digital Platform for Consumer Healthcare May 2021
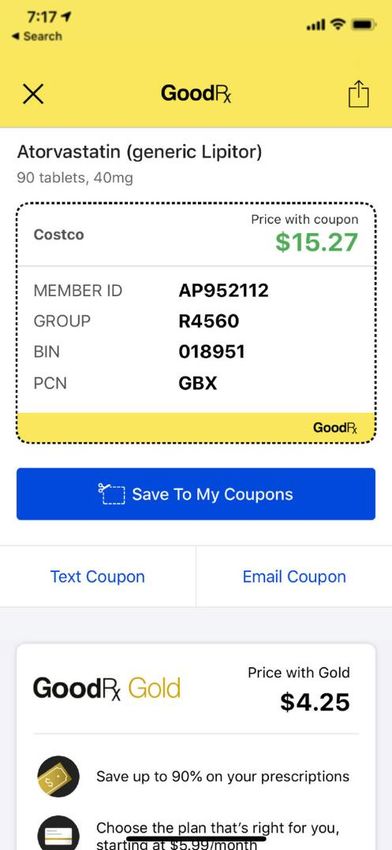
Help Americans get the
healthcare they need at a
price they can afford

Our Mission                 9
Building the Largest Digital Healthcare Marketplace - Building the Leading Digital Platform for Consumer Healthcare May 2021
Build the leading
digital platform for
consumer healthcare

Our Vision             10
GoodRx at a glance

                          #1                                                       $30Bn+                                                                                                                                      70,000+                                                           2M+
                                                                                                                                                                ~20M
            Most downloaded                                                      Estimated cumulative                                                         Monthly Visitors3                                                      Pharmacies with                                          Prescribers have a
            medical app in the                                                    consumer savings2                                                                                                                                  up-to-date prices                                       patient who has used
             last three years1                                                                                                                                                                                                                                                                      GoodRx

               80%+                                                                 $551M                                                                         42%                                                                     95%                                                   37%
               Repeat Activity4                                                         2020 Revenue                                                             2020 YoY                                                          2020 Gross Margin                                            2020 Adjusted
                                                                                                                                                              Revenue Growth                                                                                                                   EBITDA Margin5

1. Based on days with most downloads on Apple App Store and Google Play App Store 2017-June 30, 2020.
2. As of May 13, 2021. Savings are measured as the difference between the pharmacy list price and the price the consumer pays using GoodRx. Because consumers of our website and mobile application may switch pharmacies if they find a better discount, our consumer savings
   calculation includes an estimate of savings achieved based on switching pharmacies.
3. Monthly Visitors is the number of individuals who visited our apps and websites in a given calendar month. Visitors to our apps and websites are counted independently. As a result, a consumer that visits or engages with our platform through both apps and websites will be counted
   multiple times in calculating Monthly Visitors. When presented for a period longer than a calendar month, Monthly Visitors is averaged over each calendar month in such period.; March 2021
4. Repeat activity refers to the second and later use of our discounted prices by a single GoodRx consumer; 2016-December 31, 2020.
5. Adjusted EBITDA is a non-GAAP financial measure. We calculate Adjusted EBITDA, for a particular period, as net income (loss) before interest, taxes, depreciation and amortization, and as further adjusted for acquisition related expenses, cash bonuses to vested option holders,                     11
   stock-based compensation expense, payroll tax expense related to stock-based compensation, loss on extinguishment of debt, financing related expenses, loss on abandonment and impairment of operating lease assets, charitable stock donation and other expense (income), net.
   For a reconciliation of net income (loss), the most directly comparable GAAP financial measure, to adjusted EBITDA, see reconciliation slide in the appendix.
Our platform delivers value to multiple constituents, starting with consumers
                                                                                                                                                                                                                                                                                                       Increased
            $30B+                                                                                                                                                                                                                                                                                     Foot Traffic
            All-Time
            Consumer                                                                                                                                                                                                                                                                                  Customer
            Savings1                                                                  Consumer                                                                                                                                        Pharmacies                                                     Satisfaction

                                                                                                                                                                                                                                                                                                  Proven Growth
                                                                                                                                                                                                                                                                                                        Channel
            86
            Net Promoter                                                                                                                                                                                                                                                                              Long-term
            Score2                                                                                                                                                                                                                                  Pharmacy Benefit                                Partnerships
                                                                    Physicians                                                                                                                                                                      Managers (PBMs)

                                                                                                                                                                                                                                                                                               Engage & Convert
                                                                                                                                                                                                                                                                                                High-Intent Users
            $300B
            Costs From                                                                                                                                                                                                                                                                       Targeted Advertising
            Non-Adherence3                                                                                                                                                                                                                                                                          to High Intent
                                                                                     Payers                                                                                                                                           Manufacturers                                                   Consumers

1. As of May 13, 2021. Savings are measured as the difference between the pharmacy list price and the price the consumer pays using GoodRx. Because consumers of our website and mobile application may switch pharmacies if they find a better discount, our consumer savings calculation
   includes an estimate of savings achieved based on switching pharmacies.                                                                                                                                                                                                                                  12
2. GoodRx survey, February 2020.
3. New England Journal of Medicine: Taking Our Medicine — Improving Adherence in the Accountability Era; 2018.
Complexity creates inefficiency at the consumers’ expense
                                            Highly complex healthcare ecosystem                           Consumer faced with wide variance in price and lack of
                                       results in lack of consistency in consumer price                         transparency into available alternatives

                                                                                                                   Pharmacy A
                                                                                                                       $A
                                                                                          Manufacturers

                                                                                                                   Pharmacy B
                                                                                                                       $B                   Consumer
                      Employers/                                                PBMs
                       Insurers

                                                                                           Distributors
                                                                                                                   Pharmacy C
                                                                                                                       $C

                                                                                                                                                          13
Note: Represents illustrative drivers of Rx pricing and end consumer purchase decision.
GoodRx empowers the consumer

                          PBMs
                                                                                                     Pharmacy A   Pharmacy B   Pharmacy C   Single access
                                                                                                       $15.02       $38.70      $159.48
                                                                                                                                            point
                   Pharmacies
                                                                                                                                            Greater
                                                                                                                                            transparency
                Manufacturers                                                                          Doctor       Doctor       Doctor
                                                                        Proprietary                    Visit A      Visit B      Visit C    Cost savings
                                                                        Technology
                                                                                          Consumer

                      Medicare                                                                                                              Convenience

                                                                                                     On-Demand    On-Demand    On-Demand
           Patient Assistance                                                                         Consult A    Consult B    Consult C
                Programs

                                                                                                                                                            14
Note: Represents illustrative drivers of Rx pricing and end consumer purchase decision.
Our network strengthens with every transaction

               Leading Platform                        Trusted Brand

                                   Feedback loop
                                      creates a
      Product Expansion                                         Scale Further Improves Pricing
                                  hard-to-replicate
                                   virtuous cycle

       Expanding Unit Economics                       Strong Consumer Savings

                                                                                         15
GoodRx combines complex backend with simple, elegant consumer app
       Data sources                                             Engine
                                                    Proprietary               Constant
   Pharmacy saving programs                        pricing engine            data refresh

   U&C prices

   Medicare prices
                                          Secure
                                                                200bn                       Living
                                                             daily pricing data             database
   Pharmaceutical Manufacturers                               points distilled
                                                               into real-time
                                                                    data

   Patient assistance programs

   Multiple PBM networks                             Scalable                     AI / ML

                                                                                              16
Simple and powerful

                      Free to use
                      Significant
                      consumer savings
                      Improves
                      consumer health

                      Benefits industry
                      stakeholders

                      Value-added
                      adjacencies

                                          17
Consumers and healthcare providers love us                                                                                                                 “My patients with chronic care conditions pay
                                                                                                                                                                      LESS for their meds by paying cash through
               NPS        Scores1
                                                                                                                                                                      GoodRx than by going through insurance.”
                                                                                                                                                           902
                                                                                                                                              862
                                                                                                                                                                      Marguerite Duane, MD

                                                                                                                                                                      “Without GoodRx’s low prices I’d never be able
                                                                                                                          64
                                                                                                     61
                                                                                                                                                                      to afford my medications...they basically help
                                                            50                  50
                                                                                                                                                                      to save my life month after month.”
                                       40                                                                                                                             KT, Patient3
                  32

                                                                                                                                                                       4.8 Stars on >700K reviews4
                                                                                                                                       Among Healthcare    Among
                                                                                                                                         Professionals    Consumers

1.   Non-GoodRx NPS sourced from Consumer Gauge. Netflix, 2018; Amazon, 2017; Disney, 2013; Google, 2017; UnitedHealth Group, 2018; Humana, 2014.
2.
3.
     GoodRx NPS based on a survey of consumers on the GoodRx website in February, 2020.
     Consumer Reviews from Better Business Bureau website.
                                                                                                                                                                                                              18
4.   As of June 30, 2020.
Subscription products deliver more value to
             consumers and drive higher lifetime value
                                                                                                                                                                                                                                                                                                 Gold
                                                                                                                                                                                                                                                                                             Monthly Plan

                                                                                                                                                                                                                                                                                 1,000+ prescriptions
                                         ~2x                                                                                                                                                                                                                                    under $10 at up to 90%
                                                                                                                                                                                                                                                                                 savings off list prices
                                   YoY increase in
                                     number of
                                    subscribers1

                                                                                                                                                                                                                                                                                      Kroger
                                        ~2x                                                                                                                                                                                                                                                      Annual Plan
                               one-year
                        contribution compared                                                                                                                                                                                                                                    100+ medications for
                          to our prescription                                                                                                                                                                                                                                     free, $3, or $6 and
                               offering1                                                                                                                                                                                                                                        additional discounts on
                                                                                                                                                      GoodRx                                  Kroger Rx                                                                              1,000+ other
                                                                                                                                                       Gold                                  Savings Club                                                                            prescriptions
                                                                                                                                                                                          Powered by GoodRx                                                                      GoodRx
                                                                                                                                                                                                                                                                                  Gold

1. Based on cohort of consumers that started using subscriptions between July 2018-June 2019. First year contribution represents the cumulative revenue generated by consumers in the first year after they became consumers of our subscription offerings, less our estimated cost of revenue
   attributable to such revenue.                                                                                                                                                                                                                                                                               19
Delivering value to pharmaceutical manufacturers by
         engaging our existing high-intent users

                                                                                                                                                                                                                                                                                           $30B
                                                                                                                                                                                                                                                                                Medical marketing and

                                           20%                                                                                                                                                                                                                                  advertising spend by
                                                                                                                                                                                                                                                                                  pharmaceutical
                                 of GoodRx searches                                                                                                                                                                                                                                manufacturers2
                                 are for Brand Drugs1

                                       ~20M                                                                                                                                                                                                                                Incremental
                                        High intent
                                      Monthly Visitors2                                                                                                                                                                                                                        margins capitalizing on
                                                                                                                                                                                                                                                                                  existing traffic

             Patient navigation to the                                                              Integrated copay                                                    Drives new patient starts and
             best affordability option                                                                 assistance                                                       continuing patient adherence

1. Internal data, 2019-2020.
2. Monthly Visitors is the number of individuals who visited our apps and websites in a given calendar month. Visitors to our apps and websites are counted independently. As a result, a consumer that visits or engages with our platform through both apps and websites will be counted multiple times
   in calculating Monthly Visitors. When presented for a period longer than a calendar month, Monthly Visitors is averaged over each calendar month in such period; March 2021.
3. Based on 2016 medical marketing and advertising spend published in Journal of the American Medical Association in 2019.
                                                                                                                                                                                                                                                                                                            20
4. 2021 compared with 2020.
Telehealth expands our offerings

                                                20% of consumers           See a provider via
                                                                                                       Drives traffic to
                                                           do not have     telehealth and receive a
                                              a prescription at the time   prescription if necessary   prescriptions platform
                                              of their GoodRx search1                 2

1. Internal data, 2020 as of August.
                                                                                                                           21
2. HeyDoctor by GoodRx rebranding as GoodRx Care.
Prescriptions provide platform to expand flywheel of adjacent services
                                                                                                                                                            Pharmaceutical
                      Prescriptions                                                          Subscriptions                                                                                      Telehealth                           Marketplace
                                                                                                                                                         Manufacturer Solutions

                                                                                                                                                                  Manufacturer                                                          Marketplace
                                                                                                                                                                   Solutions

        Price discovery and discounts on                                                Membership plans                                                       Brand drug consumer       Online primary care visits and lab-   Expand telehealth offering though
                prescriptions                                                   for discounted prescriptions with                                              affordability solutions            testing services                  third-party providers
                                                                                       even higher savings

                   Business model:                                                        Business model:                                                       Business model:                 Business model:                       Business model:
                      Transaction Fees                                          Subscription (monthly / annual)                                            Advertising and integrated       Per visit + mail order + lead            Referral fees + lead
                                                                                                                                                              technology partner            generation for prescriptions          generation for prescriptions

1. Calculated as number of visits that resulted in a coupon redemption out of all paid visits (excluding free COVID-19 visits); for six months ended June 30, 2020.
                                                                                                                                                                                                                                                           22
2. HeyDoctor by GoodRx rebranding as GoodRx Care.
Growing consumer value over time
                                                                              Pharmaceutical
                               Prescriptions        Subscriptions                                        Telehealth              Marketplace
                                                                           Manufacturer Solutions

                                                                 Increased consumer value

                   Strong standalone unit      Upsell increases consumer   20% of GoodRx searches   20% of consumers don’t   Expanding services and
                        economics                  savings and LTV           are for brand drugs1     have a prescription2         solutions

1. Internal data, 2019-2020.
                                                                                                                                                      23
2. Internal data, 2020.
Prescription transaction example                                                                                               Consumer Seeks New Prescription
                                                                                                                                             Shelf prices vary widely across pharmacies

   $ 110

                                                                                                                                             GoodRx Presented at Pharmacy
    $ 90
                                                                                                                                         %   GoodRx becomes benefit of record

                                                                                                                                             Consumer Pays Discounted Price
                                                                                                                                     $
    $ 70

                                      Discount
                                                                                        Transaction Fee                                      Discount of over 70%
                                                                               14-15%1 of consumer price
    $ 50

                                                                                                                                             Pharmacy Pays PBM Fee
                                                                                                                                     PBM     PBM receives fee
                                                                      GMV                        Revenue
    $ 30

    $ 10
                                                                                                                                             GoodRx Takes Portion of PBM Fee
                                                                                                                                             This is revenue

           Full Retail Price          GoodRx                 Consumer Pays Pharmacy Pays GoodRx Takes       Pharmacy      Pharmacy
   $(10)
                                    Presented at             Discounted Price PBM Fee    Portion of PBM     Payment to     Margin
                                     Pharmacy                                                  Fee         Manufacturer

1. Calculated as revenue from the core prescriptions product over GMV. 14.4% in 2019.                                                                                                     24
Multi-fill recurring usage drives repeat activity

                                                     First fill                                                          Refills (same prescription)              Refill + new prescriptions
                                                                                                               Most prescriptions are for chronic medication

                                                                                                                                                                                                80%+
                                                                                                                                                                                                Repeat
                                                                                                                                                                                                Activity2
                               The consumer presents                                                                        GoodRx applies                      GoodRx applies to refills and
                              GoodRx1 at a pharmacy to                                                                       to future refills                 new prescriptions without the
                                 receive a discount                                                                      without the consumer                    consumer having to re-
                                                                                                                         having to re-present it                        present it

                                 GoodRx is saved to the                                                           The consumer continues to                      The consumer continues to
                                 consumer’s profile at the                                                      save and GoodRx continues to                   save and GoodRx continues to
                                       pharmacy                                                                           earn fees                                      earn fees

1. GoodRx provides adjudication information that is stored by the pharmacy.
                                                                                                                                                                                                        25
2. Repeat activity refers to the second and later use of our discounted prices by a single GoodRx consumer; 2016-2020.
Strong consumer growth at scale                                                                                                                                                                                                                                                          931K
                                                                                                                                                                                                                                                                                                 Subscription Plans2
                                                                                                                                                                                                                                                                                                    +96% YoY
                Monthly Active Consumers1 (M)

                                                                                                                                                                                                                                            5.6         5.7
                                                                                                                                                                                                                                                                                                     ~7M+
                                                                                                                                                                                                          4.9                    4.9                                                         Individuals between
                                                                                                                                                                                                                                                                                            MACs and Subscribers3
                                                                                                                                                                                               4.3                   4.4

                                                                                                                                                                                   3.8
                                                                                                                                                                        3.5

                                                                                                                                                 2.7
                                                                                                                                                             3.2
                                                                                                                                                                                                                                                                                                      ~20M
                                                                                                                                      2.4                                                                                                                                                            Monthly Visitors4
                                                                                                                           2.2
                                                                                                               2.0
                                                                                                    1.7
                                                                                         1.5
                                                                  1.3        1.3

                    0.7
                                0.9        1.0        1.1
                                                                                                                                                                                                                                                                                                       20%+
                                                                                                                                                                                                                                                                                                      Brand Searches

                  Q1'16 Q2'16 Q3'16 Q4'16 Q1'17 Q2'17 Q3'17 Q4'17 Q1'18 Q2'18 Q3'18 Q4'18 Q1'19 Q2'19 Q3'19 Q4'19 Q1'20 Q2'20 Q3'20 Q4'20 Q1'21

1. Refers to the number of unique consumers who have used a GoodRx code to purchase a prescription medication in a given calendar month and have saved money compared to the list price of the medication. A unique consumer who uses a GoodRx code more than once in a calendar month to purchase
   prescription medications is only counted as one Monthly Active Consumer in that month. A unique consumer who uses a GoodRx code in two or three calendar months within a quarter will be counted as a Monthly Active Consumer in each such month. Monthly Active Consumers do not include
   subscribers to our subscription offerings, consumers of our pharmaceutical manufacturers solutions offering, or consumers who used our telehealth offerings. When presented for a period longer than a month, Monthly Active Consumers is averaged over the number of calendar months in such period.
   Beginning in the fourth quarter of 2020, our Monthly Active Consumers number includes consumers we acquired through the acqui sition of Scriptcycle in August 2020. Monthly Active Consumers from acquired companies are only included beginning in the first full quarter following the acquisition.
2. Represents the ending subscriber balance across both our subscription plans, GoodRx Gold and Kroger Savings Club as of March 31, 2021.
3. Represents the sum of March 2021 MAC and the number of individuals across Gold and Kroger as of March 31, 2021.
                                                                                                                                                                                                                                                                                                                    26
4. Monthly Visitors is the number of individuals who visited our apps and websites in a given calendar month. Visitors to our apps and websites are counted independently. As a result, a consumer that visits or engages with our platform through both apps and websites will be counted multiple times in
   calculating Monthly Visitors. When presented for a period longer than a calendar month, Monthly Visitors is averaged over each calendar month in such period; March 2021.
Strong revenue growth uniquely coupled with high profitability

                                                                                                                                                                                           Adj. EBITDA ($M)1
        Revenue ($M)

                                                                                54%                                                                                                                                                                       61%
                                                                                                                                                                                                                                                           CAGR
                                                                                 CAGR

                                                                                                                                                    $551
                                                                                                                                                                                                                                                                                                        $203
                                                                                                                    $388
                                                                                                                                                                                                                                                                                                 $160
                                                                                                                                                                                                                                                                 $128
                                                                                    $250
                                                    $157                                                                                                                                                                          $63
                      $99
                                                                                                                                                                                                  $30
                      2016                            2017                            2018                           2019                            2020                                         2016                            2017                             2018                          2019   2020

1. Adjusted EBITDA is a non-GAAP financial measure. We calculate Adjusted EBITDA, for a particular period, as net income (loss) before interest, taxes, depreciation and amortization, and as further adjusted for acquisition related expenses, cash bonuses to vested option holders, stock-
   based compensation expense, payroll tax expense related to stock-based compensation, loss on extinguishment of debt, financing related expenses, loss on abandonment and impairment of operating lease assets, charitable stock donation and other expense (i ncome), net. For a                            27
   reconciliation of net income (loss), the most directly comparable GAAP financial measure, to adjusted EBITDA, see reconciliation slide in the appendix.
Building the leading digital platform for consumer healthcare
                          Transparency and trust is core to our platform

                         Consumer first approach is always top of mind

                  Macro trends drive the need for our solutions and technology

         First mover advantage and partnership strategy create deep competitive moat

                 Every transaction reinforces value proposition to the ecosystem

                   Unique combination of scale, high-growth and profitability

           Opportunity to become the leading digital healthcare platform in the UnitedStates

                                                                                               40
                                                                                               28
Thank You
www.goodrx.com
Appendix
Adjusted EBITDA Reconciliation
                                                                                                                                                                                                             Year Ended December 31
             (dollars in thousands)                                                                                                                                           2016                             2017                         2018                         2019             2020
             Net Income (Loss)                                                                                                                                           $8,9131                       $28,7721                       $43,793                      $66,048           ($293,623)
               Interest income                                                                                                                                                  (21)                             (24)                       (154)                       (715)             (160)
               Interest expense                                                                                                                                              3,541                           6,970                       22,193                      49,569             27,913
               Income tax expense (benefit)                                                                                                                                  6,188                         10,931                          8,555                     16,930             (9,827)
               Depreciation and amortization1                                                                                                                                9,089                           9,099                         9,806                     13,573             18,430
               Other expense (income), net                                                                                                                                      154                                (5)                              7                   2,967              (22)
               Loss on extinguishment of debt2                                                                                                                                        -                      3,661                         2,857                        4,877                 -
               Cash bonuses to vested option holders3                                                                                                                                 -                      1,400                       38,800                                  -            -
               Financing related expenses4                                                                                                                                            -                                -                             -                     463           1,319
               Acquisition related expenses5                                                                                                                                    142                                   2                          15                     2,170            7,366
               Stock-based compensation expense6                                                                                                                             2,002                           2,150                         1,762                        3,747          397,285
               Charitable stock donation7                                                                                                                                             -                                -                             -                           -      41,721
               Payroll tax expense related to stock-based compensation                                                                                                                -                                -                         61                        173          12,086
               Loss on abandonment and impairment of operating lease assets8                                                                                                          -                                -                             -                           -         961
            Adjusted EBITDA9, 10                                                                                                                                        $30,008                          $62,956                    $127,695                     $159,802             $203,449
               Adjusted EBITDA Margin11                                                                                                                                    30.2%                            40.0%                         51.2%                       41.2%              36.9%
1. 2016 and 2017 were audited using private company standards. Net Income and Depreciation and Amortization presented reflect the elimination of goodwill amortization due to shift away from private company GAAP and to make them comparable to 2018, 2019 and 2020 audited.
2. Related to early repayment of debt.
3. $38.8m in in 2018 reflect bonuses paid to vested option holders in connection with special dividend payments made to stockhol ders.
4. Financing related expenses include third party fees related to proposed financings.
5. Acquisition related expenses include third party fees for actual or planned acquisitions, including related legal, consulting and other expenditures, retention bonuses to employees related to acquisitions, and change in fair value of contingent consideration.
6. Non-cash expenses related to equity-based compensation programs, which vary from period to period depending on various factors including the timing, number and the valuation of awards.
7. Non-cash expense related to a donation of 1,075,000 shares of our Class A common stock that was made to a charitable foundation in the fourth quarter of 2020.
8. Non-cash loss on the abandonment and impairment of operating lease assets related to certain office space that was abandoned or subleased.
9. Adjusted EBITDA is a non-GAAP financial metric.                                                                                                                                                                                                                                                31
10. Totals may not sum due to rounding.
11. Adjusted EBITDA Margin is calculated as Adjusted EBITDA divided by revenues.
You can also read