Calafia - California Map Society
←
→
Page content transcription
If your browser does not render page correctly, please read the page content below
Calafia
The Journal of the California Map Society
March 2020
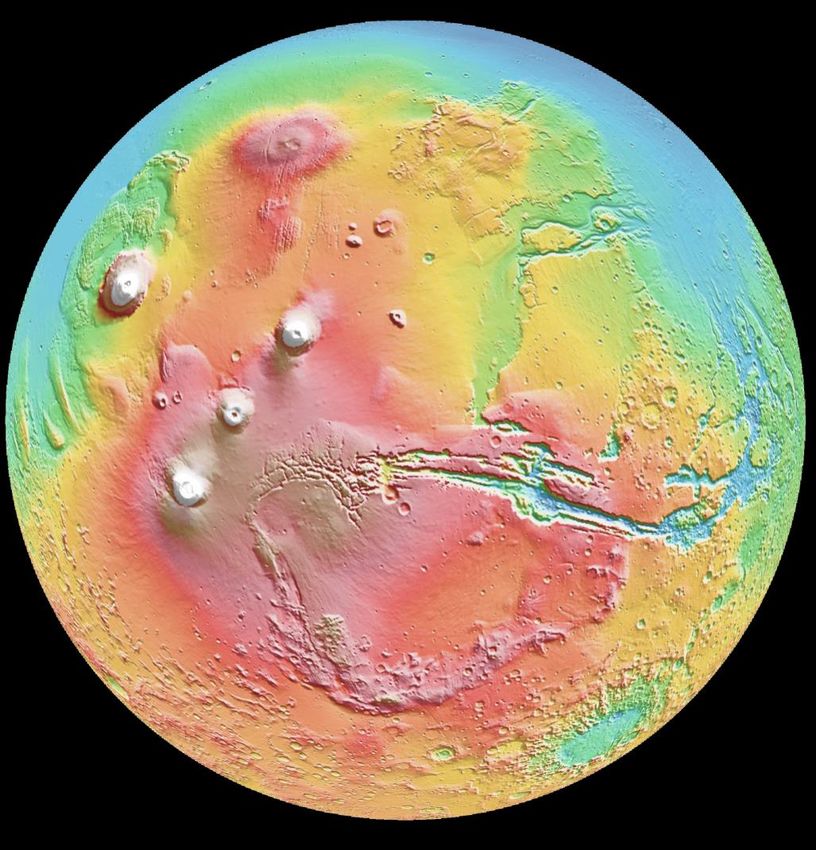
Mars false color topograph-
ic image, featuring Tharsis
topographic rise (red &
Volume 2020, issue 1 Calafia Journal white areas),Page
NASA/JPL
1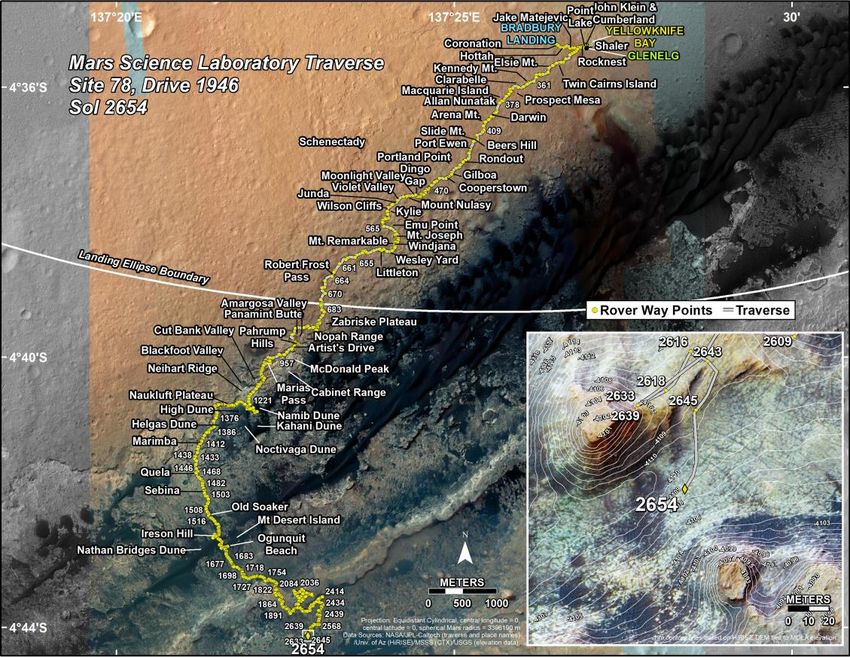
Page 2 Calafia Journal Volume 2020, issue 1
Calafia
                                           the Journal of the California Map Society
                                                   Volume 2020, Issue 1 — March 2020
                                                      www.californiamapsociety.org

                                           Spring meeting, April 25, 2020
         Contents                      SAN FRANCISCO PUBLIC LIBRARY—MAIN LIBRARY
April 2020 Meeting       3                  N37° 46' 45", W122° 24' 59" ///print.hopes.cared*
President’s Letter       4                   Saturday, April 25, 2020, 9:15 am to 5:00 pm
Editor’s Note            5                    100 Larkin Street, San Francisco, CA 94102
CMS Education Fund       5                        Our 87th Regional Meeting!
Meeting Program          6
Library Map, Directions 7
Fall Meeting Recap
My Favorite Map
                         8
                        11
                               O      ur Spring Meeting will include a wide array of topics from the 14 th to the 21st Centuries
                                      and will be held at The San Francisco Public Library, Main Branch, 100 Larkin Street,
                               San Francisco, CA. There will be no reg-
Carto-Quiz              13     istration fee.
Meet Our Member         14
                               The morning will begin at 9:15 am with
Apps for Maps           15
                               Morning Hospitality (coffee, tea, and
Mapping Asteroids       17     pastries) in the Latino/Hispanic Room,
Moon Mapping /Naming 18        first floor. (The hospitality is for CMS
Book Review             24     Members only.)
Historic Mars Mapping 25
Wayfinding on Mars      29     At 10:00 am, we will convene in the Ko-
Rogue Photo of Earth    33     ret Auditorium for welcomes by Presi-
Celestial Map Primer    36     dent Jon Jablonski, Vice President Ron
Teaching Astronomy      40     Gibbs, and City Archivist, San Francisco
LOC Treasures           43     Public Library, Susan Goldstein.
Rumsey Map Ctr Events 47                                                       See page 7 for Facility Map & Directions
                               Our first speaker will be Courtney Spikes                                       and Directions
Bay Area Map Group      48     of Los Angeles, CA. Her topic will be: Mapping Paris After Haussmann. In 1860, Emperor
SF Map Fair             50     Napoleon III unilaterally altered the map of Paris—doubling its size and quadrupling the
Student Paper           53     population. City planner Baron Haussmann, deep into his 20-year renovation project, recon-
Mapping Here/There      63     figured the map of France’s capital into the ‘city of light’ we celebrate today. Courtney earned
Gerald Greenberg        66     her degrees from the University of Pennsylvania and UCLA. She lectures at Loyola Mary-
CMS Information         67     mount University and serves as a historical consultant for television and feature films.

                               Our second speaker will be Susan Schulten of Denver, CO. Susan will speak on: How Maps
                               Made America. Whether handmaidens of diplomacy, instruments of social reform, or even
                               advertisements, maps have both reflected and shaped American history. Here Susan uses
                               maps to narrate some essential maps that mattered from the voyages of discovery to the digi-
Calafia : The Journal of the   tal age. A professor of history at the University of Denver, Susan authored three books on
California Map Society         cartography including A History of America in 100 Maps (2018) and Mapping the Nation:
Juliet Rothman, Editor         History and Cartography in Nineteenth-Century America (2012), which received the Norris
Fred DeJarlais, Publisher
                               Hundley Prize from the Pacific Coast Branch of the American Historical Society. She has
The journal is published bi-
                               spoken in the Bay Area on other recent occasions.
annually by the Society.

                               We ‘ll have a break from 11:45-1:00pm to have lunch on your own at one of the nearby res-
   * www.what3words.com        taurants. A list of nearby restaurants is provided on page 7 of the journal.

   Volume 2020, issue 1                               Calafia Journal                                          Page 3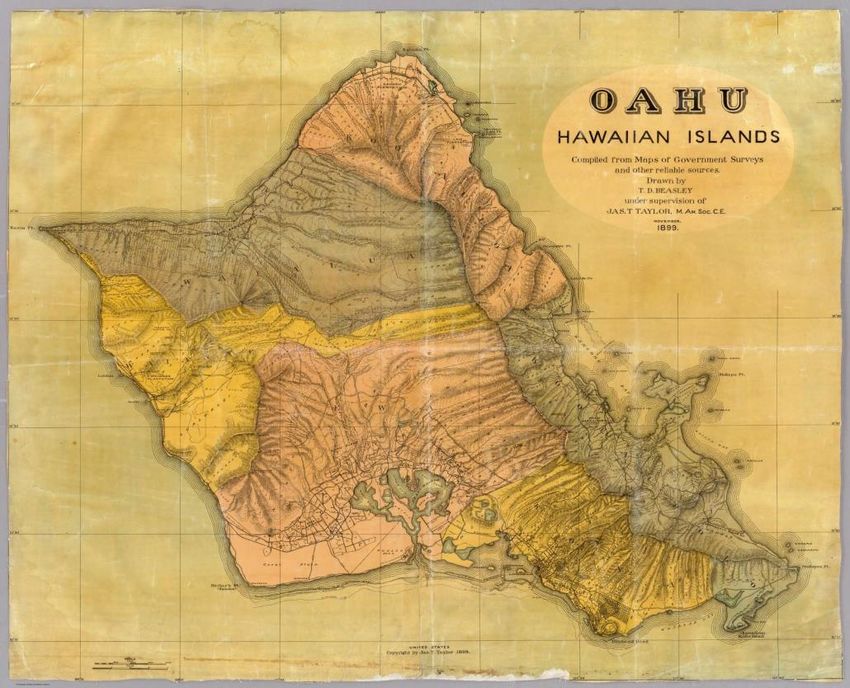
Our first speaker after lunch will be Richard Breiman of Ala-
mo, CA. Rich will speak on: The Remarkable Life and Legend-                            President’s
ary Voyages and Discoveries of Captain James Cook, the Great-                            Letter
est Explorer of the 18th Century. Historical maps, engravings,
and journal excerpts will illustrate the presentation. Rich is a                       Jon Jablonski,
retired University of California San Francisco Professor of                              CMS President
Radiology and an avid life-long collector, most recently of an-
tiquarian maps, prints and books, including the British Admi-      Dear Society members and friends:
ralty’s official authorized journals, maps and engravings from
Captain Cook’s expeditions.

Next, Jonathan Van Coops of San Francisco, CA will pre-
                                                                   S    pring greetings from the board and from myself personally.
                                                                        I am writing on a Sunday afternoon after noticing our first
                                                                   iris of the spring here on the Central Coast. That got me to
sent a personal story, entitled Revolution, Maps, and Family:      thinking about the wide range of landscapes in the state, and
El Rondin-Campaigns of Toribo Ortega and Jose de la Cruz           all the different ways we describe Northern versus Southern
Sanchez during the Orozco Rebellion of 1912. Jonathan is the       California. I think we will visit this topic at our fall meeting in
great-grandson of Esteban Luján, who authored “El Rondín”        the South.
during the Mexican Revolution. Using several beautiful his-
torical maps, he will illustrate the geographic context and con-   First, though, we have our April 25th spring meeting at the
ditions that led to Orozco’s rebellion. As a geographer and        San Francisco Public Library—the Main Library. This is an-
cartographer, Jonathan enjoyed a 40-year career leading the        other meeting that we are thrilled to host with no cost to
California Coastal Commission’s Mapping and GIS                    members or the general public. The last time we met at SFPL,
(Geographic Information System) Program before retiring in         more than 125 people attended. Others poked their heads in
2015.                                                              throughout the day—either for individual talks, or just curi-
                                                                   ously passing through. I wouldn't be surprised if we reached
At 2:30-3:00pm, we’ll have a short break in the Latino/            more than 200 people that day. I am very much looking for-
Hispanic Room, first floor, again for Members only.                ward to a repeat! See inside this issue for more details.

Then, Tom Paper and Jim Schein of San Francisco, CA                Of course, next year, we will return to the Rumsey Center at
will make an innovative presentation, entitled: A Pop-up Ex-       Stanford University. Over the past five years, the Rumsey Cen-
hibit on the Cartographic History of San Francisco. Covering       ter and we have partnered using money outside of membership
1507 to the present day, this exhibit reveals the key maps that    dues. These funds were raised from members who have the abil-
have uncovered and articulated what is San Francisco. Tom is       ity and desire to donate above their membership. These funds
a Managing Partner of Webster Pacific, a location analytics        enable our annual author talk and student paper competition
consulting firm, and Jim is the owner of Schein & Schein, a        dues-- both of which are presented in the South—as well as the
local business specializing in vintage maps and prints.            Northern meeting every-other-year.

The last lecture will also be a novel one as Juliet Rothman of     The board unanimously voted to start fundraising for another
San Francisco and Fred DeJarlais of Capitola, CA will pre-         five-year cycle of programming. We have set the goal at
sent Calafia: Bringing a Professional Cartographic Journal to      $25,000. As a board officer, I know there were gifts of multiple
Life. As a member of professional journal Advisory Boards,         -thousands-of-dollars. As a state employee, I well know that
and as a long-time President and leader of the California Map      most of us in California don't have that much in our annual
Society, respectively, Juliet and Fred, editor and publisher of    giving budgets. If you are a person of such means, I will chal-
our journal, Calafia, will discuss the arduous, but rewarding      lenge you to donate the entire $25k and then, in turn, chal-
path of transforming the Society’s newsletter into a publica-      lenge the board to fundraise for an additional set of activities.
tion that reflects the multifaceted interests of our members       If you donated the first time around, please consider donating
and attracts the attention of the wider cartographic world.        at a higher level, and make the same challenge to the board.
                                                                   And if you are like me and like what we've been doing over the
The program will conclude with a short Business Meeting,           past few years, kick in whatever you feel comfortable with. I
beginning at 4:30pm, in the Koret Auditorium.                      don't care if it's five or five hundred dollars, but also challenge
                                                                   our board to do more. Finally, please consider adding a dona-
                                                                   tion of some of your time and energy in the coming year.

        Page 4                                  Calafia Journal                           Volume 2020, issue 1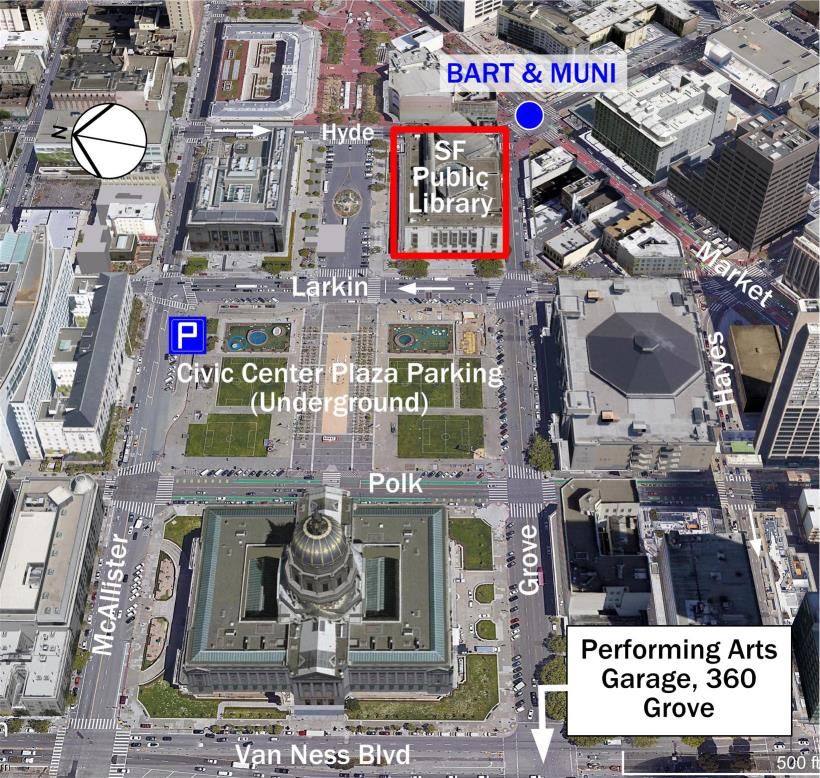
Editor’s Note                                              CMS EDUCATION FUND
                                                                  The California Map Society Education Fund was established
Our Spring issue’s theme is the mapping of space, chosen
                                                                  in 2014 by the Society to support scholarly activities around
in honor of the 50th anniversary of the Apollo moon
                                                                  the state. During the first five years, we sponsored an annual
landing, and we include a number of articles on this fasci-
                                                                  lecture by a noted author or other expert in the field of cartog-
nating subject in our Journal. Our own Nick Kanas,
                                                                  raphy, as well as an annual student paper competition. Lectures
whose special interest is space mapping, shares an
                                                                  are held at the David Rumsey Map Center at Stanford Univer-
“Historical Primer” on celestial maps, Robert Garfinkle,
                                                                  sity, which co-sponsors the program, and one or more venues
a scholar of the history of astronomy, takes us on a 400-
                                                                  in Southern California. The Fund provides transportation,
year journey of the mapping and naming of locations on
                                                                  accommodations, and an honorarium for both the lecturer and
the moon, and Henri Lese, a docent at the California
                                                                  the award winner. This issue of Calafia features the scholarship
Academy of Science, shares the history of mapping our
                                                                  of the 2019 award recipient, Geoffrey Oliver Lewis.
nearest neighbor, Mars. NASA scientist Fred Calef’s de-
scription of the Mars Rover missions gives us special in-
                                                                  The Education Fund has been successful in achieving its finan-
sights into the specifics of Mars exploration.
                                                                  cial goals for our first five-year term. At its fall, 2019 meeting,
                                                                  the Board of Directors unanimously voted to renew the pro-
We learn about Dale Shellhorn’s rogue photo of earth
                                                                  gram with a new round of fundraising. We have set a goal of
from deep space, taken while looking back from an out-
                                                                  raising $25,000 to support the program through 2024. We
ward-bound space mission, from Curtis Bird of the Old
                                                                  encourage past contributors to extend their generosity and
Map Gallery in Denver, and some of the details of the
                                                                  help us to continue this worthy program. We hope that mem-
process of mapping asteroids from a presentation by Dr.
                                                                  bers who have yet to contribute to the Fund will make a finan-
Edward Lu, Director of the Asteroid Institute at the
                                                                  cial commitment to the program.
Rumsey Center. Chris Lane from the Philadelphia Print
Shop West shares what was probably the first attempt at
                                                                             Sponsors of the Education Fund include:
a formal education about astronomy in the NY public
                                                                                               Gold
school system, Asa Smith’s 1848 “Astronomy Atlas.”
                                                                                            Pat Boyce
Two of our regular features are also space-oriented:
                                                                                          John Fleming
Leonard Rothman’s My Favorite Map article features a
                                                                                          Fred DeJarlais
map of “The Deluge”, given a date of 2348 B.C. by its
                                                                                       Leonard Rothman
author, Edward Quin, which appears in his 1836 “An
                                                                                              Silver
Historical Atlas”, and a review of the newest edition of
                                                                                       Warren Heckrotte
Nick Kanas’ “Star Maps” book by Jonathan Crowe.
                                                                                           Nick Kanas
                                                                                        Glen McLaughlin
Apps for Maps features Nicole Martinelli’s Resilience
                                                                                             Bronze
Maps, a system of mapping essential information for
                                                                                            Juan Ceva
emergencies. Using her article, we can each follow her
                                                                                          William Eaton
process, and thus be prepared for any emergency—a real-
                                                                                        Anthony Farndale
ly important project to ensure safety! We Meet Our
                                                                                          Robert Golden
Member Wally Jensen, and learn of his interesting life
                                                                                          Philip Hoehn
experiences, explore meetings and conferences in Map-
                                                                                           Wally Jansen
ping Here and There, and test ourselves on Fred DeJar-
                                                                                          Barbara Keck
lais’ Carto-Quiz. This edition also includes my own arti-
                                                                                          George Piness
cle on some special cartography treasures in the Library
                                                                                       Dorothy Raphaely
of Congress, Fred’s summary of noteworthy recent
                                                                                         Walter Schwartz
events at the Rumsey Map Center, an article on last Sep-
                                                                                     Julie Sweetkind-Singer
tember’s San Francisco Map Fair, and a summary of last
                                                                                           Bill Warren
fall’s two wonderful area meetings: the BAM (Bay Area
Map Grpup) meeting at Ron Gibb’s home, and the
                                                                  The Society is grateful for our contributor’s support of this
South California Regional Meeting at the Westchester
                                                                  important program. Please consider adding your name to this
Loyola Branch Library. We also include a treatist on the
                                                                  very special list by making a donation to the Fund!
                               continued at EDITOR, page 7

     Volume 2020, issue 1                                     Calafia Journal                                        Page 5
California Map Society
                    Spring Conference at San Francisco Public Library
                                   100 Larkin Street
                                Saturday, April 25, 2020
                             Program Schedule
      9:15 – Morning Hospitality in Latino/Hispanic Room, first Floor, Mem-
      bers Only
      10:00 – Welcome by President Jon Jablonski, Vice President Ron Gibbs,
      and City Archivist Susan Goldstein in Koret Auditorium
      10:15 – Courtney Spikes, Mapping Paris after Haussmann
      11:00 – Susan Shulten, How Maps Made America
      11:45 – Break and Lunch on your own. A list of nearby restaurants will be
      provided, and the café of the Asian Museum is just across the street.
      1:00 – Richard Breiman, The Remarkable Life and Legendary Voyages and
      Discoveriesof Captain James Cook, the Greatest Explorer of the 18th Century
      1:45 – Jonathan Van Coops, Maps and Family: El Rondin-Campaigns of
      Toribo Ortega and Jose de la Cruz during the Orozco Rebellion of 1912
      2:30 – Break in Latino-Hispanic Room, first floor – Members only
      3:00 – Tom Paper and Jim Schein, A Pop-Up Exhibit on the Cartographic
      History of San Francisco
      3:45 – Juliet Rothman and Fred DeJarlais, Calafia, Bringing a Profession-
      al Cartographic Journal to Life
      4:30 – A brief Business Meeting

                 Please see page 3 for a more expansive description of
                  presentations that will be provided at this meeting

FOR YOUR CONVENIENCE LOOSE SHEETS CONTAINING PROGRAM, MAPS & DIRECTIONS
    AND MEETING REGISTRATION INFORMATION ARE ENCLOSED WITH THIS ISSUE

 Page 6                      Calafia Journal                     Volume 2020, issue 1
Directions, Parking & Food

                    https://sfpl.org/locations/main-library/about/parking-main-library

EDITOR, continued from page 5                                                      Sam's Diner
                                                                            http://www.samssf.com/?
early colonial history of the Hawai’i written by Geoffrey Oli-     utm_source=tripadvisor&utm_medium=referral
ver Lewis, winner of this year’s Student Writing Contest—a
contest co-sponsored by CMS and the David Rumsey Map                        Ananda Fuara (vegetarian)
Center.                                                                  https://www.anandafuara.com/?
                                                                   utm_source=tripadvisor&utm_medium=referral
We hope that everyone plans to attend our Spring meeting,                             Gyro King
coming very soon at the San Francisco Library, and full de-                   http://www.gyroking.co/
tails about the meeting, location, and presentations are in-
cluded here. We look forward to seeing you!                                           Soluna
                                                                           https://www.solunasf.com/?
We hope that you enjoy our Journal, and hope to continue to        utm_source=tripadvisor&utm_medium=referral
present articles on different themes in each edition. Our fall
                                                                                   Lalitha Thai
issue of Calafia will feature city mapping. We welcome sug-                 http://www.lalitasf.com/?
gestions for future themes, and strongly encourage members’        utm_source=tripadvisor&utm_medium=referral
contributions on their areas of special interest—these are
truly essential to our effort.                                             The Market at the Twitter Building
                                        Juliet Rothman, Editor     https://visitthemarket.com/. A gourmet food mall

     Volume 2020, issue 1                                  Calafia Journal                               Page 7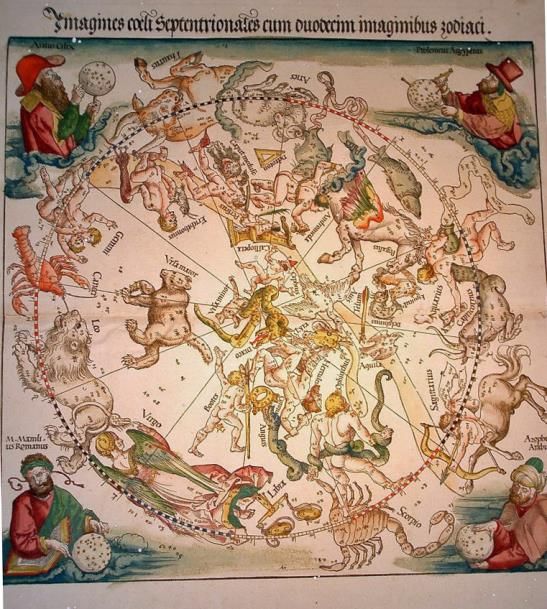
He listed a few facts about the LA region: The first settlements
         Fall Meeting Recap                                           were Tongva villages such as Topanga and Cucamonga, in the
    Westchester –Loyola Library                                       lowlands. One of the villages, Yangna, became the historic
        Los angeles 10/26/19                                          core of LA, where today's grid pattern of main streets is offset to
                                                                      align with the old central plaza. While the current city of Los

T      he Fall CMS meeting, on October 26th, took place at
       the Westchester – Loyola Branch Library in Los Ange-
les, conveniently located a short distance from LAX.
                                                                      Angeles is a massive jurisdiction of 498 square miles (vs. San
                                                                      Francisco’s 49 square miles), LA County contains 106 jurisdic-
                                                                      tions.

Our new president, Jon Jablonski, welcomed members and                GLAM: a new Southern California CMS activity
guests. Our first speaker, Ron Lockmann gave a talk entitled          (Greater Los Angeles Mappers)
Stereotypical Los Angeles: Three Centuries of Trying to               Nagin Cox explained GLAM’s activities as a group within the
Define the City and Region in Words and Maps, and pre-                California Map Society. GLAM was formed in Nov. 2018 and
sented a variety of maps, artwork images, and amusing/                is patterned after BAM (Bay Area Map Group). Meetings are
engaging historical quotations describing LA from past to the         held 2-3 times a year, typically in members’ homes, and people
present. He noted that our meeting location, Westchester,             bring maps and items of cartographic interest to share and dis-
has been called the Silicon Beach of California, with a con-          cuss. Guests are welcome. Members also contribute to the
centration of tech firms, many of which are located on the            Calafia Journal, suggest other events and activities of interest
former site of the Hughes Aircraft Company.                           and, tweet about CMS (@CalMaps) and GLAM (#GLAM).

                                                                      A festschrift on the occasion of CMS founder Norman J. W.
                                                                      Thrower’s 100th birthday.
                                                                      Judith Tyner, Ph.D., who enjoyed 60 years of his fellowship and
                                                                      support, gave a retrospective beginning with his birth on
                                                                      10/23/1919, in England. He attended art school, intending to
                                                                      be a commercial artist. However, he was conscripted to military
                                                                      service and was assigned to
                                                                      cartographic activities in
                                                                      Simla, India and in Burma.
                                                                      In 1947 he moved to work at
                                                                      the Geographical Institute in
                                                                      the Univ. of Northern VA.
                                                                      In 1943 he worked with Ar-
                                                                      thur Robinson in Madison,
Image courtesy of LAist (Southern California Public Radio) 11/13/16   WI, and did his Ph.D. disser-
                                                                      tation on cadastral mapping.
                                                                      Dr. Thrower then became
                                                                      involved in contemporary
                                                                      cartography. In 1963 he re-
                                                                      ceived a Guggenheim Fellow- Image courtesy of Cartograpghic
                                                                      ship related to the works of Perspectives.org
                                                                      Edmund Halley (of Halley’s
                                                                      Comet). He was the Director in 1981-87 of UCLA’s Clark
                                                                      Memorial Library, one of the most comprehensive rare book
                                                                      and manuscript libraries in the United States. Norman taught
                                                                      at UCLA for 33 years.

                                                                      Professor Tyner credited Dr. Thrower in guiding her to her
                                                                      long-time career in geography and cartography.

Image courtesy of Pinterest.com                                       Bill Warren pointed out that Norman was the first president of
                                                                      CMS. He noted that Norman was also president of a 1975

          Page 8                                   Calafia Journal                            Volume 2020, issue 1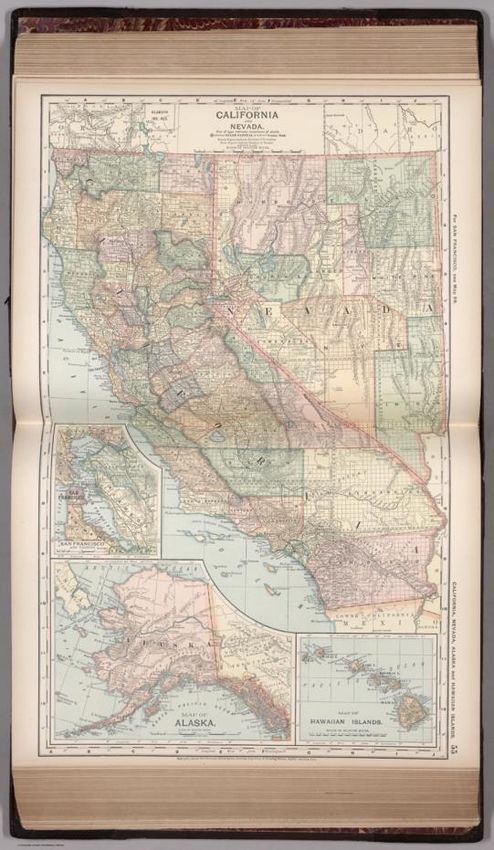
commission commemorating the 400th Anniversary of Sir
Francis Drake’s expedition and brought out a book on the
topic. Bill reminisced about other books, including Maps and
Civilization, titled initially Maps and Man.

Trish Caldwell, Ph.D., noted her early experience with the-
matic mapping at the CIA and her eventual move to UCLA
and her studies with Norman. There she realized more people
viewed maps on television news than in any other format, a
topic that led to her dissertation. In 1979, somewhat to her
surprise, Norman approved her dissertation on such map-
ping, while only changing five words in her work!

Julie Sweetkind-Singer appreciated his influence on her life.
After reading the acknowledgments in Maps and Civiliza-
tion, she observed references to UCLA map librarians. Real-
izing that map librarian was a potential career, she was in-
spired, and eventually reached her current role as Assistant
Director of Geospatial and Cartographic Services librarian at            Colton, G.W., Hawaiian Group or Sandwich Islands,
Stanford University.                                                     1856. Courtesy of davidrumsey.com

Fred DeJarlais met Norman in 2006 at a CMS in San Fran-           Mr. Lewis’s complete essay is reproduced elsewhere in this issue
cisco, assisting him in his presentation to our members. Fred     of Calafia.
was pleased to be able to use Dr. Thrower’s early work in pho-
togrammetry in a recently authored article for the Calafia        Redlining in Los Angeles, Carlos Baez, PhD candidate at UC
Journal.                                                          Santa Barbara.
                                                                  Carlos aimed to deconstruct maps to determine the factors in-
Video greetings were recorded to present to Norman.               volved in residential redlining.

Maps as Mirrors and Methods of Colonialism in Hawai`i             The genesis of redlining was that the 1934 Federal Home Loan
Student Essay Award winner: Geoffrey Oliver (“Oliver”) Lewis      Banking Board (FHLBB) wanted to standardize then-
Oliver, who grew up on Oahu, told us of Captain Cook’s            inconsistent methods for making home loans. They included
1778 landing and presented a 1785 map of European coloni-         Hoyt’s Chicago School of Sociology concept that race should
zation. Oliver explained that initially, land was not seen as a   be considered in valuing property, and that mixing of races will
commodity, but as something higher than humans.                   accelerate property value decline.

The earliest ca. 1785 maps used phonetic spelling that varied
in sound and spelling from currently adopted names. An
1856 J.W. Colton map established the current spelling and
even Hawaiian pronunciations. An 1891 D. Appleton map
used in Hawaiian schools showed Hawaii, then still inde-
pendent, together with Alaska and the western United
States, establishing a sense of it being related to the United
States.

Oahu maps revealed that in 1848, King Kamehameha estab-
lished the validity of land ownership. This changed tradition-
al concepts of the environment. Young native C.J. Lyons’
map of Oahu established ownership of many land tracts. By
1899, extensive non-Hawaii land ownership of Oahu was
mapped. Missionaries use of maps marginalized Hawaiians            Los Angeles Redlining Map, 1939. Image courtesy of KCET, Los An-
who held a non-ownership-based concept of land.                    geles.

     Volume 2020, issue 1                                   Calafia Journal                                         Page 9
Maps were color-coded to show desirability of areas.                Ruth Taylor White
                                                                    (1896-1985) – Stan-
Population criteria included data categories for nationality,       ford, NY Institute of
foreign family percentage, and negro.                               Art and Design. White
                                                                    coined     the   term
Where We Are: Westchester is not a Blank Place                      “cartograph” for her
Jon Jablonski, University of California Santa Barbara.              map style. She often
Jon used a series of GoogleEarth and other historical aerial
photos to show changes to the Westchester area since the            Stanford’s Geographical
1920s.                                                              Establishment, Sutro Tun-
                                                                    nel And The Comstock
                                                                    Lode, 1873. Image courtesy
Mapping the Comstock Lode, Julie Sweetkind-Singer, Stan-
                                                                    of davidrumsey.com
ford University
Julie used interactive Stanford library-resourced maps and          used a cartoonish format. However, people, especially African-
photographs to describe the Comstock silver mine and Vir-           Americans, were often stereotyped unflatteringly.
ginia City/Gold Hill and discussed the mine’s boom-and-bust
history.                                                            Louise Jefferson (1908-2002). Jefferson attended Columbia
                                                                    University. An African-American, her most famous work, was a
She included a historic infographic (right) with a cross-section    U.S. map, “Americans of Negro Lineage” (1946). People on her
view of the mines and claims and the proposed Sutro Tunnel,         maps were not stereotyped. A 1944 map, “Indians of the
as well as other claim maps.                                        U.S.A.,” positioned representative people by location.

Three Women Pictorial Cartographers:                                Alva Scott (1902-1993). Some references to her appear with
A Study in Contrasts, Judith Tyner, Ph.D.                           last names of her two husbands (Mitchell, Garfield), making
Judith has been working with maps made by women for the             identification of her work challenging. Her maps were basically
past 20 years. She remarked that the topic of women in car-         tourist maps, with more focus on points of interest than on
tography has been largely ignored until recently, as has pictori-   people. She sometimes incorporated a sly sense of humor (see
al maps.                                                            insert on the Salem map).

1920 through 1960 was perhaps the golden age of pictorial           President Jablonski closed the day with a brief member’s meet-
maps, and many of the most visually attractive and informa-         ing. Our Treasurer, John Fleming, who that the Society’s finan-
                                                                    cial position remains strong, and Fred DeJarlais, VP, Member-
                                                                    ship, reported that membership growth has been robust, with a
                                                                    12% one-year increase and a 33% increase since 2017. Fred, as

Recent Google Earth image of the Westchester area.
tive were produced by women. Many women worked as part
of a team or in government agencies, so they may be hard to
identify. The majority had their training in art. Each woman’s      White, Ruth Taylor, Plate from “U.S.A. A Gay Geography”, 1935.
profile , below, had a distinctive style.                           Image courtesy of Old World Auctions.

        Page 10                                      Calafia Journal                         Volume 2020, issue 1
Calafia publisher, reflected that the expanded journal has
been warmly received by CMS members, with strong interest
My Favorite Map
from contributors. With production costs increasing, he will Leonard Rothman, M.D.
A
be seeking additional advertisers for forthcoming issues.
s a map collector, my focus has been maps of the Holy
Land. In my wanderings through libraries, collections,
and map dealers in search of maps of the Holy Land, I came
across a map in an atlas that was like no other I had ever seen.
Intrigued, I read the accompanying description, immediately
purchased it, and added it to my collection.
This fascinating map was
designed by Edward Quin
(1794-1828), and engraved
by Sidney Hall. It was pub-
lished in London in 1836
by E.B. Seeley and W.B.
Burnside, in their second
edition of Quin’s “An His-
torical Atlas: In a Series of
Maps of the World as
Jefferson, Louise. “Americans of Negro Lineage”, 1946. Image cour-
Known at Different Peri-
tesy of othercartographies.com
ods.” I have chosen this
map as my favorite both
because it is a very rare and unusual cartographic presentation
of the Holy Land and biblical events, and because it also rep-
resents an unusual view of space as a completely black void
which shrinks over time.
The title of the map, B.C. 2348. The Deluge, is based upon the
determination by James Ussher (1581-1686), the Archbishop
of Armagh, that the creation of the world occurred on Sun-
day, October 23rd, 4004 BCE, and that the biblical flood oc-
curred much later, specifically on May 5th, 2348 BCE.
The map is meant to serve as an illustration of the story of
Noah, in the book of Genesis. In this well-known story, God
has decided to destroy all of the inhabitants of the world be-
cause of their wickedness. However, because of their exempla-
Garfield, Alva Scott. “A Scott-Map of Salem Massachusetts,” 1960. ry behavior, God has determined that Noah and his wife,
Image courtesy of davidrumsey.com their three sons, Ham, Japhet, and Shem, together with their
wives, should be saved, along with two of every other living
The CMS Spring meeting is scheduled for Saturday, April creature. Noah is commanded to build a large wooden ship,
13th, at the Rumsey Map Center at Stanford University – which we know as the Ark, which will serve as a refuge for
please read about plans for this meeting in this issue, and plan them during the Deluge.
to attend.
The map itself shows the world as it was assumed to look at
Fred DeJarlais
the time of the Deluge. It is approximately 9 3/4 inches high
and Walter Schwartz
x10 3/4 inches long (105 square inches) and is almost com-
pletely black. The only light appears in the lower-left quad-
rant, which contains just a 5.1 square inch circle of what ap-
pears to possibly be clouds, which progressively lighten to gray
Volume 2020, issue 1 Calafia Journal Page 11and then to white as they move toward the center of the cir-
cle. The small center, an inset map of Eden, is yellow, possibly
representing bright daylight. Thus, in this map, both the bibli-
cal concept of darkness turning into light with Creation, and
the vastness and darkness of the surrounding space are well
portrayed. Interestingly, no stars, which, according to Gene-
sis, were created on the fourth day, are represented in the
darkness on this map. Genesis does not mention the Garden
of Eden at all until after the 7th day, so that the stars, created
well before, should logically been included on the map as well.
Located at the center of the yellow inset, the garden of Eden
is shown with its four rivers: the Euphrates, the Tigris (here
noted as the Hiddekel), the Pishon, and the Gaon. Mount
Ararat, purportedly the landing place of Noah’s Ark, is also
noted. Cain was exiled to the Land of Nod (Hebrew, to wan-
der), and Enoch, also on the map, was named after his first
son by his wife. Ethiopia and Cush (currently southern Ethio-
pia) are also noted. This is the area where the Ark of the Cov-
enant, the other biblical Ark, noted in the Book of Exodus, is
said to reside. According to Ethiopian biblical history, the
Ark of the Covenant was taken to Aksum, Ethiopia, from
King Solomon’s Temple in Jerusalem by Melenik I, the first
Emperor of Ethiopia, the son of Solomon and the Ethiopian
Queen of Sheba.
This diachronic, narrative map, which includes multiple
events at different epochs in biblical history, is the first map in
Quin’s atlas, and then the maps in the atlas move forward in
time until 1828, just prior to the 1836 year of the atlas’ publi-
cation. Pivotal events during different periods are presented
through the series of 21 maps and accompanying descrip-
tions. As the known world enlarges, the events included occur
in different parts of the world. Although the overall size of
each map remains the same, the areas of darkness recede, and
the detailed areas of the insets become larger over time, pre-
senting an interesting but very unrealistic view of the earth/
space relationship. Finally, the last three world maps, which
are also twice as large as the preceding 18, have no dark area.
An entire first edition of this atlas can be viewed on Stanford
University Library’s Searchworks website.
Perusing the New York Times in December 24th, 2019, as I
was preparing this article, I was immediately struck by an arti-
cle entitled “We Stared Into the Void. It Stared Back”, by
Michael Roston, which included an image of a black hole
from the center of the Messier 87 galaxy (online version:
“What we Learned in Space …”). While it is noted that it is a
“false-color” image, it is striking to see its similarity to Quin’s!
The small “black hole” at the center is surrounded by a larger
yellow-orange circle. It is placed off-center in the image—and
it is surrounded by a completely black void Images above of the Deluge—Progressive enlagements
Page 12 Calafia Journal Volume 2020, issue 1CARTO-QUIZ
Name the Planet or Moon!
(Extra credit: moon around which
planet?)
1551—The Death of Charles V
1783—Independence of the United States
Bibliography
1 Craig, G.Y. & Jones, E.J. (1982) A Geographic Miscellany,
Princeton: Princeton University Press.
2 “Kebra Negast,” Ethiopian manuscript of the 14th centu-
ry CE. based on manuscripts of the 2nd-4th century, vali-
dating the history of the Solomon-Sheba-Melenik Dynas-
ty.
3 Quin, E. (1830) An Historic Atlas containing Maps of the
World at 21 Different Periods, 1st Edition, Searchworks
website, Rumsey Map Center, Stanford University Li
braries.
4 Quin, Edward (1836) An Historic Atlas containing Maps
of the World at 21 Different Periods, 2nd Edition, Lon-
don: Seeley, & Burnside Publishers.
5 Roston, M. “We Stared into the Void. It Stared Back”
N.Y. Times, 12/24/2019, p. D1.
6 Sarna, N.M. (1989) Torah Commentary, Volumes 1 and 2
Philadelphia, PA: The Jewish Publication Society.
7 The Holy Bible, King James Version, The 1611 the author-
ized version (2010) Oxford, U.K.: Oxford University.
Volume 2020, issue 1 Calafia Journal Page 13Wally also created software to analyze alloys with analytical
MEET OUR MEMBER instruments, and in 1977 moved to Idaho, where the US De-
Wally Jansen partment of Energy had a number of nuclear power plants
upon which experiments were being run to ensure their safety
T he seeds for Wally's life of travels and interest in map-
ping were planted before he was born. His father built
oil refineries for Royal Dutch Shell in various parts of the
and reliability. He introduced computer automation to a mi-
croprobe at the site and was able to draw maps showing the
migration of elements at alloy boundaries. After 3 years of en-
world, while his mother, accompanying him, made maps of during the harsh Idaho climate, he moved to the West Coast
their travels by land, sea, and air, which she shared with her to join Perkin Elmer, an analytical instrument manufacturer,
children. Wally was born in Liverpool, England, grew up in where, using a scanning Auger microprobe, he applied surface
Asia and Europe, and attended a Swiss boarding high school analysis instruments to the hi-tech industry.
before following his educational dream of studying geology,
and enrolling at the Colorado School of Mines. During his Wally then left Perkin Elmer to join Surface Science Labs, de-
time there, in the 1960s, continental drift was still being ar- signing hardware and writing software for them and then
gued, and he made the decision to change majors: geologists, moved on to a company that had a project involving the dis-
he says, are focused on "looking back." He wanted to "look play of satellite data on computer screens. He developed soft-
forward" and changed his major to chemistry. ware for this project, creating maps both on screens and as
hard copies. He eventually started his
These were also the early years of comput- own company, which developed image
ers, and Wally quickly became interested in processing software that could use spec-
using computers and his knowledge of troscopic and time-domain data collect-
chemistry to track the movements of elec- ed by satellites or aircraft to find miner-
trons around the nuclei of atoms by pro- als, observe and monitor vegetation, and
ducing contours of iso-probability surfaces. perform multiple other environmental
There were no computer screens to draw applications. Wally even created a video
on when he began this work, so he used a demonstrating how vegetation changed
plotter. His first degree was a Bachelor of seasonally around the world over time!
Science in Mineral-Engineering Chemistry, Wally marketed his programs world-
followed by a Masters in Mineral Econom- wide.
ics. He was then asked to automate a scan-
ning electron microprobe, and this became An interest in cartography began during
the birth of Wally's map-making. He creat- his student days at the Colorado School
ed maps showing the distribution of elements in microscopic of Mines. At a bookstore in Denver, Wally had purchased his
metallurgical and geological samples. He graduated from the first old leather-bound books, a two-volume set of Virgil's epic
School of Mines with his new discoveries and a Ph.D. in Ap- poems, the Bucolics, the Aeneid, and the Georgics, printed in
plied Chemistry, with a dissertation entitled "Quantitative 1717. A bookshop in Boulder had supplied a 1536 Parisian
Elemental Mapping Using the Scanning Electron Micro- Book of Hours and a complete 1598 Venetian Ptolemaic atlas
probe." by Magini, which contained 26 ancient maps as well as 36
"new" 16th century maps. In these early days of collecting, he
While in graduate school, Wally worked for a surveyor who had also purchased two of Ortelius' maps of the Netherlands,
was designing residential subdivisions near ski resorts in the as well as a map of the Holy Land. Wally has always been very
mountains. He had learned surveying while in school and be- careful about the maps he collects: the bookseller who sold
gan to design custom software to facilitate surveying and gen- him the Virgil books had told him that he had removed the
erating maps. Wally also shared some fascinating information maps they had contained, in order to sell them independently
that was new to this interviewer: that surveyors had actually for a high price, leaving the books of poems with no maps, and
mapped the entire United States into rectangular grids, using greatly reduced values. Wally was very much affected by hear-
baselines that run due east and West, and principal meridians ing of this practice and decided then that he would not collect
that run north and south. Locally, these perpendicular lines maps or engravings that had been removed from books, a posi-
are often used to define state borders, the location of roads tion from which he has never strayed.
and highways, and large-scale property boundaries. For exam-
ple, a "baseline" from the Mississippi River to the West sepa- Wally is married to Linda and they have three children: Alex-
rates Nebraska and Kansas, and is straddled further West by ander, who is married, recently had a son, and works for Ap-
Baseline Road in Boulder Colorado. Six-by-six mile plied Materials in the Bay area, Nanneke, who loves maps and
"townships" are measured north and south from the baselines, is a life member of the CMS, and Christina, who works in the
and contain 36 “sections,” each section a mile square. field of politics in Washington, D.C.
Page 14 Calafia Journal Volume 2020, issue 1to recover, or to adapt, to a major change that has caused
Apps for Maps stress, disorientation, a sense of helplessness or defeat, and an
inability to cope. Resilience enables a person to function,
Resiliency Maps: often better and with greater capacity than before the disaster
Mapping for Emergencies occurred. It is an important quality each of us can cultivate,
Nicole Martinelli and is essential for effectively surviving disasters of all kinds.
A nyone who has lived through a major disaster knows
that during the first few days afterward, instead of using
your smartphone as an extension of your brain, you’ll proba-
The concept of resilience has never been more important or
more urgent than it is now. In 2018, 315 disaster events killed
more than 11,804 people, affected over 68 million people, and
bly have to rely on a personal mental map, which “knows” tallied $131.7 billion in economic losses worldwide, according
potential resources and hazards nearby. Where’s the closest to the Centre for Research on the Epidemiology of Disasters
hospital with disaster care? What about shelters? Gas sta- (CRED). Climate change, weak governance, and an increas-
tions? And how many soft-story buildings — with their pro- ing concentration of people and assets in areas exposed to
pensity to collapse — will you have to zig-zag around to get hazards are driving disaster risks upwards, according to the
there? United Nations Development Programme. The ability to
adapt, act, and spring back is essential, and knowing an area’s
Trying to answer these questions for myself after moving to resources and dangers prior to an emergency can help save
San Francisco’s rapidly changing South of Market (SOMA) lives, as well as reduce injuries and property damage.
neighborhood was the reason I started the Resiliency Map
Project. The Project’s goal is to store information about assets, Getting prepped
resources, and hazards in a given geographical area on a map Like many Cali-
that can easily be printed out, and kept where needed for fornians, you
emergencies. probably already
have an emergen-
At first glance, a Resiliency Map looks like any standard map cy kit. (If not, get
– with streets, buildings, bridges and tunnels, some natural started with the
features, etc. However, a Resiliency Map also features emer- link below!) Per-
gency-related information, such as medical facilities, fire hy- haps, like me,
drants, cisterns, shelters, construction sites, community meet- you’ve also taken
ing places, car repair shops, groceries, and other emergency a course in Com- Emergency Response training session
information. These can be essential in enabling navigation munity Emergen-
through an area after disaster strikes. Resiliency Maps can also cy Response Training (CERT) or NERT, Neighborhood
be used after a disaster to track damage. Emergency Response Training. In addition to basic triage and
safety, these programs also teach you to look at your sur-
roundings carefully, from identifying unreinforced masonry
buildings, to spotting which hydrants carry potable water, and
stress the value of including a map as part of your 72-hour
emergency kit. But what kind of map has CERT or NERT
information, essential in emergencies, on it?
Confession: before moving to the SOMA, my emergency kit
contained a crumpled paper tourist-board map. That’s better
than nothing, but is of little help in negotiating, for example, a
safe route to a specific gathering point, which isn’t even pictu-
red on the map.
Map produced using QGIS, a free, open-source cross-platform desktop
geographic system. The wide world of Open Source
Good ideas tend to get around. Before I began the Resiliency
The bounce back Maps Project, a number of people had already sketched out
Resilience is essential to life, never more so than in a time of these kinds of maps using various tools, ranging from pen and
emergency. It can be defined as the ability to “bounce back” – paper to Apple and Google maps. In using these maps, prob-
Volume 2020, issue 1 Calafia Journal Page 15lems quickly arose. For starters, tools from these companies
rarely helped map more than one neighborhood at a time. A
group of motivated volunteers would make a big push to
map their surroundings, and then? One neighborhood
mapped, and no more. And, crucially, because of the pay-to-
play nature of the tools themselves, the groups who had cre-
ated these resources sometimes found themselves without
access to their own work, which had often been years in the
making, once the companies started charging for access.
The Resiliency Map Project contributes to, and is powered
by OpenStreetMap, an editable map of the world, supported
by the not-for-profit OpenStreetMap Foundation. Often
called the “Wikipedia of Maps,” anyone can contribute to
OpenStreetMap, and the community offers a number of NERT Mapathon field paper
tools to assist users in creating accurate and useful maps.
Preparedness is a shared responsibility. Using Open-
StreetMap, Resiliency Maps can be added to, or edited by,
people across an entire city to provide information specific
to where they live, work, or go to school. The crowdsourced
nature of the project means that a stable group of technical
administrators, or a single group of committed volunteers,
isn’t required for development or maintenance. The entire
toolkit for the project is open source, ensuring that the maps
produced will be available to anyone who wants to use them,
and never subject to the bottom line of a for-profit compa-
ny.
Mapping it out
The Resiliency Map Project is just getting started, but a few
milestones have already been achieved. In addition to my NERT Mapathon field paper
presentation of the project at the OpenStreetMap’s State of
the Map Conference, and my participation in the Forum on The ideal Resiliency Map Project volunteer is interested in
Disaster Risk Reduction (EFDRR), about 50 people have resilience preparation, and sees the need for maps as an essen-
contributed to the project through volunteering for tial tool. That’s it. There are a ton of tools and ways that peo-
“Mapathons”. ple can contribute — pen and paper, apps, and code are just
three of these.
The first Resiliency Map Mapathon in
California was a two-hour session with
NERT (San Francisco’s version of
CERT), using Field Papers for map-
ping. Field Papers is an excellent way to
get a group mapping with Open-
StreetMap, without requiring a lot of
computer time. An area to map is select-
ed, and copies of a map of the area are
Resiliency Map coverage dis- printed out. Group members walk
played in OpenStreetMap (South around their area with the paper copies,
of Market Area, San Francisco
continued at RESILIENCY, page 23
Page 16 Calafia Journal Volume 2020, issue 1Mapping Asteroids
By Juliet Rothman
D r. Ed Lu, an astronaut for 12 years, and currently the
Director of the Asteroid Institute, was the guest
speaker at the Rumsey Map Library on December 6th. His
presentation, Charting the High Frontier of Space, explored
the process of mapping asteroids and some of the challenges
and possibilities of engaging in this process.
Dr. Lu noted that mapping has always accompanied the
opening of new frontiers, in global exploration, in the scienc-
Mapped orbits of selected asteroids
es, and in technology. Space, he believes, is the next frontier,
providing opportunity for the development of science, com-
merce, and defense. The space economy is currently $350 an enormous number, all in motion, all affected by various fac-
billion and is growing at a rate that is 5% faster than the glob- tors. The earth also moves, at an approximate speed of 70,000
al economy. If trends continue, the space economy will be miles per hour. It is essential that maps be able to reflect where
larger than that of the earth by the end of the century. The things are presently, and where they will be at a designated fu-
actual costs of space launches are decreasing, as are the costs ture time.
of building spacecraft.
Another important aspect of mapping asteroids to consider is
commercial. Sudbury, Canada is the location of one of the larg-
est asteroids to hit earth. The asteroid was composed of iron
and nickel, and is the site of one of the world’s largest mines.
Asteroids which can be used commercially necessitate resource
mapping, similar to our processes for mining claims. Commer-
cial use of asteroids involves investment in infrastructure as
well, but companies will be unwilling to make these invest-
ments without guarantees that their claim will be respected. Dr.
Lu suggested that there was a need for the development of digi-
tal claims maps of asteroids.
Another important element is fear. Asteroids can hit earth and
cause a great deal of damage from explosive energy. Mapping
asteroids in four dimensions can provide advance information
Dr. Lu’s animated video of orbiting asteroids
of asteroid strikes, so that they can be deflected and their trajec-
tory altered. The technology currently exists—but cannot be
Maps of the heavens are not new: they have been found on deployed at the last minute: advance planning is required, and
cave walls and ancient artifacts. There are star charts that are this can be achieved with asteroid mapping.
thousands of years old. Mapping the space frontier today is
necessary—and the mapping of smaller space objects such as Mapping asteroids requires calculation of orbits, addressing
asteroids is very important. Dr. Lu outlined some important gravity and corrections to gravity, as well as the effects of rota-
factors to consider in developing these maps. tion. This can be done for single asteroids today, Dr. Lu says—
but can it be done for millions of them? This is challenging, but
Mapping space and all of the objects in space is an essential he believes that it is beginning to be possible. A “map” is cur-
component of scientific study, as well as serving our innate rently being built – but a “map” of asteroids is really more than
curiosity. Previous maps, in two or three dimensions, howev- a map: it is a “service” which is requires continuous observa-
er, have been static. While these have been useful, it is essen- tions and updating. It alters the definition of “maps”—as ser-
tial to note that that the solar system is NOT static: it is in vices rather than as artifacts.
motion. This necessitates mapping in four dimensions plus
one—TIME. Images of the asteroids in the solar system show
Volume 2020, issue 1 Calafia Journal Page 17Four Hundred Years of Mapping and Naming the Moon
Robert A. Garfinkle, fras
F or centuries humankind has endeavored to create maps
and charts to display the local environment, town,
country, empire, and/or the then-known world. We also love
his landmark book Sidereus nuncius (1610), but he did not
name any of the features. During the next couple of centuries,
additional observers made rough sketches of the
to give names to almost everything shown on Moon that were published and re-published in
the maps. In the case of our nearest celestial several books and encyclopedias. Most of these
neighbor, the earliest extant naturalistic draw- maps also did not
ings may be the image of the waning gibbous contain feature
Moon in the background of Dutch master Jan names.
van Eyck's (c. 1385–1441) c. 1420–30 painting
of the Crucifixion, (Fig. 1), and Leonardo da In 1644, Michael
Vinci (1452–1519)'s sketches in his 16th- Florent van
century notebooks (Fig. 2). Both of these rough Langren [a.k.a.
drawings did not include any names for the Langrenus (1600–
surface features. Refer to Volume 2019, Issue 2 75)] created a
of this journal, for a discussion on da Vinci's manuscript lunar
terrestrial mapping works. map, on which he
placed names for many of the features. The next
The detailed mapping and naming of lunar fea- year he published a revised map, which became
tures commenced sometime shortly before the the basis for our modern lunar nomenclature
year 1603, when British doctor William Gil- (Fig. 6, next page). He used a mixture of personal
bert of Colchester (1544–1603) drew a map of and place names. A few of Langrenus' names
the Moon, and for the first time placed names have continued to be used, but only three of
on the lunar features he was able to see without them, Pythagoras, Endymion, and his own,
the aide of an optical instrument (Fig. 3, next Langrenus, remain as names for the craters where
page). None of Gilbert's names survive as part he applied them.
of our current lunar nomenclature. Unlike later
lunar cartographers, Gilbert considered the Johan Höwelcke, [a.k.a. Johannes Hevelius, Jo-
dark areas to be land, and the highlands to be hann Hewel, or Johann Hewlecke (1611–87)]
bodies of water (Latin: mare; plural maria). was a brewer in Danzig, Poland. He built an ob-
Gilbert was also a physician to Queen Eliza- Fig. 1 servatory on the roof of his home, and, in 1647,
beth I (1533–1603). published Selenographia: Sive, Lunæ Descriptio.
He was the first to show the areas of the Moon
With the invention of the telescope in 1608, that are visible only during librations in longi-
the effort to create maps of the Moon grew in tude and latitude. Hevelius included a nomencla-
both possibility and importance. In the follow- ture completely different from that of Langrenus,
ing year, British scientist Thomas Harriot using only names of terrestrial features (Fig. 7,
(1560–1621) appears to have been the first to next page).
aim a telescope at the Moon and draw charts of
what he observed (Fig. 4, next page). He did The Italian Jesuit astronomer and selenographer
not include any names on his drawings, but in Giovanni Battista Riccioli [a.k.a. Ioanne Baptista
July 1611 he made a map of the full moon and Ricciolo, or Gaimbasttia Riccioli (1598–1671)]
numbered 49 features (Fig. 5, next page). Un- published his 2-volume work Almagestum novum
fortunately, the record of what the numbers in 1651. He named over 400 nearside features on
represented is lost, and his lunar drawings Fig. 2 a detailed drawing of the full moon made by his
themselves were not published until 1965. friend Francisco Maria Grimaldi (1618–63)
(Figure 8). Most of Riccioli's names remain where he applied
Italian scientist and teacher Galileo Galilei (1564–1642) them. In following the Roman Church's geocentric theory of
observed the Moon and published his first renditions of it in the Universe, Riccioli fervently opposed the Copernican helio-
Page 18 Calafia Journal Volume 2020, issue 1Fig. 3 William Gilbert of Colchester map of the Moon
Fig. 6 'Langrenus' manuscript lunar map
Fig. 4 Thomas Harriot Moon chart
Fig. 7 Johan Höwelcke, from Selenographia:
Sive, Lunæ Descriptio
Fig. 5 Thomas Harriot Moon chart with 49 features Fig. 8 Giovanni Battista Riccioli, 400 lunar features
Volume 2020, issue 1 Calafia Journal Page 19centric theory in his books, yet, interestingly, he named the
most prominent lunar crater for Mikolaj Kopernik [a.k.a. Ni-
colaus Copernicus (1473–1543)]! He named the white albe-
do patch, which is now known as Reiner gamma, for Galileo,
and wrote that he was flinging the heretic and his heliocentric
ideas into Oceanus Procellarum, where they hoped that they
would drown. At that time, astronomers still thought that the
dark areas on the lunar surface were bodies of water (mare).
In 1791, the German selenographer Johann Hieronymus
Schröter (1745–1816) published the first volume of his two-
volume set, entitled Selenotopographische Fragmente sur
genauern Kenntniss der Mondfläche. The second volume, pub-
lished in 1802, contains the earliest detailed descriptions and
drawings of lunar features (Fig. 9). He intended to produce a Fig. 10
full map of the Moon, but the war with France ended that
project when Napoleon's soldiers destroyed Schröter's obser-
vatory and papers, and then dismantled his telescope thinking
that the brass parts were made of gold.
The German cartographer Wilhelm Gotthelf Lohrmann
(1796–1840) planned to pro-
duce a complete map of the full
moon, but was able to complete
and publish only 4 of his
planned 25 sections, in 1824,
before his eyesight failed (Fig.
10). The balance of his charts
was completed and published in
1878, in a portfolio by the Ger- Fig. 11
man-born Greek astronomer
Johann Friedrich Julius
Schmidt, [a.k.a. Schmidt of
Athens (1825–84)]. Also, in
1878, Schmidt published his
own portfolio set of 25 charts
(Fig. 11) that Included a com-
panion book, Erläuterungsband
("Explanatory Volume"), which
gives detailed information on
about 33,000 lunar nearside
features. Fig. 9
Fig. 12
The most influential lunar map of the full moon in the 19th 13), followed in 1931 with his self-published book, The Moon:
century, Mappa Selenographica (Fig. 12), was published in 4 With a Description of Its Surface Formations. Goodacre served as
sections between 1834–36 by German banker Wilhelm Beer the Director of the British Astronomical Association's (BAA)
(1797–1850) and astronomer Johann Heinrich Mädler (1794 Lunar Section for over 40 years.
–1874). In addition, they also published their 412-page de-
scriptive lunar guidebook Der Mond in 1837. Chaos ruled the lunar nomenclature list during the 18th and
19th centuries, as each lunar map maker applied his own set of
In 1910, British selenographer Walter Goodacre (1856– names to lunar features. In far too many cases, different names
1938) published his orthographic lunar map portfolio (Fig.
Page 20 Calafia Journal Volume 2020, issue 1four versions of full moon
lunar maps of varying di-
ameters, with the last one
measuring 300 inches (7.2
m) across (Figures 15 and
16). Wilkins added 107
new names on his maps, of
which the IAU adopted
only a few as official names.
He also crowded his charts
with a jumble of non-
existent features and misa-
ligned lines of orthographic
coordinates, which made
Fig. 13 them very challenging to
use. His charts were the last
amateur lunar maps to use
the orthographic coordi-
nate system.
Fig. 15
During the early years of
the Space Age (1960s and
70s,) the National Aero-
nautical and Space Admin-
istration (NASA) had a
series of paper maps of the
moon, which used seleno-
graphic latitude and longi-
tude coordinates, and were
produced based on the im-
ages taken of the lunar sur-
Fig. 16
Fig. 14
were used for the same feature, or a specific name was used
for two or more different features. One of the reasons for the
formation of the International Astronomical Union (IAU),
in 1919, was to create a unified, official, lunar nomenclature
list and lunar charts. In 1932, the IAU adopted a list of
names, and three years later published the list and charts in 2
volumes entitled Named Lunar Formations (Fig. 14). All
names to be added to that original official list must first be
approved by the General Assembly of the IAU.
From 1924 until shortly before his death in 1960, British Fig. 17
selenographer Hugh Percy Wilkins (1896–1960) produced
Volume 2020, issue 1 Calafia Journal Page 21seded the Orbiter paper editions. Figure 18 is the Index Map
for the electronic version of the lunar maps, and Figure 19 is
LAC chart 97 of this series. These electronic maps are at the
United States Geological Survey (USGS) in Flagstaff, and their
website may be accessed at: https://planetarynames.wr.usgs.gov.
The Flagstaff office maintains the database for the IAU's Solar
System "Gazetteer of Planetary Nomenclature." The LRO imag-
es were also put together as a mosaic of the entire lunar globe,
and are included in the Google Earth Pro program. Google
Earth includes Google Mars and the celestial sphere (https://
www.google.com/earth/).
From the first crude, hand-drawn attempts to map the Moon,
approximately 400 years ago, we have arrived at a digital tech-
nology level where we can now study even small features [less
Fig. 18 than 1 mile (1.6 km) in diameter], including the Apollo and
Luna landing sites that had been generally unobservable, either
live through telescopes or photographically in years past.
References
Beer, Wilhelm and Johann Heinrich Mädler (1834–36) Mappa
Selenographica. Berlin: Simon Schropp and Company.
———. (1837) Der Mond. Berlin: Verlag von Simon Schropp
and Company.
Blagg, Mary A. and Karl Müller (1935) Named Lunar For-
mations: Volume I, Catalogue. London: Percy Lund, Hum-
phries and Company.
Blagg, Mary, Karl Müller, and William Henry Westley (1935)
Named Lunar Formations: Volume II, Maps. London: Percy
Lund, Humphries and Company.
Galilei, Galileo (1989) Sidereus Nuncius or the Sidereal Messen-
Fig. 19 ger. Trans. Albert Van Helden. Chicago: Chicago Univ. Press.
Gilbert, William (1651) De Mundo nostro Sublunari Philoso-
face by the Lunar Orbiter spacecraft. Figure 17 (prior page) is phia Nova. Amsterdam: Apud Ludovicum Elzevirium. Facsimi-
the Index Map for these paper Lunar Astronautical/ Aero- le reprint by Menno Hertzberger and Company, c. 1951.
nautical Chart (LAC) maps, which were used in planning Goodacre, Walter (1910) A Map of the Moon in XXV Sections.
operations for the Apollo landings. These maps were simply London: W. Goodacre.
artists' renderings of the Orbiter photographs and contained
numerous inaccuracies. Maps were planned for lunar limb ———. (1931) The Moon: With a Description of Its Surface
areas, the edges of the Moon's disk as seen from Earth, but Formations. Bournemouth, England: Printed for the Author by
were never produced.. The Orbiters also failed to photograph Pardy and Son.
a large area of the Moon's south polar region.
Hevelius, Johannes (1647) Selenographia: Sive, Lunæ Descriptio.
On June 18, 2009, NASA launched the Lunar Reconnais- Edited by H. von Lambrech. Leipzig, GDR: Edition Leipzig,
sance Orbiter (LRO) to digitally image the entire lunar sur- 1967. A facsimile copy of the original Gedani Latin edition.
face from its polar orbit. The LRO is still in orbit around the Lohrmann, Wilhelm Gotthelf (1824) Topographie Der Sicht-
Moon. In 2012, the set of electronic maps of the entire lunar baren Mondoberflaeche: Erste Abtheilung Mit Vi Kuppertafeln.
globe, based on the LRO images were released, which super- Leipzig: Johann Friedrich Hartknoch.
Page 22 Calafia Journal Volume 2020, issue 1You can also read