CALIFORNIA'S - The American Society of Civil Engineers CALIFORNIA'S SURFACE TRANSPORTATION REPORT CARD An analysis of roads, bridges, and transit ...
←
→
Page content transcription
If your browser does not render page correctly, please read the page content below
REPORT CARD FOR
CALIFORNIA’S
    INFRASTRUCTURE

           2018

The American Society of Civil Engineers
CALIFORNIA’S SURFACE TRANSPORTATION REPORT CARD
An analysis of roads, bridges, and transit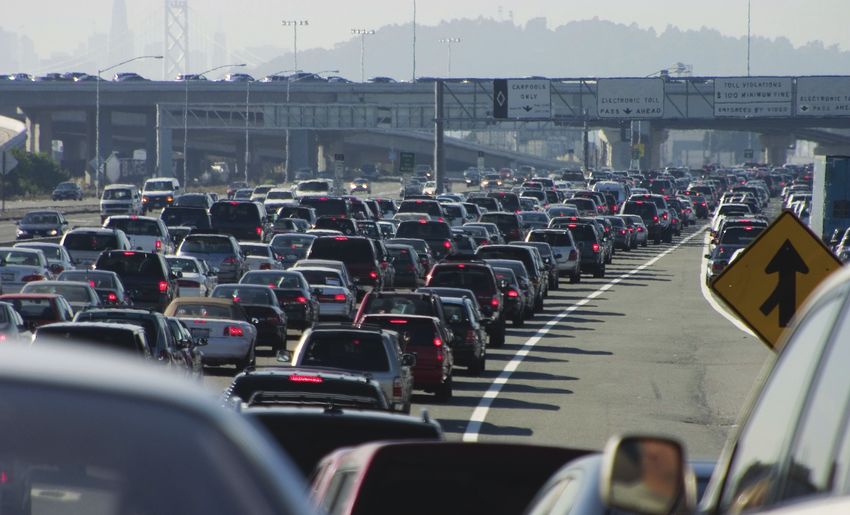
REPORT CARD FOR
               CALIFORNIA’S
                  INFRASTRUCTURE

                       2018

2018 CALIFORNIA INFRASTRUCTURE REPORT CARD—PAGE 2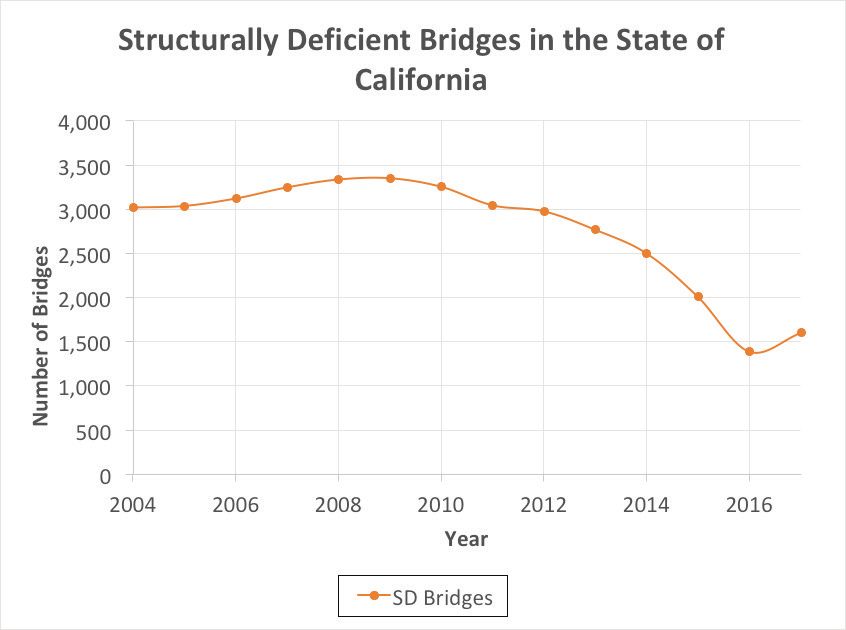
REPORT CARD FOR
                                        CALIFORNIA’S
                                            INFRASTRUCTURE

                                                  2018

                               REPORT CARD FOR
                      CALIFORNIA’S
                                INFRASTRUCTURE

                                                  2018

OUR GOAL
ASCE Region 9 represents over 19,000 civil engineer members within the state of California.
The Report Card is released as a public service to citizens and policymakers to inform them of
the infrastructure needs in their community. Because voters have the opportunity to protect
road, bridge, and transit funding in the 2018 election by voting “No” on Proposition 6, this
subset of the California Report Card is being released early to inform citizens before they
head to the polls. This Report Card is an October 2018 assessment and grade of California’s
transportation network.

PREPARED BY: ASCE   Region 9
    reportcard@asce.org
    www.infrastructurereportcard.org/california

                        2018 CALIFORNIA INFRASTRUCTURE REPORT CARD—PAGE 1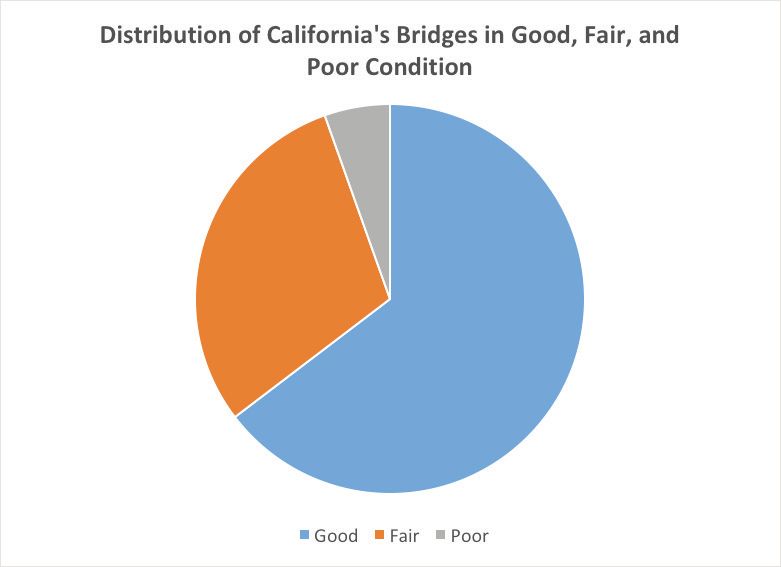
REPORT CARD FOR
CALIFORNIA’S
INFRASTRUCTURE
2018
EXECUTIVE SUMMARY
In November, California voters will have the choice to preserve a critical revenue stream needed to
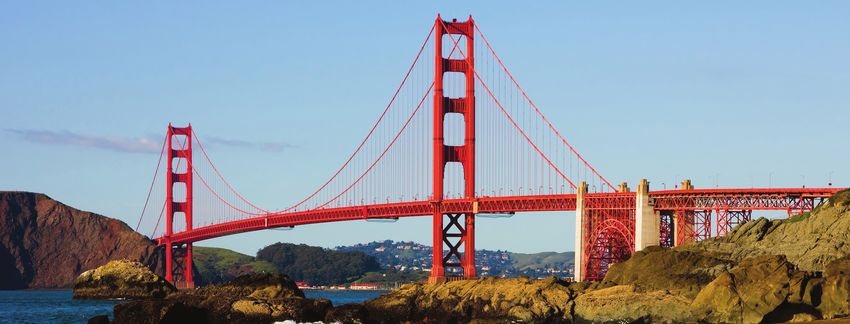
improve the state’s aging and over-burdened infrastructure. The state is known for its iconic bridges
like the Golden Gate Bridge, and roadways like the Pacific Coast Highway. Our ports are a gateway
for the country, carrying freight from the west coast to the rest of America. But California is also
known for crippling traffic congestion on its highways like the U.S. Route 101 and Interstate 405,
and potholes on neighborhood streets have become as common to see as blue skies and palm trees.
In 2017, Senate Bill 1 (SB 1), also known as The Road and Repair Accountability Act, sought to
reverse this trajectory of underinvestment in our transportation infrastructure by generating
an additional $5.4 billion a year, when fully implemented, dedicated solely to transportation
funding. As this funding went into effect, projects that improve safety, repair bridges, relieve
congestion, and increase transit offerings started moving and are already improving the safety
and reliability of our infrastructure. To continue making progress, we must preserve this critical
revenue stream by voting “No” on Proposition 6 in November 2018.
2018 CALIFORNIA INFRASTRUCTURE REPORT CARD—PAGE 2REPORT CARD FOR
CALIFORNIA’S
INFRASTRUCTURE
2018
BRIDGES GRADE: C-
WHAT YOU SHOULD KNOW ABOUT CALIFORNIA’S BRIDGES
Progress has been made over the past decade to increase the percentage of California bridges
in good condition and to reduce the number that are classified as structurally deficient.
However, much more remains to be done, especially as it relates to seismic retrofitting to
improve the safety of bridges in the event of an earthquake. Approximately 50% of bridges in
the state have exceeded their design life and the backlog of recommended maintenance, repair
and replacement work continues to grow. California is home to the second largest percentage
of “functionally obsolete” bridges, or bridges with outdated designs that frequently contribute
to congestion chokepoints. 6.2% of California’s bridges are structurally deficient (SD) and
California has the largest percentage of bridges in “Poor” condition in the nation by bridge
deck area. In other words, some of our largest bridges, along corridors such as I-5 in San Diego,
Highway 101 in Los Angeles, and I-80 in Sacramento need major repair and rehabilitation.
Repairs on nearly 4,400 bridges have been identified that with costs estimated at $12.2 billion.
California has fewer SD bridges than the national average, and this number is expected to
continue declining thanks to the passage of The Road and Repair Accountability Act (SB 1),
which increases funding for badly-needed repairs to the state’s transportation system.
However, there are still challenges facing the state’s bridges, including many jurisdictions
not having adequate resources to address their deteriorating bridges, the shortfall in the
amount of money available in general to repair and rehabilitate bridges, the growing number of
functionally obsolete (FO) bridges, and the growing need for funding to maintain and repair
the State’s aging bridges.
2018 CALIFORNIA INFRASTRUCTURE REPORT CARD—PAGE 3REPORT CARD FOR
CALIFORNIA’S
INFRASTRUCTURE
2018
CAPACITY AND CONDITION
As of December 2017, there were 25,657 bridges in California, the fourth largest state inventory of bridges in the United States, behind
Texas, Ohio, and Illinois. California’s bridges cross a variety of terrains including arid deserts, marine environments, and mountainous
areas with extreme winter snowfall. Each environment poses unique challenges to the service life of the bridges.
Roughly half of California’s 25,657 bridges are owned and maintained by the California Department of Transportation (Caltrans). The
remainder are owned and maintained by local jurisdictions.
A structurally deficient (SD) bridge is a bridge that requires significant maintenance, rehabilitation, or replacement because critical
load-carrying elements were found to be in poor condition due to deterioration or damage. The number of SD bridges in California has
decreased dramatically over the past few years from 2,769 in 2013 to 1,603 (6% of the state’s inventory) in 2017. (See Figure 1.) While
SD bridges do not pose an immediate danger to public safety, they must be inspected at least once every year.
FIGURE 1: STRUCTURALLY DEFICIENT BRIDGES IN THE STATE OF CALIFORNIA
Nearly 50% of California’s SD bridges are state-owned and maintained. The remaining 50% of California’s SD bridges are owned and
maintained by local jurisdictions. While many local agencies have kept up with their bridge maintenance needs, some have not due to
limited resources and funding. There have been instances where some local agency bridges have been closed to traffic due to disrepair.
2018 CALIFORNIA INFRASTRUCTURE REPORT CARD—PAGE 4REPORT CARD FOR
CALIFORNIA’S
INFRASTRUCTURE
2018
In addition to identifying bridges as “structurally deficient,” FHWA FIGURE 2: DISTRIBUTION OF CALIFORNIA’S
also collects data on the condition of bridges and classifies them as BRIDGES IN GOOD, FAIR, AND POOR CONDITION
in good, fair, or poor condition. Bridge condition is determined based
on the lowest condition rating assigned to various components of a POOR
bridge, including its deck, superstructure, and substructure. If the 5%
lowest rating is greater than or equal to seven, the bridge is classified
as “Good.” Bridges rated five or six are classified as “Fair.” If it’s less
than or equal to four, the classification is “Poor.”
FAIR
In California, 16,586 bridges —or 65% of the total bridge stock in the 30%
state —are in good condition. 7,676 bridges —or 30% —are in fair GOOD
condition, and the remaining 1,395 bridges — or 5% — are in poor 65%
condition. (See Figure 2.) The number of bridges in “Poor” condition
roughly correlates to the number of structurally deficient bridges
(1,603).The 30% of bridges in the state that are in fair condition require
maintenance to ensure they do not slip down to the “poor” category.
Another measure of the overall condition and capacity of a state’s
bridge network is the number of bridges previously defined by the
FHWA as Functionally Obsolete (FO). The term FO has been
sunset by the FHWA. FO bridges were previously defined as having
substandard geometric designs such as not being wide enough, or having enough under clearance, to facilitate efficient movement of their
traffic demands. The latest available data indicates there are about 4,400 FO bridges in California (approximately 17% of the total
number of bridges in the state). The trend in the traffic on FO bridges has been upward since 2004. (See Figure 3.)
FIGURE 3: TOTAL DAILY TRAFFIC ON FUNCTIONALLY OBSOLETE BRIDGES IN CALIFORNIA
2018 CALIFORNIA INFRASTRUCTURE REPORT CARD—PAGE 5REPORT CARD FOR
CALIFORNIA’S
INFRASTRUCTURE
2018
FO bridges are a source of congestion in California. Between 2004 and 2015, the total daily traffic on California’s FO bridges
increased by 47% (from 84,000 to about 124,000). As the population of California increases, traffic demands are expected to
increase. While great strides have been achieved in reducing the number of SD bridges in California, less is being done to address FO
bridges. This will lead to lost productivity due to longer travel times and higher levels of pollution and personal stress.
FUNDING AND FUTURE NEEDS
Funding for bridge improvements in California is done through a mix of federal, state and local sources. Federal revenue is provided
through the Federal Highway Bridge Program (FHBP). During Fiscal Year (FY) 2016, $296 million in federal funding was programmed
to California bridges from the FHBP.
State revenue is collected through transportation-related user fees. In 2017, the California State Legislature took an important step to
provide additional revenue to the transportation system. They passed The Road and Repair Accountability Act (SB 1), which is slated
to provide $4 billion for bridge projects over the next 10 years. The SB 1 transportation package is funded by increases in excise taxes
on fuel and surcharges on vehicle registration fees. State and local agencies have already applied for $1.8 billion in SB 1 funds to bridge
rehabilitation, replacement, and maintenance projects.
SB 1 provides much-needed funding for bridges owned at both the state and local level, especially jurisdictions that have limited
resources. These funds ensure bridges that were at risk of being closed will instead be repaired or replaced. Localities may still need to
raise their own revenues to further close the bridge funding gap. Regardless of state funding, the federal government must also be a part
of the solution as well by increasing the revenue it collects and distributes to the states.
According to the American Road & Transportation Builders Association, nearly 4,400 bridges have been identified as needing repair in
California and it is estimated that these repairs will cost about $12.2 billion.
OPERATION AND MAINTENANCE
One cannot overstate the importance of proper maintenance to extend the life of a bridge. Bridges are subjected to repeated truck
loads, debris, severe weather conditions, and in the case of bridges in marine environments, have elements such as foundations and
columns that are exposed to corrosive seawater. The joints, deck and elements that are near or under water are most vulnerable to wear-
and-tear and require periodic maintenance.
In the FY 2017-18 State Budget, $131 million was allocated to bridge major maintenance. However, the ongoing annual need for bridge
maintenance alone is estimated to be about $200 million. The shortfall in funding for maintenance will mean that the backlog of bridges
requiring maintenance, and potentially, the number of bridges falling into the SD category, may continue to grow. Making maintenance
a priority represents a better way to make use of the scarce amount of transportation funds available. According to the Legislative
Analyst’s Office, each dollar spent on maintenance can defer between $4 and $12 of cost needed for major rehabilitation.
2018 CALIFORNIA INFRASTRUCTURE REPORT CARD—PAGE 6REPORT CARD FOR
CALIFORNIA’S
INFRASTRUCTURE
2018
State bridges are adequately operated and maintained but some local agencies lack the funding to properly maintain their bridges. In
some cases, work recommendations from bridge inspectors are never implemented because of funding shortfalls. The failure to address
such recommendations can lead to possible advanced sectional loss, which may substantially degrade bridge capacity. Proper bridge
maintenance is required for a bridge to reach its expected lifespan.
Aging bridges are a growing concern. Many bridges in service today were designed for a 50-year lifespan. Today, over 50% of California
bridges exceed 50 years in age and 13% are over 75 years old (see Figure 4). Preventive maintenance can extend the lifespan of a bridge,
but most of the older bridges – particularly those that are SD – will need major rehabilitation or reconstruction. Whether a bridge can
be rehabilitated or reconstructed is heavily dependent on the availability of funding. In the meantime, older bridges may require more
frequent inspection and monitoring to ensure they remain safe for the public travel. Increasing shortfalls in funding resulting in deferring
badly needed repairs will likely lead to more of California’s aging bridges falling into “Poor” condition or SD category.
FIGURE 4: CALIFORNIA BRIDGES BY AGE
2018 CALIFORNIA INFRASTRUCTURE REPORT CARD—PAGE 7REPORT CARD FOR
CALIFORNIA’S
INFRASTRUCTURE
2018
INNOVATION
Innovations in bridge design and materials have potential to increase the durability of a bridge or prolong its lifespan. Advances in
material have made concrete stronger or more durable to withstand weather conditions. High performance steel has greater strengths,
ductility, and fracture resistance. Electrochemical Chloride Extraction (ECE) treatment, by applying an electric field at the deck,
prolongs the life of historic bridges.
Advances in Accelerated Bridge Construction, when properly implemented, have made construction in very challenging conditions
possible. Innovative construction methods can also be used to overcome issues relating to limited space, environmental restrictions, or
public safety in high traffic areas.
Innovation and new technology come with a price. Specialty products, services and construction are high ticket items and can
escalate construction costs. While initial costs may appear to be prohibitive, the intangible benefits such as increased safety, reduced
environmental and traffic impacts, and faster construction, can more than justify the added costs. Additionally, research and testing of
new products need funding along with agency and industry acceptance.
PUBLIC SAFETY
Public safety is of paramount concern to all government agencies. In the aftermath of the 1989 Loma Prieta earthquake and 1994
Northridge earthquake, major strides have been taken to seismically retrofit vulnerable older bridges. However, there are still bridges
requiring seismic retrofit. As of June 30, 2017, there are 241 locally owned bridges in the state of California that have been deemed
eligible for funding from the Local Bridge Seismic Retrofit Account, but for which funding has not been programmed. Construction is
underway and is expected to be complete by June 2019 on the last remaining state-owned bridge requiring seismic retrofit.
Vehicle heights and weights have increased over the years. Barriers on older bridges in service today were not designed to protect
today’s vehicles. Thus, barrier rail upgrade to current standards is also a public safety concern. However, limited funding has delayed
implementation of needed upgrades.
RESILIENCY
In addition to earthquakes, California faces many different types of natural and man-made disasters, including fires, tsunamis, droughts
and landslides. Structural resiliency is the ability to withstand unexpected loads brought about by climate change or natural disasters.
Change in climate conditions has produced heavier rains, stronger storms and higher winds. This is the new normal.
Old bridges were not designed for these loads. As previously noted, 54% of California bridges are over 50 years old, making them
vulnerable to such load increases. Bridges over waterways are most vulnerable. There are over 17,000 bridges over waterways in
California. Risks are exacerbated in fire-ravaged areas that are vulnerable to landslides.
A consistent strategy on resiliency is needed for California bridges. New guidelines need to be developed to address the risk and safety
issues associated with climate change. Prioritizing and strengthening vulnerable bridges will require major funding.
2018 CALIFORNIA INFRASTRUCTURE REPORT CARD—PAGE 8BRIDGES
LET’S RAISE THE GRADE
• Vote “No” on Proposition 6 in the 2018 November election. A no vote will ensure
the transportation package approved by the state legislature last year stays in
place and the modernization of California’s bridges can continue.
• Explore alternative revenue models, such as taxation based on vehicle-miles-traveled.
• Prioritize funding for maintenance on bridges the FHWA has deemed to be in
“fair” condition to mitigate further deterioration and prevent these bridges
from falling into the “poor” condition or SD category. This will be vital as
California’s bridges continue to age.
• Continue to explore and invest in innovations that provide better and more
efficient bridge inspection, maintenance, and rehabilitation, leading to
prolonged bridge lifespan and public safety.
• Continue to track the number of FO and SD bridges to get a better
understanding of the condition of the State’s bridge transportation network.
• Have funding earmarked to address specific issues such as substandard railings.
• Make bridge maintenance a major priority.
2018 CALIFORNIA INFRASTRUCTURE REPORT CARD—PAGE 9BRIDGES
SOURCES
California, S. O. (2018). ABOUT SB 1. Retrieved from http://rebuildingca.ca.gov/
California Transportation Commission. (2017, December 15). 2017 California
Transportation Commission Annual Report to the California Legislature. Retrieved
from http://www.catc.ca.gov/reports/annual-reports/
Deficient Bridges by Highway System. (2018, April 9). Retrieved from
https://www.fhwa.dot.gov/bridge/britab.cfm
Peters, J. (2017, February 17). 2017-18 Transportation Funding Package. Retrieved
from https://lao.ca.gov/Publications/Report/3572
SB-1 Transportation Funding. (2017, May 1). Retrieved from https://leginfo.
legislature.ca.gov/faces/billNavClient.xhtml?bill_id=201720180SB 1
2018 CALIFORNIA INFRASTRUCTURE REPORT CARD—PAGE 10REPORT CARD FOR
CALIFORNIA’S
INFRASTRUCTURE
2018
ROADS GRADE: D
WHAT YOU SHOULD KNOW ABOUT CALIFORNIA’S ROADS
Driving on deficient roads costs Californians $61 billion annually due to congestion-related delays,
traffic collisions and increased vehicle operating costs caused by poor road conditions. The condition
of California roads is among the worst in the nation, ranking 49th according to the latest US News &
World Report Ranking. Meanwhile, Southern California and the Bay Area are the second and third
most congested urban areas in the nation, respectively. Repair and improvement to these roads is vital
to California’s economic health and public safety. The Road and Repair Accountability Act (SB 1)
passed in April 2017, provides $52 billion in additional funds for local and state roads over the next
ten years. However, a total of more than $130 billion over that same time is needed to bring the
system back to a state of good repair. A good transportation system enables efficient movement of
goods and people and is critical to California’s economic well-being.
AVERAGE DELAY (HRS) PER COMMUTER
CAPACITY
Safe and reliable roads are critical to
meeting the demands of California’s
growing population and maintaining
the state’s status as the world’s
fifth largest economy. California’s
population is nearly 40 million in
2018, a 17% increase since 2000. As
population increases, so does vehicle-
miles-traveled (VMT). According
to TRIP, a national transportation
research organization, VMT in
California increased by 11% from 2000
to 2016, from 307 billion miles to 340
billion miles travelled each year. The
average driver now spends over three
full days stuck in traffic, and congested
roads cost Californians $29.1 billion
2018 CALIFORNIA INFRASTRUCTURE REPORT CARD—PAGE 11REPORT CARD FOR
CALIFORNIA’S
INFRASTRUCTURE
2018
each year from lost time and wasted fuel. This equates to drivers losing between $299 and $1,774 in annual costs per driver. The Los
Angeles-Long Beach – Anaheim region area is the second most congested area in the nation, according to the Texas Transportation
Institute’s 2015 Urban Mobility Scorecard, and the San-Francisco-Oakland region was the third.
CONDITION
According to the California Legislative Analyst’s Office, California has almost 51,000 lane miles of state highways and 335,000 lane
miles of local streets and roads. According to the 2018 TRIP’s analysis of Federal Highway Administration (FHWA) data, only 19%
of California’s major roads and highways are in good condition, whereas 68% are in mediocre or poor condition, and 13% are in fair
condition.
On the Pavement Conditions Index (PCI) a scale of zero (failed) to 100 (new), California’s average local street and road PCI has
continued to deteriorate over the years and was at an “At Risk” number of 65 in 2016. The average PCI in 52 of the state’s 58 counties
are categorized in the “At Risk” or “Poor” categories.
Additionally, most California roads today are at least 40 years old, which means they have exceeded their design life. While roads may
be resurfaced, they will continue to age and reach a point of deterioration where reconstruction is necessary for roads to be safe.
CALIFORNIA HAS THE SECOND WORST ROADS IN THE COUNTRY.
51% OF THE MAJOR URBAN ROADS IN CALIFORNIA ARE IN POOR CONDITION.
WA 39%
MN 10%
OR 13%
WI 39%
NY 38%
MI 40% RI 45%
NJ 40%
NV 8%
DC 92%
CO 35%
MO 9% KY 14%
TN 11%
OK 38% AR 10% SC 12%
California 51%
GA 15%
FL 7%
2018 CALIFORNIA INFRASTRUCTURE REPORT CARD—PAGE 12REPORT CARD FOR
CALIFORNIA’S
INFRASTRUCTURE
2018
FUNDING
The primary funding source for transportation infrastructure is the motor fuels tax levied
by both the federal and state governments. The federal motor fuels tax is 18.3 cents-per- 10-YEAR
gallon and has not been raised since 1993. Increased vehicle fuel efficiency, hybrid and MAINTENANCE
electrical vehicles, and a failure to index the tax to inflation has reduced the federal fuel tax’s BACKLOG
purchasing power by more than half in the last 25 years. At the state level, the California
legislature acted in 2017 to shore up transportation revenues and provide additional funding
Total Backlog: $137B
for the state’s road network. The Road and Repair Accountability Act, Senate Bill 1 (SB 1)
transportation package provides an estimated $52 billion in transportation revenue over the
next 10 years to repair some of California’s subpar infrastructure. SB 1 Funding: $52B
While SB 1 provides much-needed revenue, more must be done. As of 2018, roads face an Funding Gap: $85B
$85 billion funding gap over the next 10 years. To fill the gap, cities and counties must raise
and continue to invest their own revenues, and the state must explore new and innovative
funding models including increased participation from the private sector. The federal
government must also be a partner by providing significant, sustainable funding, ideally through an increase in the federal gas tax.
FUTURE NEED
The California Department of Transportation’s (Caltrans) California Transportation Plan 2040 (CTP 2040), adopted in June 2016,
identifies goals and recommendations to achieve a safe, sustainable, universally accessible, and globally competitive transportation
system. CTP 2040 acknowledges highway and road investments alone will not solve congestion problems exacerbated by the more than
five million people added to California’s population every decade. The plan recommends new methods focusing less on specific projects
and more on improving corridors through holistic approaches. The Federal Highway Administration estimates each $1.00 spent on road,
highway and bridge improvements can return $5.20 in benefits by reducing vehicle maintenance costs, traffic delays, fuel consumption,
road repair costs and vehicular emissions, resulting in improved safety and traffic flow on our roads.
OPERATIONS AND MAINTENANCE
Caltrans has an approximately $57 billion deferred maintenance backlog, by far the largest such backlog in the state. Projections suggest
this deferred backlog will increase over the next decade due to chronic underfunding.
SB 1 and California’s 2017 Five-Year Infrastructure Plan (FYIP) begins to address these deferred maintenance issues by directing the
largest percentage of money from SB 1 to be spent on maintenance of state highways and local streets and roads. SB 1 allocates $1.8
billion annually toward Caltrans’ Highway Maintenance Program (CHMP) and State Highway Operations and Protection Program
(SHOPP). CHMP performs maintenance on highways in good or fair condition while SHOPP delivers capital projects to rehabilitate
or reconstruct highways when they have reached the end of their useful lives. Additionally, the FYIP will provide an annual $1.5 billion
for local road maintenance and rehabilitation. However, the average annual funding of $2.3 billion for SHOPP repair and rehabilitation
work is insufficient to address the annual $8 billion needed, and localities themselves need to direct additional funding to these projects
to help close the investment gap.
2018 CALIFORNIA INFRASTRUCTURE REPORT CARD—PAGE 13REPORT CARD FOR
CALIFORNIA’S
INFRASTRUCTURE
2018
PUBLIC SAFETY
Between 2012 and 2016, 16,185 people were killed in motor vehicle accidents in California (an average of 3,237 fatalities per year).
Statistically there is one fatality for every million vehicle miles traveled, which is slightly better than the national average of 1.16
fatalities per million vehicle miles traveled. Since 2014, California has seen increases in fatalities among motorcyclists (+5%), bicyclists
(+14%) and pedestrians (+22%), which emphasizes the needs for improvements in roadway safety. Highway improvements such as
removing or shielding obstacles, adding or improving medians, improving lighting, adding rumble strips, widening lanes, widening and
paving shoulders, upgrading roads from two lanes to four lanes, and providing better road markings and traffic signals can reduce traffic
fatalities and crashes while improving traffic flow. Improving safety on California’s roadways can be also be accomplished through further
enhancements in vehicular safety and advancements in vehicle automation.
MOTOR VEHICLE FATALITIES
2018 CALIFORNIA INFRASTRUCTURE REPORT CARD—PAGE 14REPORT CARD FOR
CALIFORNIA’S
INFRASTRUCTURE
2018
RESILIENCE
Most urban areas in California have robust networks of alternate roadways, for use if primary roadways were inoperable due to
emergency events such as earthquakes, wildfires, flooding or tsunamis. However, the main intercity north-south and east-west roadways
have limited alternate routes of comparable capacity for most of their routes.
California’s transportation infrastructure is vulnerable to the effects of climate change including extreme weather conditions and sea
level rise (SLR). The effects of SLR will have impacts on all modes of transportation located near the coast. If greenhouse gas emissions
continue undiminished, it is possible for SLR to accelerate thirty to forty times faster than during the last century. Aggressive reductions
in greenhouse gas emissions may substantially reduce, but not eliminate the risk California will face from extreme SLR. According to
the National Oceanic and Atmospheric Administration (NOAA), the global sea level continues to rise at the rate of 1/8 inch per year.
California Climate Change Center forecasts that if the rate of SLR continues to accelerate, and combined with major storm events, a
resulting sea level rise of 4.5 feet by the year 2100 may cause risk of flooding to approximately 3,500 miles of California roadways.
INNOVATION
In recent years the automobile and technology industries have made significant advancements in autonomous vehicular (AV)
mobilization. Two of the 10 U.S. Department of Transportation Designated Automated Vehicle Proving Grounds are located in
California. California must now prepare for the implementation of AVs as well as other mobility technologies including vehicle-to-
vehicle and vehicle-to-infrastructure communications deployment. New technologies have the potential to fundamentally alter
transportation systems by reducing crashes, providing critical mobility to the elderly and disabled, increasing road capacity, saving
fuel and lowering emissions. Trends in shared mobility may lead to shared ownership of vehicles and increased reliance on on-demand
mobility services. Testing of fully AVs on California’s public roads began in April 2018 but, pending sufficient legislation, may take a while
to be widely adopted.
There have been recent trends toward sustainable road design and construction, with projects certified for sustainability using rating
systems such as Greenroads, Envision, and INVEST. Also, Intelligent Transportation System (ITS) technologies such as adaptive signal
systems and electronic toll collection systems, and Regional Integration Systems of Intelligent Transportation Systems such as LA
Metro’s RIITS are common on many of California’s urban and rural highways. In addition, numerous programs have been developed to
incentivize and accelerate the adoption of zero and near-zero emission vehicles.
2018 CALIFORNIA INFRASTRUCTURE REPORT CARD—PAGE 15ROADS
LET’S RAISE THE GRADE
• Vote “No” on Proposition 6 in the 2018 November election. A no vote will ensure
the transportation package approved by the state legislature last year stays in
place. If The Road and Repair Accountability Act (SB 1) were to be repealed,
California state and local governments will face a deferred maintenance backlog
of $137 billion over the next 10 years. SB 1 provides $52 billion to address this
backlog; in order to raise the state’s roadway grade to the desired level of “B”,
long term, dedicated and consistent transportation funding is vital.
• Invest in future mobility technologies to increase capacity, enhance safety,
improve the quality of life, provide a heathier economy and engender a
sustainable California.
• Policymakers should consider the findings and recommendations made in the
Road Charge Pilot Program completed in March 2017 and continue progress
towards using a mileage-based user fee approach to pay for transportation
improvements.
• Continue development, adoption and implementation of advanced multimodal
transportation systems and ITS technologies to increase safety, improve
mobility, reduce greenhouse gas and air pollution emissions, and minimize
energy demand.
• Improve the adaptability and resilience of the road network against natural and
man-caused events.
2018 CALIFORNIA INFRASTRUCTURE REPORT CARD—PAGE 16ROADS
SOURCES
• 2015 Urban Mobility Scorecard. (2015, August). Retrieved from https://static.
tti.tamu.edu/tti.tamu.edu/documents/mobility-scorecard-2015.pdf
• California, S. O. (2018). ABOUT SB 1. Retrieved from http://rebuildingca.ca.gov/
• California Transportation by the Numbers. (2018, August). Retrieved from
http://www.tripnet.org/docs/CA_Transportation_by_the_Numbers_TRIP_
Report_Aug_2018.pdf
• Caltrans. (2018). Transportation Asset Management. Retrieved from
http://www.dot.ca.gov/assetmgmt/
• Heberger, M., Cooley, H., Herrera, P., Gleick, P., & Moore, E. (2009, May). The
Impacts of Sea-Level Rise on The California Coast, California Climate Change
Center. Retrieved from http://pacinst.org/wp-content/uploads/2014/04/sea-
level-rise.pdf
• Highway Statistics 2016 - Policy | Federal Highway Administration. (2018,
August 14). Retrieved from https://www.fhwa.dot.gov/policyinformation/
statistics/2016/
• Legislative Analyst’s Office, California’s Transportation System. (2018, June 7).
Retrieved from: https://lao.ca.gov/Publications/Report/3860
• SB 1 Rebuilding CA. (2018). Retrieved from http://www.calcima.org/SB 1
2018 CALIFORNIA INFRASTRUCTURE REPORT CARD—PAGE 17REPORT CARD FOR
CALIFORNIA’S
INFRASTRUCTURE
2018
TRANSIT GRADE: C-
WHAT YOU SHOULD KNOW ABOUT CALIFORNIA’S TRANSIT
FACILITIES
California needs robust, flexible and reliable transit systems to reduce peak congestion on our
highways, provide options for citizens who do not drive, and improve air quality. Public transit
in California provides nearly 1.5 billion trips annually on 139 transit systems throughout the
state. The California Transportation Commission estimated in 2011 the state needed approximately
$174 billion for expansion and state of good repair transit projects over the next 10 years, but at the
time only 45% funding of funding had been identified, leaving a shortfall of $96 billion. Fortunately,
recent legislative initiatives and ballot measures are attempting to close the funding gap, including
an additional $750 million annually for transit agencies across the state provided through The
Road and Repair Accountability Act (SB 1). Adequate resources must be provided to our transit
systems or we risk retreat on sustainability gains as well as the current state of good repair.
CAPACITY
California has 139 transit systems, including urban, small urban and rural systems serving a population of over 38 million. Transit services
include Light Rail, Bus and Demand Response with the breakdown of ridership shown in Figure 1.
FIGURE 1. TRANSIT SERVICE TYPES
2018 CALIFORNIA INFRASTRUCTURE REPORT CARD—PAGE 18REPORT CARD FOR
CALIFORNIA’S
INFRASTRUCTURE
2018
Public transit in California provides nearly 1.5 billion trips annually. Approximately 5.3% of Californians commute to work using public
transit. The population in California is projected to grow to 48 million by 2040. The millennial generation has shifted away from owning
individual cars and the older baby boomer generation is aging and either in retirement or approaching retirement. These two groups
make up the largest portion of the population and will increase the need for alternative modes of transportation.
Transit ridership increased from 2.2% in 2000 to 4.4% in 2012. Since 2015, the national trends have shown approximately 6% decrease
in transit ridership. In late 2017, LA Metro was operating 5% fewer bus hours than in 2005 and 20% fewer bus miles. Likewise, most
major providers were forced to cut service in response to the 2008 recession and have continued to cut service as ridership decreases.
Factors leading to lower ridership include a decrease in service caused by inadequate funding for operations, resulting in eliminating
routes and increasing headways, making transit less convenient. The improved economy has also likely contributed to additional private
passenger vehicle trips and further increasing traffic congestion in many California cities.
Caltrans’ California Transportation Plan 2040 includes goals and strategies to reduce congestion, move people and goods efficiently for
economic growth and reduce greenhouse gases. All strategies presented include significant increases in public transit ridership. Keys to
increasing ridership include providing convenient and reliable service with first mile/last mile connections readily available.
CONDITION
Significant progress has been made by most major transit agencies in recent years to upgrade older systems to a state of good repair.
San Diego Metropolitan Transit System (SDMTS) has rehabilitated the Blue Line and Orange Line and Los Angeles (LA) Metro has
been updating the Blue Line (with significant improvements yet to come). The average age of San Diego’s bus fleet in 2015 was 6.58, or
slightly below the national average. The Bay Area Rapid Transit (BART) recently passed a $3.5 billion measure to complete long overdue
state of good repair improvements. Currently, BART reports owning the oldest big-city fleet in the U.S.; its cars are on average 30
years old, and funding will go towards replacement. According to the 2016 California State Transportation Plan and the 2011 California
Transportation Commission Needs Assessment, there will be a shortfall of $74 billion for state of good repair improvements needed
through 2020. Funding from the 2017 transportation package (SB 1) is essential to addressing the shortfall.
OPERATIONS & MAINTENANCE (O&M)
Transit O&M includes staff labor costs, property, contract labor, parts, materials and supplies for vehicles and facilities and fuel and
power costs as shown in Figure 2. O&M costs have held steady since 2009 with total maintenance costs of $8 billion in 2015 as shown
in Figure 2. Approximately 25% of the total funding is from the fare box. A decline in ridership generally starting in 2009 lowered
fare box revenue. Transit agencies were forced to decrease costs by reducing service and raising fares. Restoring and improving transit
services and increasing ridership will require increased funding for operations and maintenance, at least in the shorter term until ridership
grows and fare box revenues increase.
2018 CALIFORNIA INFRASTRUCTURE REPORT CARD—PAGE 19REPORT CARD FOR
CALIFORNIA’S
INFRASTRUCTURE
2018
FIGURE 2. COMPONENTS OF O&M EXPENSES
FUNDING & FUTURE NEED
Transit in California is funded by fare box, state, local and federal sources. In 2015, $7 billion was provided to transit systems, as shown in
Figure 3.
FIGURE 3. SOURCES OF TRANSIT OPERATING FUNDING
2018 CALIFORNIA INFRASTRUCTURE REPORT CARD—PAGE 20REPORT CARD FOR
CALIFORNIA’S
INFRASTRUCTURE
2018
The California Transportation Commission (CTC) completed a 10-year needs assessment to identify state of good repair and expansion
funds needed by transit between 2011 to 2020. The report showed an estimated cost of $174 billion with only 45% funding available
leaving a shortfall of $96 billion. The SB 1 transportation package passed in 2017 stands to provide some of the much-needed funding
for transit. SB 1 is slated to provide $750 million annually in new revenue, including $25 million for local and regional planning as well as
$7 million in transportation research.
The California Air Resources Board is proposing a requirement for all transit vehicles to be zero emission by 2040. Limited funding is
identified to purchase new buses as well as upgrade or construct maintenance facilities for the new buses. Electric or hydrogen fuel cell
technology would comply with the new requirements, however the technologies are still emerging, very costly, are not currently reliable,
and have unknown infrastructure requirements. The higher implementation costs are adding to the capital funding gap.
Capital project funding identified in the CTC 10-Year Needs Assessment included state, federal and local sources as shown in Figure 4.
FIGURE 4. SOURCES OF CAPITAL FUNDING
Several new local funding sources have been added as a result of voter-approved tax initiatives in 2016. These initiatives provided funding
to LA Metro, BART and Santa Clara Valley Transportation Authority (VTA). Similar initiatives in San Diego, Ventura and Contra Costa
Counties were not successful. While the new taxes are significant for the Bay Area and Los Angeles, the overall deficit for the state
through 2020 will be more than $80 billion.
SB 1 will generate an additional $1 billion for transit annually for all of California. Increasing transit ridership plays a significant role in
decreasing congestion on our highways and local streets. While this is a good step toward funding, more investment is still needed to
meet future need.
As an example, in 2014 California generated $2.26 billion for transit or $58.23 per capita compared to New York, Illinois and
Pennsylvania that generated between $242.38 to 299.92 per capita transit investment in California is well below other states with large
metropolitan cities.
2018 CALIFORNIA INFRASTRUCTURE REPORT CARD—PAGE 21REPORT CARD FOR
CALIFORNIA’S
INFRASTRUCTURE
2018
PUBLIC SAFETY
California transit agencies have prioritized maintenance and replacement of vehicles even when funding is limited to provide safe public
transportation. In 2017 there were 25 fatalities associated with rail transit as shown in Figure 5, down slightly from a 6-year average of
26 fatalities. Most of the fatalities were not passengers. The total number of fatal accidents involving buses and large trucks (reported
together) has been decreasing since 1979. In addition, the total number of fatal accidents per 1,000 miles driven and per registered
owner has decreased significantly as shown in Figure 6.
FIGURE 5. STATEWIDE REPORTED INJURIES AND FATALITIES
FIGURE 6. TOTAL FATALITIES OF LARGE TRUCK AND BUS ACCIDENTS
2018 CALIFORNIA INFRASTRUCTURE REPORT CARD—PAGE 22REPORT CARD FOR
CALIFORNIA’S
INFRASTRUCTURE
2018
RESILIENCE
California transit systems are critical to the overall resiliency of a region as they provide critical alternatives for efficiently transporting
or evacuating large numbers of people during natural disasters or other incidents. The Federal Transit Administration (FTA) and the
California Department of Transportation (Caltrans) provide guidance for transit emergency response plans. Transit operates as both
dedicated guideway and vehicles on surface streets, providing the flexibility of bridging damaged infrastructure to provide continued
service. The system uses alternative fuel types providing redundancy should some fuels not be available as a result of an emergency.
Transit agencies in California have been at the forefront of clean energy. Most rail transit systems use clean electricity. Many agencies
including SDMTS and North County Transit District (NCTD) have transitioned to 100% non-fossil fuel buses. Alternative fuel (CNG
and electric) is used for 60% of bus transit in California compared to the national average of 47%. Even smaller agencies such as
Antelope Valley Transit and Porterville Transit are embarking on aggressive plans to transition to 100% electrical buses by 2019.
INNOVATION
Rapid Bus Routes are successfully implemented on freeways and local streets using traffic signal priority and other technologies, offering
a higher level of service with significantly less capital investments than LRT systems.
Use of technology for automated fare collection is implemented by many of the transit agencies in California along with real-time
communication and wifi to improve rider experience. Multi-agency fare collection systems are in the planning stages for most regions,
with implementation partially completed in LA.
Autonomous and connected vehicles have the potential to dramatically change transportation. Driverless vehicles are currently being
tested in San Ramon. Contra Costa County may be deploying as many as 100 vehicles by 2020.
2018 CALIFORNIA INFRASTRUCTURE REPORT CARD—PAGE 23LET’S RAISE THE GRADE
• Vote “No” on Proposition 6 in the 2018 November election. A no vote
will ensure the transportation package approved by the state legislature
last year stays in place and facilitate completion of state of good repair,
restoration of service and sustainability improvements that are critical
to the California economy. Elimination of this funding source will reverse
positive trends and negatively impact quality of life.
• Encourage local ballot initiatives to provide additional tax revenue to support
transit systems. Self-help counties provide funding and control prioritization
of improvements.
• Increase funding for demonstration projects to test new technologies and
research and development to expedite electric / hydrogen fuel options as
cost-effective alternatives to fossil fuels.
DEFINITIONS
Unlinked Passenger Trips (UPT)
The number of passengers who board public transportation vehicles.
Passengers are counted each time they board vehicles no matter how many
vehicles they use to travel from their origin to their destination.
Farebox Recovery
the percentage of transit operating expenses that are covered by revenues from
passenger fares.
Fixed Guideway (FG)
Fixed Guideway is a public transportation facility
• Using and occupying a separate right-of-way for the exclusive
use of public transportation;
• Using rail;
• Using a fixed catenary system;
• For a passenger ferry system;
• For a bus rapid transit system.
2018 CALIFORNIA INFRASTRUCTURE REPORT CARD—PAGE 24SOURCES
• A. (2016). American Association of State Highway and Transportation Officials
– Survey of State Funding – Public Transportation: Final Report 2016- FY2014
Data, April 2016. Retrieved from https://www.azta.org/images/uploads/transit-
studies/AASHTO_2016_Public_Transportation_Survey_of_State_Funding.pdf
• American Public Transportation Association – Transit Ridership Report Third
Quarter 2017. (2017, November 17). Retrieved from https://www.apta.com/
resources/statistics/Documents/Ridership/2017-q3-ridership-APTA.pdf
• California Transportation Plan & California Interregional Blueprint. (2018).
Retrieved from http://www.dot.ca.gov/hq/tpp/californiatransportationplan2040/
• CTC Report: 2011 Statewide Transportation System Needs Assessment.
(2012, January 19). Retrieved from http://www.catc.ca.gov/reports/annual-
reports/2011/2011-trans-needs-assessment-corrected-01172012.pdf
• Mid-Coast Corridor Transit Project. (2015, April). Retrieved from
https://www.transit.dot.gov/sites/fta.dot.gov/files/docs/CA_San_Diego_Mid_
Coast_Corridor_Engineering_Project_Profile.pdf
• National Safety Council Motor Vehicle Fatality Estimates. (2017,
December). Retrieved from https://www.nsc.org/Portals/0/Documents/
NewsDocuments/2018/December_2017.pdf
• Why New Cars. (2018). Retrieved from https://www.bart.gov/about/projects/
cars/why-new-cars
2018 CALIFORNIA INFRASTRUCTURE REPORT CARD—PAGE 25You can also read


