Tracing the Source of Influenza A Virus Zoonoses in Interconnected Circuits of Swine Exhibitions
←
→
Page content transcription
If your browser does not render page correctly, please read the page content below
The Journal of Infectious Diseases
    Major Article

Tracing the Source of Influenza A Virus Zoonoses in
Interconnected Circuits of Swine Exhibitions
Dillon S. McBride,1,a, Amanda C. Perofsky,2,a Jacqueline M. Nolting,1 Martha I. Nelson,2,b and Andrew S. Bowman1,
1
Department of Veterinary Preventive Medicine, The Ohio State University, Columbus, Ohio, USA; and 2Fogarty International Center, National Institutes of Health, Bethesda, Maryland, USA

   Background. Since 2011, influenza A viruses circulating in US swine exhibited at county fairs are associated with >460 zoonotic
infections, presenting an ongoing pandemic risk. Swine “jackpot shows” that occur before county fairs each summer intermix large
numbers of exhibition swine from diverse geographic locations. We investigated the role of jackpot shows in influenza zoonoses.
   Methods. We collected snout wipe or nasal swab samples from 17 009 pigs attending 350 national, state, and local swine exhib-

                                                                                                                                                                                          Downloaded from https://academic.oup.com/jid/article/224/3/458/6158869 by guest on 31 October 2021
itions across 8 states during 2016–2018.
   Results. Influenza was detected in 13.9% of swine sampled at jackpot shows, and 76.3% of jackpot shows had at least 1 pig test
positive. Jackpot shows had 4.3-fold higher odds of detecting at least 1 influenza-positive pig compared to county fairs. When influ-
enza was detected at a county fair, almost half of pigs tested positive, clarifying why zoonotic infections occur primarily at county
fairs.
   Conclusions. The earlier timing of jackpot shows and long-distance travel for repeated showing of individual pigs provide a
pathway for the introduction of influenza into county fairs. Mitigation strategies aimed at curtailing influenza at jackpot shows are
likely to have downstream effects on disease transmission at county fairs and zoonoses.
   Keywords. swine; United States; zoonoses; farms; prevalence; influenza A virus; public health; animals; transmission; human-
animal interface; pandemic risk.

The diverse pool of influenza A viruses (IAV) in animals                                          workers are at a higher risk for zoonotic IAV from swine [11,
presents an ongoing threat to human health [1–3]. Swine                                           12], and zoonotic cases are sporadically linked to commer-
are mixing vessels for the evolution of genetically novel                                         cial swine, the vast majority of these infections were in youth
IAVs with genetic components from multiple host species                                           swine exhibitors at county fairs [13–15]. An estimated 150
[4]. The 2009 H1N1 influenza pandemic was of swine or-                                            million people attend fairs in North America annually [16],
igin, highlighting the pathway for zoonotic IAV emergence                                         providing a conduit for numerous people to interact with
provided by swine systems [3, 5, 6]. The 2009 pandemic                                            swine and their pathogens.
furthered understanding of how global swine production                                               Agricultural fairs, which include county fairs, facilitate com-
facilitates the evolution of novel IAVs with zoonotic poten-                                      mingling among hundreds of swine for up to a week, creating
tial [7–9], and how specific human–animal interfaces can be                                       an environment conducive to the rapid spread of IAV between
targeted to prevent interspecies spillover events. Over the                                       animals as well as an interface for zoonotic transmission. The
last decade, the United States (US) has recorded the highest                                      pigs at fairs are raised primarily by youth exhibitors and their
number of swine-origin zoonotic IAV infections world-                                             families for the purpose of being shown at fairs and other shows
wide. Since 2011, novel reassortant IAVs of swine origin                                          through agricultural education programs such as 4-H and
(H1N1v, H1N2v, and H3N2v subtypes) have been associated                                           Future Farmers of America (FFA). In the Midwestern United
with >460 zoonotic infections in the US [10]. While swine                                         States, where most swine-origin zoonotic IAV infections have
                                                                                                  occurred, county fairs occur primarily during June-October.
                                                                                                  Although county fairs are typically restricted to pigs from that
   Received 3 December 2020; editorial decision 24 February 2021; accepted 1 March 2021;          county, swine exhibitors report attending an average of 3.1 shows
published online March 4, 2021.
   a
                                                                                                  in a year and showing the same pig multiple times [17]. Many of
    D. S. M. and A. C. P. contributed equally to this work as co–first authors.
   b
    Present affiliation: Laboratory of Parasitic Diseases, National Institute of Allergy and      the additional exhibitions belong to circuits of “jackpot” shows
Infectious Diseases, National Institutes of Health, Bethesda, Maryland, USA.                      that are held throughout the year. Swine are permitted to attend
   Correspondence: Andrew S. Bowman, MS, DVM, PhD, Department of Veterinary Preventive
Medicine, The Ohio State University, A100B Sisson Hall, 1920 Coffey Rd, Columbus, OH 43210,
                                                                                                  jackpot shows and return to their home farms afterward, po-
USA (bowman.214@osu.edu).                                                                         tentially facilitating long-range dissemination of IAVs (Figure
The Journal of Infectious Diseases®  2021;224:458–68                                              1). Exhibitors with pigs attending multiple shows prior to their
© The Author(s) 2021. Published by Oxford University Press for the Infectious Diseases Society
of America. All rights reserved. For permissions, e-mail: journals.permissions@oup.com.
                                                                                                  arrival at county fairs may be the source of the diverse IAVs de-
DOI: 10.1093/infdis/jiab122                                                                       tected in pigs that subsequently infect humans.

458 • jid 2021:224 (1 August) • Influenza A Virus in Swine Shows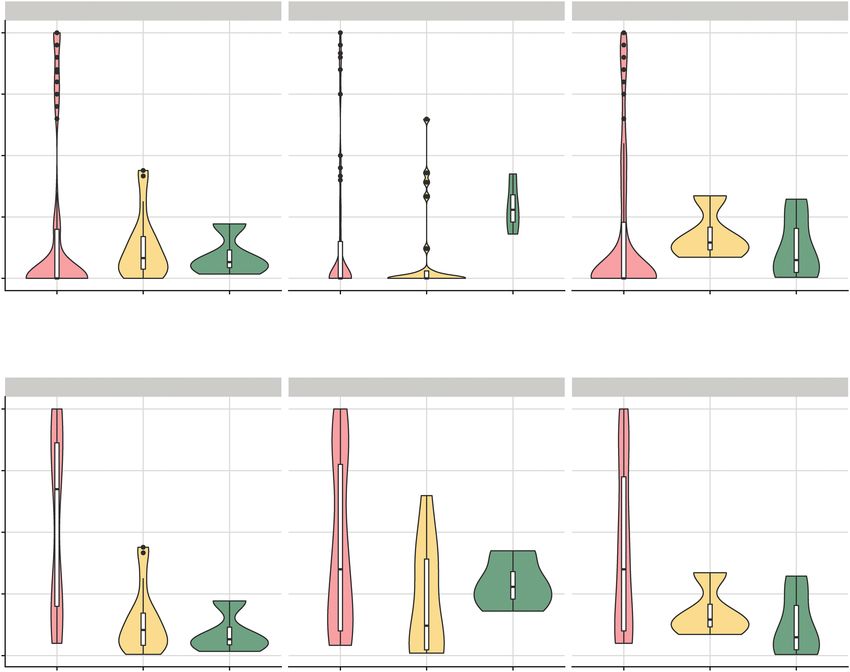
Few exhibitors travel long distances to show swine and                            Pigs from many US regions
                                                        then return home from national jackpot shows
                                                                                                                                       Large shows (hundred to
                                                                                                                                       thousands) of pigs
                                                                                                                                       Pigs not required to remain at
                                                                                                              National                 show for extended time
    Probable transmission between
                                                                                                              jackpot                  No reported zoonotic infections
       swine within home farms                                                                                 shows                   95% of exhibitors
              fairs, where zoonotic transmission has occured                                                                           participate, thousands of shows
                                                                                                                                       annually
                                                       Frequent zoonotic
                                                          transmission

Figure 1. Characteristics of the 3 exhibition swine show types included in this study. National jackpot shows (blue) are the least frequent show type, with a small subset
of all swine exhibitors traveling to attend. Attracting exhibitors from all over the US, national jackpot shows are very large, often with thousands of pigs in attendance.
Circuits of state jackpot shows (orange) are organized in each state and occur every weekend for many weeks, allowing exhibitors to show every weekend and return home
before showing the same or multiple pigs the following week. State jackpot circuits attract a subset of exhibitors from primarily within their individual state, but with typical
interstate travel for some exhibitors. County fairs (green) occur in nearly every county within our study range, allowing only pigs from within that county to attend, and with
nearly all youth swine exhibitors attending their local county fair.

   Zoonotic infections have not been traced directly to jackpot                            Animal Care and Use Committee (protocol 2009A0134-R2).
shows. However, the occurrence of jackpot shows prior to the                               State fairs differ from both county fairs and jackpot shows in
agricultural fair season positions them to serve as key upstream                           their broader regionality, longer duration, and greater size.
sources of the zoonotic viruses later isolated from humans. We                             Many state fairs host multiple shows for different categories of
conducted active IAV surveillance to determine IAV detection                               exhibition swine. Due to the variability both within state fairs
frequency at jackpot shows and county fairs and to elucidate                               and between states regarding their structure and regulations,
the role of jackpots in disseminating IAVs in the exhibition                               state fairs could not be appropriately grouped with jackpots or
network.                                                                                   county fairs and were censored from our analyses.
                                                                                              With permission from organizers overseeing each show, we
MATERIALS AND METHODS                                                                      collected 20 nasal swabs [16] or 24 snout wipes [18] at county
Surveillance in Exhibition Swine                                                           fairs, 200 snout wipes at state jackpots, and 400 snout wipes at
During 2016–2018, we conducted IAV surveillance in exhi-                                   national jackpots, on the last day of each show. Samples were
bition swine at jackpot shows across 8 US states (Arizona,                                 systematically collected from pigs and spatially distributed
Georgia, Illinois, Indiana, Iowa, Kentucky, Michigan, and Ohio)                            throughout the barn without consideration for clinical signs
and at county fairs in Ohio, Indiana, and Michigan, due to the                             of IAV. Samples were placed on dry ice for transportations
frequency of zoonotic IAV cases in these states [10]. Swine sam-                           immediately after sampling. The sample sizes for county fairs
pling was approved by The Ohio State University Institutional                              were chosen to ensure ≥95% probability of detecting of IAV at

                                                                                                                       McBride et al • jid 2021:224 (1 August) • 459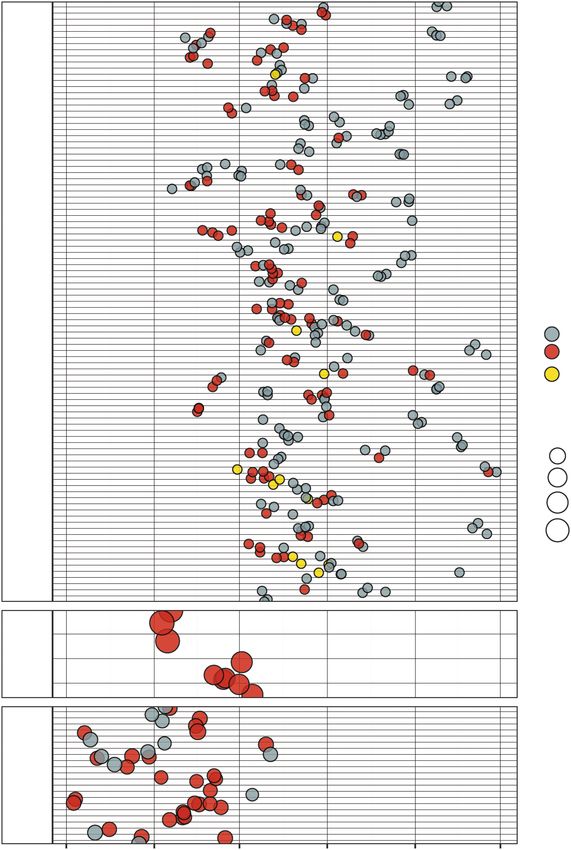
a prevalence of ≥0.15 at a typical-size fair. We targeted more      for exhibitors, exhibition size (≤200 swine or >200 swine), and
samples at jackpot shows to account for shorter show durations      whether other exhibitions had tested positive within the 14 days
(ie, less viral amplification). The required number of shows at     prior and the corresponding distances of these exhibitions. We
which we sampled was calculated to detect the expected dif-         defined exhibition duration as the number of days between the
ference in proportion of positive shows between jackpots and        required arrival date for swine exhibitors and the date pigs were
county fairs with 80% power. To evaluate the geographic distri-     sampled [26]. For each year, we calculated pairwise geographic
bution of swine at jackpot shows, we recorded US postal codes       distances and pairwise differences in entry date between all
corresponding to the location of the farm on which each pig         exhibitions. We obtained total swine population sizes for US
was raised. We did not record identifying information for pigs      counties from the 2017 US Department of Agriculture’s Census
or exhibitors to preserve exhibitor anonymity.                      of Agriculture [27]. For jackpot shows, we computed distances
   We screened viral RNA extracted from the samples with            in miles between show locations and the home zip codes of
real-time reverse-transcription polymerase chain reaction           participants.
(rRT-PCR) using the VetMAX-Gold SIV Detection Kit (Life
Technologies) with the 7500 Fast Real-Time PCR System (Life         Bayesian Logistic Regression

                                                                                                                                           Downloaded from https://academic.oup.com/jid/article/224/3/458/6158869 by guest on 31 October 2021
Technologies) according to the manufacturer’s protocol. We          We used a Bayesian approach to model the probability of county
conducted virus isolation on all rRT-PCR–positive samples           fairs and state jackpots testing positive for IAV. We excluded
using Madin–Darby canine kidney cells [19]. We sequenced            national jackpots from this analysis because all were IAV pos-
representative IAV isolates from each positive exhibition as pre-   itive. Model covariates included show entry date (measured as
viously described [20–22] and used full genome sequence data        the number of days from 1 January of each year), exhibition type
for antigenic subtype classification. All sequences are available   (county fair or state jackpot), show size (≤200 swine or >200
in GenBank; accession numbers are listed in Supplementary           swine), and the number of swine residing in each show’s respec-
Table 1.                                                            tive county. In 10 separate models, we included a covariate for
                                                                    whether IAV was detected at any exhibition within a 25-, 50-,
Statistical Analysis                                                75-, 100-, or 200-mile radius within the prior 2 weeks (yes or
All statistical analyses were conducted using R version 4.0.1       no). Continuous variables were mean-centered and scaled prior
[23]. Exhibition-level IAV status was designated using the re-      to model fitting.
sults of IAV rRT-PCR tests of nasal swab and snout wipe sam-           We fit logistic generalized linear regression models using
ples. Exhibitions were designated as IAV positive when ≥1           Markov chain Monte Carlo (MCMC) with Stan [28] via the
sample tested positive. We estimated exhibition-level IAV prev-     rstanarm package [29]. Weakly informative Student t priors
alence by dividing the number of individual swine that tested       (degrees of freedom = 7, location = 0, scale = 2.5) were placed
PCR positive for IAV by the total number of swine sampled.          on intercept and coefficient effect sizes. For each model, we ran
In statistical analyses with multiple comparisons, we used the      4 MCMC chains, each for 2000 iterations (including a burn-in
Benjamini–Hochberg procedure to control the false discovery         period of 1000 iterations that was discarded), producing a
rate.                                                               total posterior sample size of 4000. We verified convergence by
                                                                    inspecting trace plots and confirming that all parameters had
Influenza Infection Association With Exhibition Type and Location   sufficiently low R̂ values (all R̂ < 1.1) and sufficiently large ef-
The association of IAV status with exhibition type and location     fective sample sizes (>15% of the total sample size). To evaluate
was measured using Fisher exact tests and post hoc tests with       each model’s predictive performance, we computed approx-
Monte Carlo resampling (10 000 replicates), in which the nom-       imate leave-one-out cross-validation using Pareto smoothed
inal variables were exhibition type or state, respectively, and     importance sampling (loo package) [30, 31]. We used leave-
IAV presence or absence. For spatial geographic analyses, we        one-out information criterion to estimate differences in model
focused on state jackpots and county fairs in the 3 most densely    out-of-sample predictive accuracy and “stacking” of predictive
sampled states in our dataset: Ohio, Michigan, and Indiana. To      distributions to compute model weights [32].
determine if exhibition type or location was associated with in-
fluenza prevalence, we conducted general independence tests         RESULTS
with Monte Carlo resampling (10 000 replicates) (coin package)
[24]. For post hoc comparisons of prevalence between exhibi-        IAV Surveillance in Exhibition Swine

tion types or between US states, we used pairwise permutation       Across the 3 years, we collected nasal swab and snout wipe
tests (rcompanion package) [25].                                    samples from >17 000 exhibition swine at 350 exhibitions in
                                                                    8 US states (Figure 2). The majority of samples (n = 11 071
Risk Factors of Influenza Detection at Exhibitions                  samples) were collected at state and national jackpot shows
We recorded epidemiologically relevant metadata for each exhi-      (45 and 14 exhibition events, respectively), and 5938 samples
bition, including GPS coordinates, sampling date, date of entry     were collected from swine at 291 individual county fair events.

460 • jid 2021:224 (1 August) • Influenza A Virus in Swine Shows
2016 exhibitions geographic distribution of exhibitor home farms at national
jackpots (Figure 3; Supplementary Figures 2 and 3). Exhibition
swine traveled the longest distances to attend national jackpot
shows (Figures 3 and 4).
Across all years and exhibition types, we isolated viruses from
45.5% of our rRT-PCR–positive samples. Genotype analysis of
683 HA segment sequences revealed that we detected H1-α
(1A.1.1), H1-δ1 (1B.2.2), H1-δ2 (1B.2.1), H1-γ (1A.3), H1-pdm
(1A.3.3.2), H3-2000 (H3.1990.4), and H3-2010 (H3.2010.1)—
global nomenclature based on [33]. The dominant genotypes
2017 exhibitions
detected at county fairs were also detected in similar propor-
tions at the early national and state-level jackpots within each
year, but we detected varying proportions of each genotype
across years (Supplementary Table 2). All of the PB2 segments
Downloaded from https://academic.oup.com/jid/article/224/3/458/6158869 by guest on 31 October 2021
were TRIG lineage and selected for genetic distance analysis.
Genetic distances between isolates were smaller within a single
year compared to between study years (Supplementary Table
3), further supporting the notion that similar viruses propa-
gate throughout shows in a given year, but patterns in dominant
2018 exhibitions genotypes do not necessarily persist between show seasons.
IAV Detected in Swine at Majority of Jackpot Shows
IAV first appeared in state jackpot shows in May, then in national
jackpot shows beginning in June, and ultimately in county
fairs from June to October (Figure 4). IAV was frequently de-
tected at state jackpot shows that took place in late June and
early July, and sporadic zoonotic infections coincided with the
peak of county fair season in July and early August (Figure 4).
We detected IAV in a higher proportion of state and national
Fair type County State jackpot National jackpot IAV negative IAV positive jackpots (76.3%) compared to county fairs (37.8%) (Figures 4
and 5), and the probability of a swine exhibition having at least
Figure 2. Maps of swine exhibitions sampled in 2016, 2017, and 2018. Each 1 IAV-positive animal was strongly associated with the exhi-
point represents a swine exhibition sampled for this study. The color of the point
indicates whether pigs at the exhibition tested polymerase chain reaction (PCR) bition being a jackpot show (Fisher exact test, P = .0002 and
negative for influenza A virus (IAV, gray) or at least 1 pig tested PCR positive for IAV P < .00001). Among jackpot shows, we detected IAV in 68.9%
(red). The shape of the point indicates the type of exhibition (county, state jackpot, of state shows and at every national show, even those held in
or national jackpot).
regions with small local swine populations (Fisher exact test,
P = .03; Figure 2).
Across all 3 years, 15.3% (2602/17 009) of the pigs tested pos-
itive for IAV (Table 1), and IAV-positive swine were detected Higher IAV Prevalence at County Fairs
at 44.3% of all exhibitions. Large national jackpot shows were The proportion of pigs testing positive for influenza varied
held throughout each year (January–December) with a median across fair types and study years (Table 1; Figure 6A), with
duration of 3 days, whereas state jackpots primarily occurred national jackpots having the greatest overall prevalence when
in May and June and were typically 1–2 days (Supplementary data from the 3 years were combined (Fisher exact tests: state
Figure 1). County fairs took place from June to September with jackpot vs national jackpot, P < .001; county fair vs national
a median duration of 5 days (Supplementary Figure 1). jackpot, P = .01). However, these numbers represent averages
The national jackpot shows included in our study took place across hundreds of fairs, and a more detailed examination re-
in Iowa, Illinois, Georgia, Kentucky, and Arizona, and the sam- veals that county fairs and jackpot shows have different dy-
ples from county fairs and state jackpot shows were collected namics. County fairs tend to be highly bifurcated: Either there
in 3 Midwestern states with a high concentration of exhibition are no IAV-positive animals (62.2% of fairs), or >75% of an-
swine [17]: Ohio (162 exhibitions), Indiana (120 exhibitions), imals are IAV-positive (13.7% of fairs). In contrast, state and
and Michigan (54 exhibitions) (Figure 2). We observed swine national jackpot shows are consistently infected but generally at
from diverse localities at state jackpots and an even greater lower frequencies (13.9% of animals). Therefore, if we limit our
McBride et al • jid 2021:224 (1 August) • 461Table 1. Influenza A Virus Prevalence, Organized by Exhibition Type (County, State Jackpot, National Jackpot) and Year (2016, 2017, 2018)
Exhibition Type 2016a,b 2017a,b,c 2018b,c Total Specimensa,b,c
County fair 19.7% (389/1973) 16.3% (322/1973) 17.9% (357/1992) 18% (1068/5938)
State jackpot 11.9% (313/2631) 9% (228/2543) 17.2% (102/594) 11.1% (643/5768)
National jackpot 11.1% (177/1600) 27.7% (442/1597) 12.9% (272/2106) 19.3% (831/5303)
Total specimens 14.2% (879/6204) 16.2% (992/6113) 15.6% (731/4692) 15.3% (2602/17009)
The numbers of positive specimens and all specimens tested are included in parentheses.
a
Fisher exact test, county fair:state jackpot (adjusted P < .05).
b
Fisher exact test, county fair:national jackpot (adjusted P < .05).
c
Fisher exact test, state jackpot:national jackpot (adjusted P < .05).
analysis to exhibitions with at least 1 IAV-positive pig, county Ohio exhibitions (n = 6387), and 7.9% at Michigan exhib-
fairs had significantly greater IAV prevalence than state and itions (n = 2033). When county fairs and state jackpot sam-
national jackpots, both in the 3-year dataset (pairwise permu- ples were aggregated separately, county fairs and state jackpot
Downloaded from https://academic.oup.com/jid/article/224/3/458/6158869 by guest on 31 October 2021
tation tests, P = .00008 and P = .003) and when analyzing years shows in Indiana exhibited higher estimated prevalence com-
separately (2016: P = .00004, 2017: P = .07, 2018: P = .02; Figure pared to their counterparts in Ohio and Michigan (Indiana:
6B). Among IAV-positive shows, the mean estimated preva- county fairs, 23.6%; jackpot shows, 17.8%; Ohio: county fairs,
lence was 16.8% for state jackpots, 16.2% for national jackpots, 15.5%; jackpot shows, 11.2%; Michigan: county fairs, 11.7%;
and 46.9% for county fairs. More than a third (36.3%) of IAV- jackpot shows, 5.2%), though these differences were not sta-
positive county fairs had ≥75% pigs test positive, whereas only 1 tistically significant (independence tests, P > .05). Exhibitions
IAV-positive jackpot show had ≥50% pigs test positive. in Indiana had at least 1 IAV-positive animal more frequently
(59.2%) than exhibitions in Michigan (25.9%) and Ohio
High Rates of IAV Detection in Indiana (34.6%) (Fisher exact test, P = .0001 and P = .0001, respec-
Across all exhibition types, IAV was detected in 21.7% of tively; Supplementary Figure 4). When we limited our analysis
pigs sampled at Indiana exhibitions (n = 3286), 13.1% at to exhibitions with at least 1 positive sample, there was not a
National jackpot exhibitors Local jackpot exhibitors
IAV Negative IAV Positive IAV Negative IAV Positive
500
400 750
300
Count
Count
500
200
250
100
0 0
0 500 1000 1500 2000 0 500 1000 1500 2000
Distance Traveled (miles) Distance Traveled (miles)
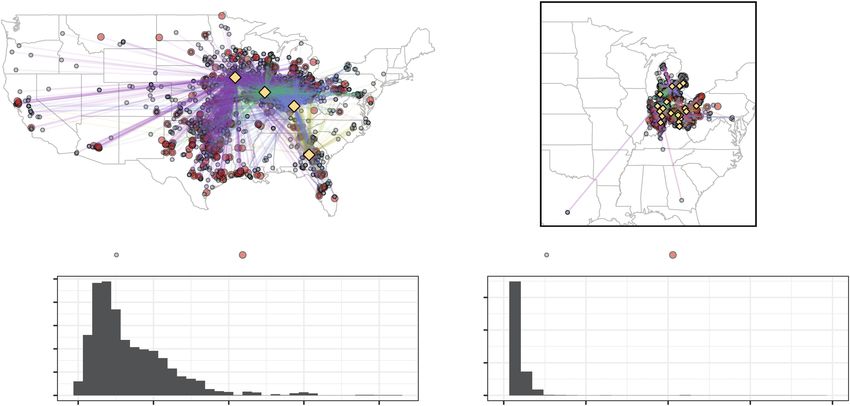
Figure 3. Geographic range of national and state jackpot exhibitors in 2016, 2017, and 2018. Each year, participants from 31–37 US states attended the national jackpot
shows sampled in our study. The state jackpot shows in our study drew participants from 4–9 states. Circular points are the home zip code locations of sampled pigs, and
point color indicates whether pigs from a particular zip code tested polymerase chain reaction (PCR) positive or PCR negative for influenza A virus (IAV). Yellow diamonds are
the locations of jackpot shows. Lines are colored by show identity and connect shows to home zip codes. Histograms are binned distances (miles) traveled by exhibitors from
their home zip code to show locations.
462 • jid 2021:224 (1 August) • Influenza A Virus in Swine ShowsCounty
IAV negative
IAV positive
IAV positive,
Downloaded from https://academic.oup.com/jid/article/224/3/458/6158869 by guest on 31 October 2021
Zoonotic case
Miles traveled
100
200
300
400
National
jackpot
jackpot
State
May Jun Jul Aug Sep Oct
Show timing
Figure 4. The timing of swine exhibitions organized by show type. Exhibitions that occurred from May to October during 2016–2018 are aggregated to show the relative
timing (month-day) of swine exhibitions throughout the year. Point color indicates whether pigs sampled at an exhibition tested polymerase chain reaction (PCR) negative for
influenza A virus (IAV, gray), if at least 1 pig tested PCR-positive for IAV (red), or if at least 1 pig tested positive for IAV and the exhibition was linked to a zoonotic infection
(yellow). Point size indicates the average distance in miles traveled by exhibitors to attend that show based on the United States postal code of their home farm. Shows are
arranged on the y-axis by longitude and jittered for clarity.
significant difference in prevalence across the 3 states (inde- probability of IAV detection increased with show duration, the
pendence test, P > .05). size of the effect was marginal (Figure 5B; Supplementary Table
4). The model that included the infection status of any show
Risk Factors for IAV at Swine Exhibitions type within 75 miles had the best predictive performance, with
We tested multiple predictors for whether an exhibition (county a classification accuracy of 70%.
or state jackpot) tested positive for IAV. Overall, exhibition
DISCUSSION
type was the strongest predictor. Jackpot shows had 4.35-fold
higher odds of detecting an IAV-positive animal relative to For more than a decade, animal and public health officials have
county fairs (95% confidence interval, 1.2–16.61; Figure 5B; attempted to disrupt the transmission of IAVs from exhibition
Supplementary Table 4). Larger show sizes (>200 swine), earlier swine to youth exhibitors that occurs every summer. However,
timing during the show circuit, local swine population size, it is difficult to mitigate zoonotic transmission at county fairs
and whether a nearby show had tested positive for IAV within where upwards of 70% of swine can be infected, and new pre-
the prior 2 weeks were also associated with increased odds of ventive strategies are needed. Here, we demonstrate that IAVs
detecting IAV (Figure 5B; Supplementary Table 4). Though the are frequently detected in exhibition swine at jackpot shows
McBride et al • jid 2021:224 (1 August) • 463A 2016 2017 2018
64
61
60
56
Number of exhibitions sampled
42
40
36
IAV PCR
32
Neg
Pos
20 18
12
9
Downloaded from https://academic.oup.com/jid/article/224/3/458/6158869 by guest on 31 October 2021
6
4 4 4
2
0 0 0 0
0
County State National County State National County State National
fair jackpot jackpot fair jackpot jackpot fair jackpot jackpot
B
Positive exhibition
within 75 mi
Exhibition timing
County swine population
Exhibition duration
Exhibition size: >200 swine
Exhibition type: jackpot
–1 0 1 2 3
Coefficient extimates (95% CrI)
Figure 5. A, Number of swine exhibitions that tested polymerase chain reaction (PCR) positive or PCR negative for influenza A virus (IAV). Exhibitions were designated as
IAV positive if ≥1 pig tested IAV positive using PCR. Gray bars correspond to IAV-negative exhibitions, and red bars correspond to IAV-positive exhibitions. B, Risk factors of
exhibitions testing PCR positive for IAV (county fairs and state jackpots). Median coefficient estimates (circles) and posterior 50% and 95% credible intervals (CrI; inner and
outer whiskers) were estimated using a Bayesian logistic regression model. Continuous predictors were mean-centered and scaled prior to model fitting
that occur upstream to county fairs and draw pigs from wide was subsequently detected 1 month later in pigs and people
geographic catchments, presenting a new target for mitigation at a county fair [14]. This study highlighted the potential of
efforts. Critically, IAVs detected at jackpot shows have been jackpot shows to seed IAV diversity into county fairs where
connected to zoonotic transmission events that occur at sub- public health risk is high. Likewise, an early-season national
sequent county fairs. For example, an emerging H3N2 subtype jackpot show in 2018 appeared to serve as a superspreading
that was recovered from our jackpot swine samples in 2016 event that propagated H1δ-2 (H1N2v) IAVs throughout the
464 • jid 2021:224 (1 August) • Influenza A Virus in Swine ShowsA All exhibitions
2016 2017 2018
100
75
Positive, %
50
25
0
County State National County State National County State National
fair jackpot jackpot fair jackpot jackpot fair jackpot jackpot
Downloaded from https://academic.oup.com/jid/article/224/3/458/6158869 by guest on 31 October 2021
B IAV-Positive exhibitions
2016 2017 2018
100
75
Positive, %
50
25
0
County State National County State National County State National
fair jackpot jackpot fair jackpot jackpot fair jackpot jackpot
Figure 6. Influenza A virus (IAV) prevalence in all swine exhibitions (A) and IAV polymerase chain reaction (PCR)–positive swine exhibitions (B) in 2016, 2017, and 2018.
Exhibitions were designated as IAV positive if ≥1 pig tested IAV positive using PCR. Violin plots show the distribution of exhibition prevalence and contain boxplots that vis-
ualize 5 summary statistics (the median, 2 hinges, and 2 whiskers). The lower and upper hinges correspond to the first and third quartiles (the 25th and 75th percentiles), and
whiskers extend to points within 1.5 interquartile ranges of the lower and upper quartile for a distribution.
exhibition circuit; this lineage caused the majority of zoonotic infectious for at least 5 days [36, 37]. This duration of infec-
cases reported later that summer [34]. In each year of our study, tion enables swine to carry and transmit IAV from shows week-
genotype analyses indicate that IAVs detected at jackpot shows to-week and within home farms. Because the timing of state
contribute to IAV outbreaks at county fairs later in the show jackpot shows overlaps with both national jackpot shows and
season. Altering the timing of critical jackpot shows may be ef- county fairs, IAVs introduced into jackpot shows have a clear
fective at reducing introduction of zoonotic potential IAV into route to seed county fairs. The introduction of IAV at a county
county fairs. To date, zoonotic transmission occurs primarily fair by a few pigs can spread rapidly among participating swine
at county fairs. Characterizing entire networks of swine exhib- [38], which enables subsequent zoonotic transmission [14, 16].
itions that drive the dispersal of zoonotic IAVs into county fairs Due to local control of show regulations, adoption of recom-
has uncovered new opportunities for mitigating an ongoing mendations to mitigate zoonotic transmission of IAV is highly
pandemic risk. varied among the thousands of county fairs that occur annually
Although IAV prevalence is lower at jackpots, the likelihood in the United States. The jackpot show network offers public
of detecting at least 1 pig with IAV is higher at jackpot shows health control points that could be targeted to reduce IAV
compared to county fairs. The structure of jackpot shows allows introductions at downstream county fairs.
exhibition swine from widely scattered locations to commingle, The lower estimated prevalence of IAV within IAV-positive
return home, and show again repeatedly throughout the year, jackpot shows compared to county fairs accounts for the ob-
which explains the simultaneous detection of highly related served absence of zoonotic infections tied to jackpot shows.
IAVs at geographically dispersed county fairs [35]. Swine can While county fairs are typically 5–7 days, many jackpot shows
shed IAV for at least 9 days postexposure and typically remain are short in duration (1–2 days), which does not likely afford
McBride et al • jid 2021:224 (1 August) • 465time for sustained IAV amplification within shows. Beyond Supplementary Data
duration, lower IAV prevalence in jackpots shows could arise Supplementary materials are available at The Journal of Infectious
from differences in swine husbandry between practiced jackpot Diseases online. Consisting of data provided by the authors to
exhibitors and county fair exhibitors who only show pigs an- benefit the reader, the posted materials are not copyedited and
nually. For example, a higher proportion of jackpot exhibitor are the sole responsibility of the authors, so questions or com-
survey respondents report vaccinating their pigs against IAV ments should be addressed to the corresponding author.
[39] than did county fair respondents in a different survey [17].
Throughout this study period, exhibitors likely had access to
Notes
autogenous vaccines and commercially available live attenuated
Acknowledgments. We thank all of the county fairs, jackpot
and whole inactivated influenza vaccines, but as of 2020, the
shows, and youth exhibitors that participate in our surveillance
only vaccine commercially available to exhibitors is a whole in-
program, as well as laboratory staff for their technical expertise
activated vaccine.
and assistance in collection and testing of surveillance samples.
IAVs are funneled down from national jackpots into state
Disclaimer. The conclusions of this study do not necessarily
jackpot circuits and from state jackpots into the subsequent
Downloaded from https://academic.oup.com/jid/article/224/3/458/6158869 by guest on 31 October 2021
represent the views of the National Institutes of Health or the
county fairs [34]. At a national jackpot show associated with
US government.
IAV dissemination [34], we recorded 11.2% Indiana zip codes
Financial support. This work was supported by the National
across 3 years compared to 2.9% and 2.3% from Ohio and
Pork Board and the Centers of Excellence for Influenza Research
Michigan, respectively. More Indiana pigs attending national
and Surveillance, National Institute of Allergy and Infectious
jackpot shows may correspond to an increased number of intro-
Diseases, National Institutes of Health, Department of Health
ductions into state jackpot shows and county fairs, resulting in
and Human Services (contract numbers HHSN272201400006C
the observed high proportion of positive shows in Indiana rela-
and HHSN272201400008C).
tive to Ohio and Michigan. In contrast, we did not detect signif-
Potential conflicts of interest. All authors: No reported con-
icant differences in IAV prevalence within exhibitions between
flicts of interest.
states, indicating that transmission dynamics of IAV within
All authors have submitted the ICMJE Form for Disclosure
Indiana shows are typical of other localities.
of Potential Conflicts of Interest. Conflicts that the editors
Our predictive model of IAV infection at swine exhibitions
consider relevant to the content of the manuscript have been
found that the odds of detecting IAV increases with show size
disclosed.
(the number of pigs present) and the size of the commercial
swine population in a county. The association between show
size and IAV infection is consistent with prior findings [26]; References
that is, larger shows often host open-class and breeding swine 1. Reid AH, Taubenberger JK. The origin of the 1918 pan-
shows in addition to junior market shows, drawing a greater demic influenza virus: a continuing enigma. J Gen Virol
diversity of exhibitors. Commercial swine are considered 2003; 84:2285–92.
the primary source of IAV diversity in exhibition swine [40] 2. Webster RG. The importance of animal influenza for
and are sometimes managed at the same location as exhibi- human disease. Vaccine 2002; 20(Suppl 2):S16–20.
tion swine. Exhibitor household members often have contact 3. Smith GJ, Vijaykrishna D, Bahl J, et al. Origins and evolu-
with swine other than their own, providing an interface for tionary genomics of the 2009 swine-origin H1N1 influenza
viral transmission between commercial and exhibition swine A epidemic. Nature 2009; 459:1122–5.
[17]. However, the commercial swine presence of a county 4. Ma W, Kahn RE, Richt JA. The pig as a mixing vessel for in-
may not be a reliable predictor of IAV infection at jackpot fluenza viruses: human and veterinary implications. J Mol
shows, which host a majority of swine exhibitors from outside Genet Med 2008; 3:158–66.
of the county. 5. Garten RJ, Davis CT, Russell CA, et al. Antigenic and genetic
Despite being a small niche in the swine industry, IAV sur- characteristics of swine-origin 2009 A(H1N1) influenza
veillance efforts have detected substantial viral diversity in ex- viruses circulating in humans. Science 2009; 325:197–201.
hibition swine [16, 38]. In US commercial swine populations, 6. Mena I, Nelson MI, Quezada-Monroy F, et al. Origins of the
IAVs tend to cluster spatially, and IAV gene flow generally 2009 H1N1 influenza pandemic in swine in Mexico. eLife
corresponds with the direction of swine transportation across 2016; 5:e16777.
states [41]. As the geographic diversity of farms participating 7. Vijaykrishna D, Poon LLM, Zhu HC, et al. Reassortment of
in exhibitions increases, we expect the diversity of IAV detected pandemic H1N1/2009 influenza A virus in swine. Science
to also increase. Presence of diverse IAVs within 1 exhibition 2010; 328:1529–9.
could facilitate frequent coinfection and high reassortment po- 8. Ducatez MF, Hause B, Stigger-Rosser E, et al. Multiple re-
tential in this population of exhibition swine. assortment between pandemic (H1N1) 2009 and endemic
466 • jid 2021:224 (1 August) • Influenza A Virus in Swine Showsinfluenza viruses in pigs, United States. Emerg Infect Dis 23. R Core Team. R: a language and environment for statistical
2011; 17:1624–9. computing. Vienna, Austria: R Foundation for Statistical
9. Trovão NS, Nelson MI. When pigs fly: pandemic influenza Computing, 2020. https://www.R-project.org/. Accessed 23
enters the 21st century. PLoS Pathog 2020; 16:e1008259. July 2020.
10. Centers for Disease Control and Prevention. Reported in- 24. Zeileis A, Wiel MA van de, Hornik K, Hothorn T.
fections with variant influenza viruses in the United States. Implementing a class of permutation tests: The coin
2018. https://www.cdc.gov/flu/swineflu/variant-cases-us. package. J Stat Softw 2008; 28:1–23.
htm. Accessed 21 February 2020. 25. Mangiafico SS. Summary and analysis of extension pro-
11. Myers KP, Olsen CW, Setterquist SF, et al. Are swine workers gram evaluation in R, version 1.18.1. 2016. rcompanion.
in the United States at increased risk of infection with zoo- org/handbook/. Accessed 23 July 2020.
notic influenza virus? Clin Infect Dis 2006; 42:14–20. 26. Bowman AS, Workman JD, Nolting JM, Nelson SW,
12. Gray GC, McCarthy T, Capuano AW, Setterquist SF, Slemons RD. Exploration of risk factors contributing to the
Olsen CW, Alavanja MC. Swine workers and swine influ- presence of influenza A virus in swine at agricultural fairs.
enza virus infections. Emerg Infect Dis 2007; 13:1871–8. Emerg Microbes Infect 2014; 3:1–5.
Downloaded from https://academic.oup.com/jid/article/224/3/458/6158869 by guest on 31 October 2021
13. Bowman AS, Sreevatsan S, Killian ML, et al. Molecular ev- 27. National Agricultural Statistics Service. United States sum-
idence for interspecies transmission of H3N2pM/H3N2v mary and state data. 2017 Census Agric 2019; 1:695.
influenza A viruses at an Ohio agricultural fair, July 2012. 28. Carpenter B, Gelman A, Hoffman MD, et al. Stan: a probabi-
Emerg Microbes Infect 2012; 1:1–8. listic programming language. J Stat Softw 2017; 76. https://
14. Bowman AS, Walia RR, Nolting JM, et al. Influenza www.osti.gov/pages/biblio/1430202-stan-probabilistic-
A(H3N2) virus in swine at agricultural fairs and transmis- programming-language. Accessed 23 July 2020.
sion to humans, Michigan and Ohio, USA, 2016. Emerg 29. Gabry J, Goodrich B. rstanarm: Bayesian applied regres-
Infect Dis 2017; 23:1551–5. sion modeling via Stan. R package version. 2016. https://
15. Jhung MA, Epperson S, Biggerstaff M, et al. Outbreak of mc-stan.org/rstanarm. Accessed 23 July 2020.
variant influenza A(H3N2) virus in the United States. Clin 30. Vehtari A, Gelman A, Gabry J. Practical Bayesian model
Infect Dis 2013; 57:1703–12. evaluation using leave-one-out cross-validation and WAIC.
16. Bowman AS, Nolting JM, Nelson SW, Slemons RD. Stat Comput 2017; 27:1413–32.
Subclinical influenza virus A infections in pigs exhibited at 31. Vehtari A, Simpson D, Gelman A, Yao Y, Gabry J. Pareto
agricultural fairs, Ohio, USA, 2009–2011. Emerg Infect Dis smoothed importance sampling. arXiv [Preprint]. 2019.
2012; 18:1945–50. http://arxiv.org/abs/1507.02646. Accessed 23 July 2020.
17. Bliss N, Stull JW, Moeller SJ, Rajala-Schultz PJ, Bowman AS. 32. Yao Y, Vehtari A, Simpson D, Gelman A. Using stacking to
Movement patterns of exhibition swine and associations of average Bayesian predictive distributions (with discussion).
influenza A virus infection with swine management prac- Bayesian Anal 2018; 13:917–1007.
tices. J Am Vet Med Assoc 2017; 251:706–13. 33. Anderson TK, Chang J, Arendsee ZW, et al. Swine influenza
18. Edwards JL, Nelson SW, Workman JD, et al. Utility of snout A viruses and the tangled relationship with humans. Cold
wipe samples for influenza A virus surveillance in exhibi- Spring Harb Perspect Med 2021; 11:a038737.
tion swine populations. Influenza Other Respir Viruses 34. Nelson MI, Perofsky A, McBride DS, et al. A heterogenous
2014; 8:574–9. swine show circuit drives zoonotic transmission of influenza
19. Bowman AS, Nelson SW, Edwards JL, et al. Comparative A viruses in the United States. J Virol 2020; 94:e01453-20.
effectiveness of isolation techniques for contemporary in- 35. Nelson MI, Stucker KM, Schobel SA, et al. Introduction, ev-
fluenza A virus strains circulating in exhibition swine. J Vet olution, and dissemination of influenza A viruses in exhibi-
Diagn Invest 2013; 25:82–90. tion swine in the United States during 2009 to 2013. J Virol
20. Shepard SS, Meno S, Bahl J, Wilson MM, Barnes J, 2016; 90:10963–71.
Neuhaus E. Viral deep sequencing needs an adaptive ap- 36. Loving CL, Lager KM, Vincent AL, et al. Efficacy in pigs
proach: IRMA, the iterative refinement meta-assembler. of inactivated and live attenuated influenza virus vaccines
BMC Genomics 2016; 17:708. against infection and transmission of an emerging H3N2
21. Rambo-Martin BL, Keller MW, Wilson MM, et al. Influenza similar to the 2011–2012 H3N2v. J Virol 2013; 87:9895–903.
A virus field surveillance at a swine-human Interface. 37. Allerson MW, Cardona CJ, Torremorell M. Indirect trans-
mSphere 2020; 5:e00822-19. mission of influenza a virus between pig populations under
22. Venkatesh D, Poen MJ, Bestebroer TM, et al. Avian influ- two different biosecurity settings. PLoS One 2013; 8:e67293.
enza viruses in wild birds: virus evolution in a multihost 38. Bliss N, Nelson SW, Nolting JM, Bowman AS. Prevalence
ecosystem. J Virol 2018; 92:e00433-18. of influenza A virus in exhibition swine during arrival
McBride et al • jid 2021:224 (1 August) • 467at agricultural fairs. Zoonoses Public Health 2016; 40. Nelson MI, Wentworth DE, Das SR, et al. Evolutionary
63:477–85. dynamics of influenza A viruses in US exhibition swine. J
39. Nolting JM, Scheer SD, Bowman AS. Perceptions and at- Infect Dis 2016; 213:173–82.
titudes of swine exhibitors towards recommendations for 41. Nelson MI, Lemey P, Tan Y, et al. Spatial dynamics of
reducing zoonotic transmission of influenza A viruses. human-origin H1 influenza A virus in North American
Zoonoses Public Health 2019; 66:401–5. swine. PLoS Pathog 2011; 7:e1002077.
Downloaded from https://academic.oup.com/jid/article/224/3/458/6158869 by guest on 31 October 2021
468 • jid 2021:224 (1 August) • Influenza A Virus in Swine ShowsYou can also read