Can You Ever Be Too Smart for Your Own Good? Comparing Linear and Nonlinear Effects of Cognitive Ability on Life Outcomes - Gwern.net
←
→
Page content transcription
If your browser does not render page correctly, please read the page content below
964122
research-article2021
                       PPSXXX10.1177/1745691620964122Brown et al.Too Smart

                                                                                                                                                          ASSOCIATION FOR
                                                                                                                                            PSYCHOLOGICAL SCIENCE

                                                                                                                                            Perspectives on Psychological Science

                               Can You Ever Be Too Smart for Your                                                                           1–23
                                                                                                                                            © The Author(s) 2021
                                                                                                                                            Article reuse guidelines:
                               Own Good? Comparing Linear and                                                                               sagepub.com/journals-permissions
                                                                                                                                            DOI: 10.1177/1745691620964122
                                                                                                                                            https://doi.org/10.1177/1745691620964122

                               Nonlinear Effects of Cognitive Ability                                                                       www.psychologicalscience.org/PPS

                               on Life Outcomes

                               Matt I. Brown1                                , Jonathan Wai2 , and Christopher F. Chabris1
                               1
                                Autism and Developmental Medicine Institute, Geisinger Health System, Lewisburg, Pennsylvania,
                               and 2Department of Education Reform, Department of Psychology, University of Arkansas

                               Abstract
                               Despite a long-standing expert consensus about the importance of cognitive ability for life outcomes, contrary views
                               continue to proliferate in scholarly and popular literature. This divergence of beliefs presents an obstacle for evidence-
                               based policymaking and decision-making in a variety of settings. One commonly held idea is that greater cognitive
                               ability does not matter or is actually harmful beyond a certain point (sometimes stated as > 100 or 120 IQ points). We
                               empirically tested these notions using data from four longitudinal, representative cohort studies comprising 48,558
                               participants in the United States and United Kingdom from 1957 to the present. We found that ability measured
                               in youth has a positive association with most occupational, educational, health, and social outcomes later in life.
                               Most effects were characterized by a moderate to strong linear trend or a practically null effect (mean R 2 range =
                               .002–.256). Nearly all nonlinear effects were practically insignificant in magnitude (mean incremental R 2 = .001) or
                               were not replicated across cohorts or survey waves. We found no support for any downside to higher ability and no
                               evidence for a threshold beyond which greater scores cease to be beneficial. Thus, greater cognitive ability is generally
                               advantageous—and virtually never detrimental.

                               Keywords
                               individual differences, cognition, cognitive ability, intelligence, IQ, curvilinear, longitudinal study

                               Decades of evidence shows that intelligence or cogni-                    epidemiological studies indicate that cognitive ability
                               tive ability is one of the strongest and most consistent                 predicts longevity and various health outcomes beyond
                               predictors of important outcomes in life (Deary, 2000;                   the effects of socioeconomic status or social class
                               Hunt, 2010; Kuncel et al., 2004). Cognitive ability pre-                 (Gottfredson & Deary, 2004). These protective effects
                               dicts job performance and training success in the United                 have been observed for both physical and mental health
                               States (Hunter & Schmidt, 2004; Schmidt & Hunter,                        later in adulthood (Deary et al., 2010; Wraw et al.,
                               1998, 2004) and abroad (Bertua et al., 2005), income                     2016). Greater cognitive ability in adolescence has also
                               ( Judge, Klinger, & Simon, 2010), occupational stratifica-               been reported to be linked to health behaviors in adult-
                               tion (Cheng & Furnham, 2012; Warren et al., 2002),                       hood, such as greater physical activity (Batty et al.,
                               leadership ( Judge et al., 2004), unemployment (Caspi                    2007) and less consumption of alcohol or tobacco
                               et al., 1998), educational attainment (Berry et al., 2006),              ( Judge, Ilies, & Dimotakis, 2010). In addition, cognitive
                               and academic performance (Kuncel & Hezlett, 2007).                       ability is positively related to subjective measures of
                               Scholars who understand this evidence often recom-                       well-being and health, including greater life satisfaction
                               mend cognitive ability tests as a component of selection
                               processes in educational and organizational settings
                                                                                                        Corresponding Author:
                               (e.g., Sackett et al., 2008; Schmidt & Hunter, 2000).                    Christopher F. Chabris, Autism and Developmental Medicine Institute,
                                   The positive influence of cognitive ability extends                  Geisinger Health System
                               beyond work and education. Results of large-scale                        E-mail: chabris@gmail.com
2                                                                                                                 Brown et al.

           Table 1. Examples of Popular Works Suggesting the Consequences of Having Too Much Cognitive
           Ability

           Title
           Nonfiction
             The Intelligence Trap: Why Smart People Make Dumb Mistakes (Robson, 2019)
             The Stupidity Paradox: The Power and Pitfalls of Functional Stupidity at Work (Alvesson & Spicer, 2016)
             Why Smart People Hurt: A Guide for the Bright, the Sensitive, and the Creative (Maisel, 2013)
             The Intelligence Paradox: Why the Intelligent Choice Isn’t Always the Smart One (Kanazawa, 2012)
             The Smartest Guys in the Room: The Amazing Rise and Fall of Enron (McLean & Elkind, 2003)
             When Genius Failed: The Rise and Fall of Long-Term Capital Management (Lowenstein, 2000)
             The Price of Greatness: Resolving the Creativity and Madness Controversy (Ludwig, 1996)
             The Drama of the Gifted Child: The Search for the True Self (Miller, 1983)
             The Best and the Brightest (Halberstam, 1972)
           Fiction
             Silicon Valley (HBO television series; Berg et al., 2014)
             Sherlock (BBC television series; Gatiss et al., 2010)
             The Big Bang Theory (CBS television series; Lorre & Prady, 2007)
             Soon I Will Be Invincible (novel; Grossman, 2007)
             Proof (film; Madden, 2005)
             The Aviator (film based on the life of Howard Hughes; Scorsese, 2004)
             A Beautiful Mind (film based on the life of John Nash; Howard, 2001)
             Pi (film; Aronofsky, 1998)
             Flowers for Algernon (novel; Keyes, 1966)

(Gonzalez-Mule et al., 2017), happiness (Nikolaev &              related to achievement than either motivation (Van
McGee, 2016), and self-ratings of health (Wrulich et al.,        Iddekinge et al., 2018) or deliberate practice alone
2014). This body of research suggests that cognitive             (Macnamara et al., 2014).
ability plays an important role in many aspects of every-            Beyond the general skepticism about the usefulness
day life.                                                        of cognitive ability in everyday life, there is also the idea
                                                                 in popular culture that there is a cost to having too much
Popular Beliefs About Cognitive Ability                          cognitive ability—that you can be “too smart for your
                                                                 own good.” Examples of this idea can be found in many
Are Often Not Based on Evidence                                  works of nonfiction and fiction; for examples, see Table
Despite general expert agreement on the positive                 1. Highly intelligent characters are often portrayed as
effects of cognitive ability, some researchers and popu-         cynical (e.g., Sherlock Holmes or Frank Underwood),
lar authors have deprecated the importance of cognitive          villainous (e.g., Dr. Evil, Dr. No, or Dr. Octopus), socially
ability or even dismissed it entirely. One popular idea          inept (e.g., Sheldon Cooper or Richard Hendricks), or
is that in the real world, cognitive ability is simply not       suffering from a psychological disorder (e.g., John
as valuable as it may be in academia and not as impor-           Forbes Nash or Howard Hughes). Additional examples
tant as claimed in the academic literature. Many authors         of this notion can even be found in the content and
have argued that cognitive ability is irrelevant for most        titles of several popular nonfiction books. Although not
meaningful outcomes in life (e.g., Alloway & Alloway,            all of these books are explicitly about intelligence or
2014; Brooks, 2011). Several popular, best-selling books         cognitive ability (e.g., The Smartest Guys in the Room or
have also emphasized the importance of effort and                When Genius Failed), these titles play on the idea that
resilience in achieving success in life while simultane-         there are negative consequences to being the “smartest”
ously suggesting that cognitive ability has little impact,       or a “genius.”
if any (e.g., Colvin, 2008; Gladwell, 2008). According               Although cognitive ability is often not explicitly men-
to these and similar works (e.g., D. Coyle, 2009), virtu-        tioned as the root cause of these negative characteristics
ally anyone can reach high levels of performance or              (e.g., psychopathology, cynicism, or depression), this
achievement in their lives simply by devoting enough             pairing can easily be mistaken as evidence for causality,
time and practice. Not only do these works ignore the            and even high achievers (e.g., former world chess cham-
role of cognitive ability in the development of expertise        pion and political activist Garry Kasparov; Carlson, 2010)
or learning (Kaufman et al., 2010), but also empirical           may shy away from recognizing a role for cognitive abil-
evidence indicates that ability is often more strongly           ity in their own success. When a writer for Der Spiegel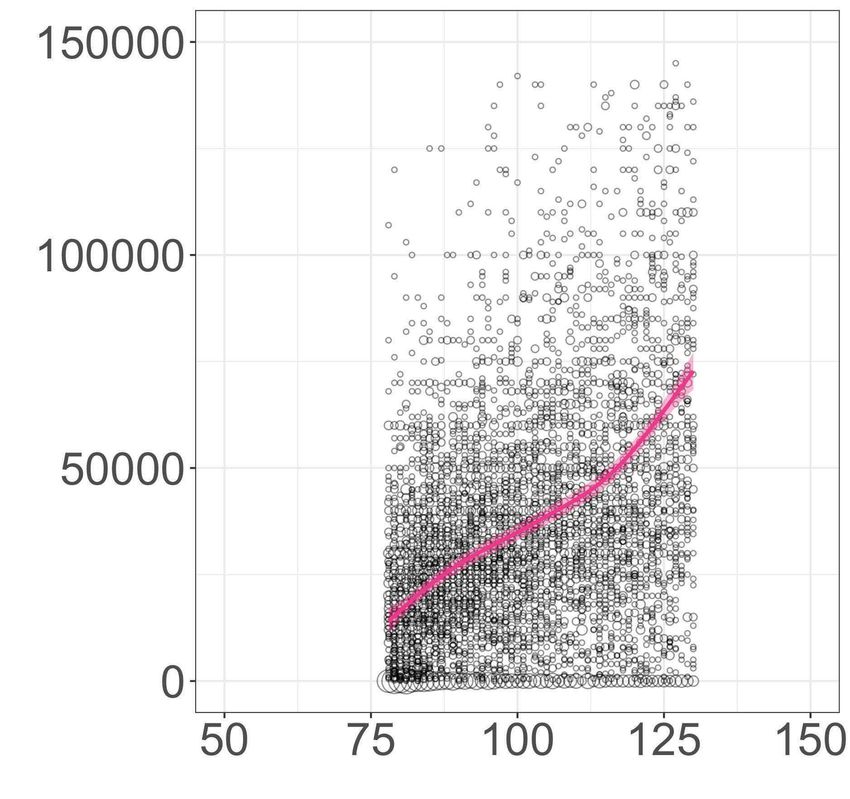
Too Smart                                                                                                                           3

Table 2. Examples of Claims in Popular and Academic Literature That There Are Limits to the Value of Having Greater
Cognitive Ability

“‘IQ’ is a stale test meant to measure mental capacity but in fact mostly measures extreme unintelligence [emphasis in original]
   . . . how good someone is at taking some type of exams designed by unsophisticated nerds it ends up selecting for exam-
   takers, paper shufflers, obedient IYIs (intellectuals yet idiots), ill adapted for ‘real life.’” (Taleb, 2019, para. 2)
“Society prizes intelligence. Geniuses are viewed with awe and assumed to be guaranteed prosperity and success. Yet there is a
   dark side to intelligence.” (Fergusson, 2019, para. 7)
“Those who are highly intelligent possess unique intensities and overexcitabilities which can be at once remarkable and disabling.
   For example, the same heightened awareness that inspires an intellectually gifted artist to create . . . can also potentially drive
   that same individual to withdraw into a deep depression.” (Karpinski et al., 2018, p. 9)
“The average IQ of scientists is certainly higher than the average IQ of the general population, but among scientists there is no
   correlation between IQ and scientific productivity . . . among those who have become professional scientists, a higher IQ
   doesn’t seem to offer an advantage.” (Ericsson & Pool, 2016, pp. 234–235)
“Although many people continue to equate intelligence with genius, a crucial conclusion from Terman’s study is that having
   a high IQ is not equivalent to being highly creative. Subsequent studies by other researchers have reinforced Terman’s
   conclusions, leading to what’s known as the threshold theory, which holds that above a certain level, intelligence doesn’t have
   much effect on creativity: most creative people are pretty smart, but they don’t have to be that smart, at least as measured
   by conventional intelligence tests. An IQ of 120, indicating that someone is very smart but not exceptionally so, is generally
   considered sufficient for creative genius.” (Andreasen, 2014, para. 17)
“To these qualifications of the importance of IQ, we can add the fact that, above a certain level of intelligence, most employers
   do not seem to be after still more of it.” (Nisbett, 2009, p. 17)
“The relationship between success and IQ works only up to a point. Once someone has an IQ of somewhere around 120, having
   additional IQ points doesn’t seem to translate into any measurable real-world advantage.” (Gladwell, 2008, pp. 78–79)
“A reasonable amount of intelligence is certainly a necessary (though not sufficient) condition to be a reasonable mathematician. But
   an exceptional amount of intelligence has almost no bearing on whether one is an exceptional mathematician.” (Tao, 2007, para. 5)
“Standardized tests are thus not sufficiently predictive of future performance. Individuals are not necessarily more meritorious if
   they obtain the highest scores on standardized tests, thus rendering invalid the argument that students with the highest scores
   should have priority in admissions.” (Vasquez & Jones, 2006, p. 138)
“There is little evidence that those scoring at the very top of the range in standardized tests are likely to have more successful
   careers in the sciences. Too many other factors are involved.” (Muller et al., 2005, p. 2043)
“At the highest levels of creative achievement, having an exceptionally high IQ makes little or no difference. Other factors,
   including being strongly committed and highly motivated are much more important.” (Howe, 2001, p. 163)
“Guilford and most of the other psychologists who have been active in this research field are agreed that a certain level of general
   intelligence is required for creativity. Below that level, an individual’s resources of ideas are too meager to make creative
   production possible. But above that level, an individual may or may not be creative. It is not clear yet, however, exactly what
   that intelligence threshold is, and it would not be wise to set it too high. How high an IQ one needs to be creative is still an
   open question.” (Tyler, 1974, pp. 100–101 in reference to Guilford, 1967).

asked chess grandmaster (and future world champion)                  characteristics. Other researchers have found that indi-
Magnus Carlsen what his IQ was, he demurred:                         viduals often consider slightly above average intelli-
                                                                     gence (and not extremely high intelligence) as the most
   I have no idea. I wouldn’t want to know it anyway.                ideal level for themselves (Hornsey et al., 2018) and
   It might turn out to be a nasty surprise. . . . Of                most attractive in a potential mate (e.g., the 90th per-
   course it is important for a chess player to be able              centile is preferred to the 99th percentile; Gignac et al.,
   to concentrate well, but being too intelligent can                2018; Gignac & Starbuck, 2019). Moreover, teachers
   also be a burden. It can get in your way . . . I am               have also been reported to implicitly assume that highly
   a totally normal guy . . . I’m not a genius.                      gifted students experience more emotional maladjust-
   (translated in Chessbase, 2010)                                   ment (Preckel et al., 2015). We believe that these find-
                                                                     ings all suggest a perceived downside to having a high
Along these lines, researchers have observed that indi-              degree of cognitive ability.
viduals often associate high levels of cognitive ability                Concern about the risk of high cognitive ability can
with negative social or emotional characteristics. For               also be found in the works of well-known authors and
example, Stavrova and Ehlebracht (2019) observed that                academic researchers (Table 2). Most recently, a widely
individuals perceived that highly cynical people have                discussed critique of IQ and intelligence tests claimed,
greater cognitive ability despite finding a consistently             among other things, that they measure only “extreme
negative relationship when directly measuring these                  unintelligence” and that their use results in selecting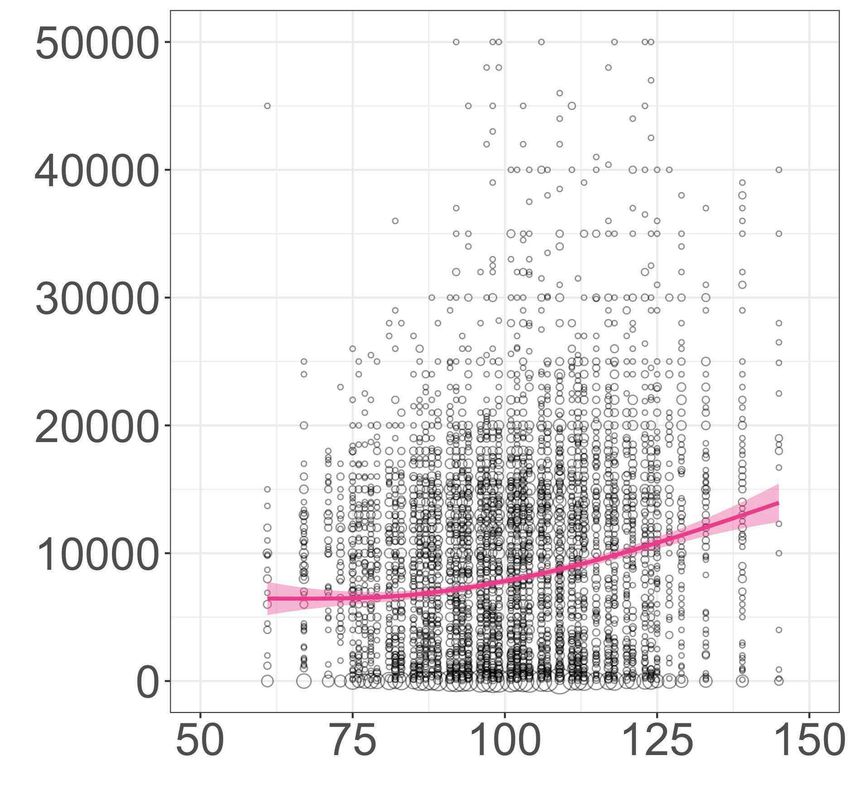
4                                                                                                             Brown et al.

people who are “ill-adapted for ‘real life’” (Taleb, 2019).   for example, a Connecticut police department was sued
Likewise, a recent cover story of a prominent magazine        for rejecting an applicant for a job because he had
was titled “The Curse of Genius” and suggested that           scored too high on a cognitive ability test (Associated
“brilliant children” are “miserable misfits” (Fergusson,      Press, 1999). Subsequent research has failed to support
2019). Along similar lines, the thesis of the Intelligence    the idea that having too much cognitive ability leads to
Trap (Robson, 2019) is that high cognitive ability is         greater voluntary turnover (Maltarich et al., 2010) and
potentially linked to poorer decision-making and a            has found that objective overqualification has little
greater susceptibility to decision biases, whereas            impact on job satisfaction (Arvan et al., 2019) and can
Kanazawa (2012) argued in The Intelligence Paradox            even lead to better performance (Hu et al., 2015).
that highly intelligent individuals do worse in most          Despite these findings, many individuals and organiza-
important tasks in life. In sum, these claims from both       tions still perceive overqualified job candidates to be
popular and academic authors suggest that high levels         less committed and to exert less effort (Galperin et al.,
of cognitive ability act as an obstacle or handicap for       2020), and popular news accounts report the “surprising
achieving success in life.                                    damage smart workers can cause” (Silverberg, 2017).
                                                                  A similar research-practice gap can be found in the
Potential Impact of Popular Beliefs                           field of education. In U.S. higher education, for exam-
                                                              ple, there is a growing trend to minimize the use of
About Cognitive Ability                                       standardized tests in admissions (e.g., Wainer, 2011).
Although popular publications are often ignored in            This “test optional” movement is based largely on the
scholarly discussions, they can influence a wider audi-       idea that adverse impact is sufficient evidence of bias,
ence than academic journals. This influence is espe-          and in fact nearly 1,000 schools admit large numbers
cially important given that practitioners and the general     of undergraduate applicants without requiring stan-
public are more likely to read books or magazines             dardized test scores (Fairtest.org, 2021). Thus, the test-
written by popular authors (e.g., business leaders, sci-      optional movement rejects or does not acknowledge
ence communicators) than works written by academic            the large body of evidence supporting the predictive
researchers (D. J. Cohen, 2007). Likewise, the views and      validity of cognitive ability. Not only are institutions
interests of researchers are thought to have an outsized      deciding to remove test requirements for undergraduate
influence on what research topics are studied and             admissions (e.g., Anderson, 2020), but also even some
reported on in the academic literature (Briner & Rousseau,    top-ranked graduate programs in the sciences have
2011). This disconnect between what is discussed              recently dropped the Graduate Record Examination
among researchers and what is discussed in best-selling       (GRE) from their admissions process, a movement pub-
books and magazines can help create, maintain, and            licly known as “GRExit” (Langin, 2019). Thus, a growing
expand gaps in understanding between researchers              number of institutions have chosen to not consider test
and the general public. Although concern over the             scores in student admissions despite evidence that tests
divide between research and practice has been long            are valid predictors of academic achievement (Kuncel
documented (e.g., Boehm, 1980), these gaps are widely         & Hezlett, 2007). Moreover, in a quasiexperimental field
acknowledged as important obstacles to evidence-based         study, Belasco et al. (2015) observed that colleges that
practices in psychology, education, and management            adopted test-optional policies did not observe greater
(Banks et al., 2016). Therefore, it is important to con-      diversity among applicants or enrolled students com-
sider the potential influence of these popular publica-       pared with colleges that continued to require standard-
tions, especially when they express ideas that contradict     ized testing. These events suggest that despite nearly a
or misrepresent what has been reported in the research.       century of research evidence, misconceptions about
   Along these lines, the usefulness of cognitive ability     cognitive ability continue to be highly influential among
for hiring is one of the most frequently documented           practitioners, policymakers, and the general public.
research-practice gaps in applied psychology and
human resource (HR) management (Rynes, 2012). Past
                                                              Existing Literature on Nonlinear Effects
studies have found that many HR professionals under-
estimate the predictive validity of cognitive ability tests   Several past works have reported curvilinear effects of
in the United States (Rynes et al., 2002) and in Europe       cognitive ability on a wide range of outcomes, including
and Asia ( Jackson et al., 2018; Tenhiala et al., 2016)       leadership (Antonakis et al., 2017), personality (Major
despite the large amount of published scientific research     et al., 2014), creativity ( Jauk et al., 2013), and antisocial
supporting the tests’ predictive validity. This knowledge     behavior (Silver, 2019). Others have reported that high
gap between research and practice can also lead to the        levels of cognitive ability are related to elevated health
misuse of ability tests. In a highly publicized court case,   risks, including attention-deficit/hyperactivity disorder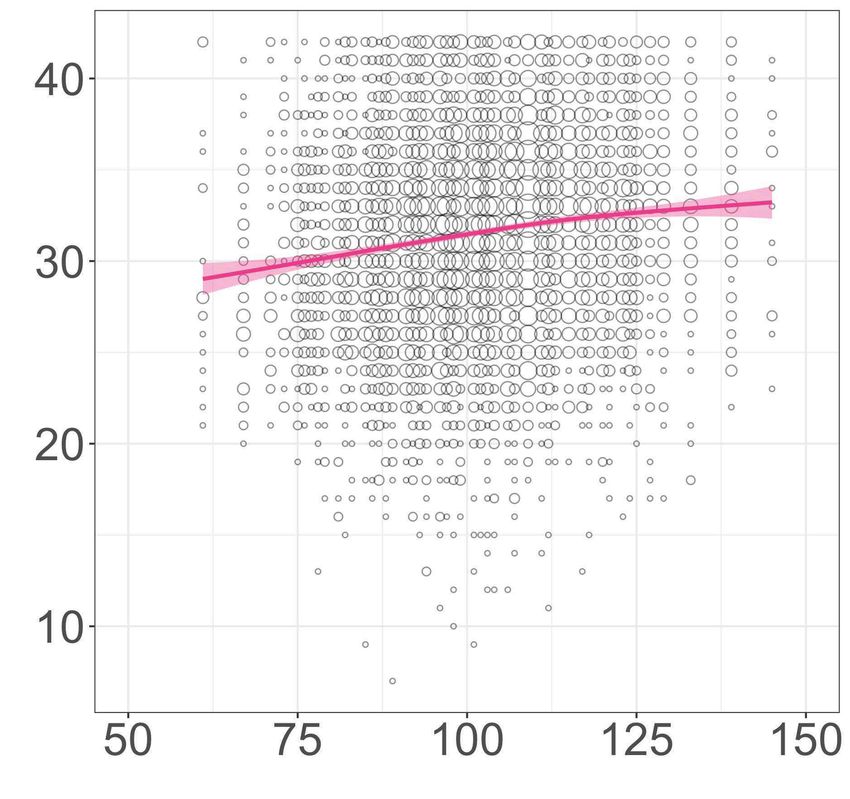
Too Smart                                                                                                                 5

(Karpinski et al., 2018), bipolar disorder (Gale et al.,      indicates that most highly powered studies have failed to
2013), depression (Penney et al., 2015), and elevated         detect robust, nonlinear effects of cognitive ability. Despite
levels of dysfunctional personality traits (Matta et al.,     the consistency of these results, however, this work
2019). Several of these past findings imply a “too much       focused only on a narrow set of outcomes (e.g., occupa-
of a good thing” effect (TMGT; Grant & Schwartz, 2011)        tional or educational outcomes). Therefore, it is unclear
in which greater cognitive ability may be beneficial at       whether there are any robust, nonlinear effects for cogni-
lower levels but potentially maladaptive at extremely         tive ability among other important outcome measures.
high levels of ability.
   Before drawing any firm conclusions from some of
                                                              Present Study
these past findings, however, note that several of these
studies included nonrepresentative samples and had            To address this knowledge gap with the hope that evi-
relatively low statistical power. For example, in two         dence can help inform practice, policy, or public under-
studies, claims that high cognitive ability is related to     standing, we empirically tested several popular beliefs
a greater risk of maladaptive psychological functioning       about the effects of cognitive ability. We designed this
were based on a between-groups comparison of Ameri-           study to make several unique contributions to the exist-
can Mensa members and nonrandom control groups                ing body of research. First, we explored linear and
(Karpinski et al., 2018; Matta et al., 2019). Not only is     nonlinear effects of cognitive ability across a wide vari-
selection bias an alternative explanation for the study       ety of occupational, educational, health, and social out-
results, but also, without a direct measure or proxy of       comes to extend the findings of previous work. Second,
cognitive ability, it is unclear whether these group dif-     not only did we search for nonlinear cognitive ability
ferences should be attributed to differences in cognitive     effects, but also we estimated whether ideal cognitive
ability. Likewise, Antonakis and colleagues (2017)            ability scores (as identified by the inflection point of
detected an inverted U-shaped relationship between a          the quadratic model) are consistently observed across
leader’s cognitive ability and leadership (according to       different outcomes and different cohorts. These esti-
ratings given by their subordinates) among a sample of        mates could help identify whether there is a common
379 leaders. Yet these effects were not found in other        cognitive ability threshold in which scores beyond a
studies that used larger samples and objective measures       certain point provide little added benefit or possibly
of leadership (Daly et al., 2015; Reitan & Stenberg, 2019).   even increase risk. Third, we explicitly tested several
   In contrast, past studies using larger data sets have      specific hypothesized thresholds and potential forms
generally found either a linear or a mostly linear effect     of “reversal,” including IQ thresholds of 100 and 120,
of cognitive ability. For example, Sackett and colleagues     and reversals of linear trends at the top 10% or 5% of
(Arneson et al., 2011; Coward & Sackett, 1990) have           IQ scores. Finally, we used data from four different
reported positive linear effects of cognitive ability on      longitudinal survey projects—the Wisconsin Longitudinal
performance in occupational and educational settings.         Survey (WLS; Herd et al., 2014), the 1970 British Cohort
Although Sackett and colleagues found statistically sig-      Study (BCS70; Elliott & Shepherd, 2006), the NLSY79
nificant quadratic effects, the ability-performance rela-     (Bureau of Labor Statistics, 2019a), and the NLSY97
tionships remained monotonically positive across the          (Bureau of Labor Statistics, 2019b)—to determine
entire ability range. These patterns were replicated          whether any observed nonlinear effects are robust to
across four large data sets (Project A, Project Talent,       differences across cohorts. Data from these projects
National Education Longitudinal Study [NELS] 88, and          have been used to study the linear effects of cognitive
data from the College Board). More recently, T. R. Coyle      ability ( Judge, Klinger, & Simon, 2010) but have rarely
(2015) observed similar results when investigating the        been used to search for nonlinear effects (for an excep-
relationships between cognitive ability and grade point       tion, see T. R. Coyle, 2015). Each project administered
average (GPA) across two different cohort samples             a multifactor cognitive test during adolescence to about
(National Longitudinal Survey of Youth 1997 [NLSY97],         10,000 participants and longitudinally tracked various
N = 1,950; the College Board Validity study, N = 160,670).    outcomes during the participants’ lives. Participants in
In addition, Ganzach et al. (2013) found that cognitive       each sample were randomly selected to be representa-
ability was positively related to pay and that nonlinear      tive of the state or country at the time, which reduces
effects could be detected but only after controlling for      the potential for selection bias relative to other primary
the interaction between ability and job complexity.           studies. These samples also provide a high degree of
Likewise, Ganzach (1998) also observed practically no         statistical power and allow us to attempt constructive
nonlinear effect of cognitive ability on self-reported job    replications across different cohorts, countries, or mea-
satisfaction within the National Longitudinal Survey of       sures gathered at different points in time (e.g., Lykken,
Youth 1979 (NLSY79) cohort study. This past research          1968).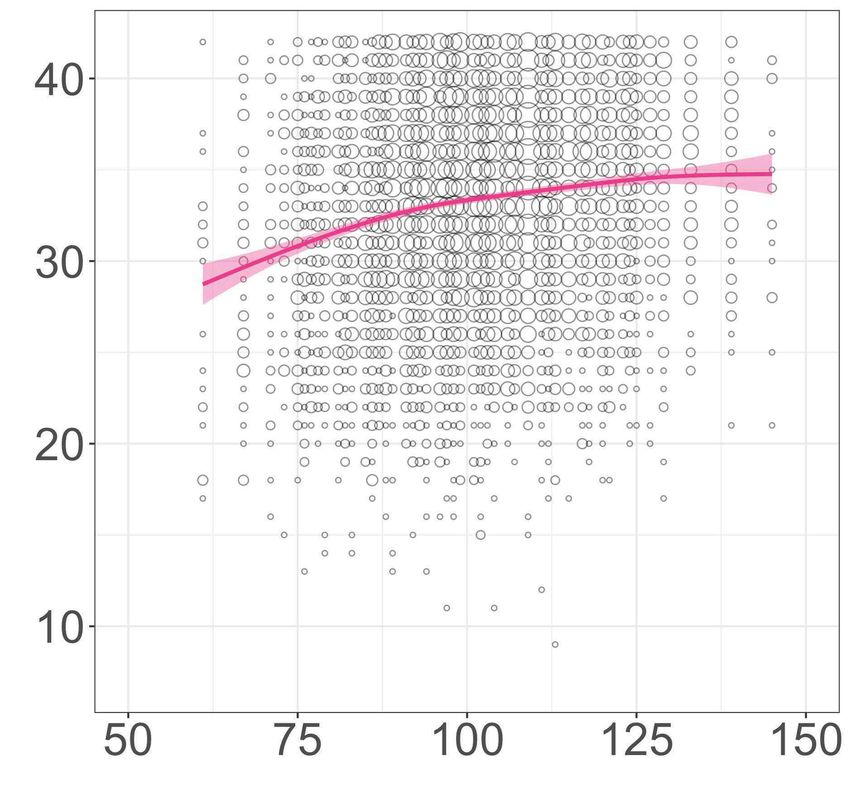
6                                                                                                       Brown et al.

Method                                                     ability for NLSY97 participants. Unlike the NLSY79, the
                                                           AFQT scores for the NLSY97 were not officially scored by
Data                                                       the Department of Defense but are based on the same
We gathered data from four different longitudinal sur-     subtest scores. Scores from the remaining six subtests
vey projects. The WLS consists of 10,317 students who      (general science, coding speed, mechanical comprehen-
were randomly sampled from high schools in the state       sion, electronics information, mathematics knowledge,
of Wisconsin and was funded by the National Institute      and auto and shop information) are not included as
on Aging. All WLS participants graduated from high         part of the AFQT score.
school in 1957 and were subsequently surveyed in              Participants in the BCS70 completed a shortened
1975, 1992, 2004, and 2011 (Herd et al., 2014). The        version of the Edinburgh Reading Test (ERT) and the
BCS70 consists of 16,571 participants who were all born    Friendly Maths Test (FMT) at age 10. The short version
in England, Scotland, Wales, or Northern Ireland in a      of the ERT consisted of 67 questions on topics including
specific week in 1970 (Elliott & Shepherd, 2006). These    vocabulary, syntax, reading comprehension, and reten-
individuals have been contacted for follow-up surveys      tion. The FMT consisted of 67 items that covered arith-
starting at age 10 (1980) and most recently at age 46      metic, fractions, number skills, geometry, algebra, and
(2016). The NLSY79 consists of a nationally representa-    statistics. Scores from these assessments were z-scored
tive sample of 12,686 U.S. participants who were born      and aggregated into a unit-weighted composite to mea-
between 1957 and 1964. Individuals in the NSLY79           sure cognitive ability. Verbal and math test scores were
cohort have participated in 26 follow-up surveys           combined to mirror the test content used in both NLSY79
between 1980 and 2016. Likewise, the NLSY97 consists       and NLSY97.
of a nationally representative sample of 8,984 U.S. par-
ticipants who were born between 1980 and 1984. Indi-       Occupational and educational outcomes
viduals in the NLSY97 cohort have participated in 17
follow-up surveys between 1998 and 2016. Both the          The first class of outcome variables that we investigated
NLSY79 and NLSY97 were sponsored and directed by           was related to educational and work experiences. We
the U.S. Bureau of Labor Statistics and managed by the     used annual income from wages and salary as a mea-
Center for Human Resource Research (CHRR) at the           sure of extrinsic career success (e.g., Judge, Klinger, &
Ohio State University. Interviews were conducted by        Simon, 2010). We also used measures of occupational
the National Opinion Research Center (NORC) at the         prestige and job complexity to capture occupational
University of Chicago. We provide a full listing of all    attainment. Leadership experience was assessed using
variables that we used from each project in the Supple-    dichotomous measures of supervisor role occupancy
mental Material available online.                          (“Do you supervise the work of others?”) and span of
                                                           supervisory control (number of direct reports; Li et al.,
                                                           2011). We also included annual measures of employ-
Cognitive ability                                          ment status as the number of weeks that the participant
All participants in the WLS completed the Henmon-          was unemployed. Job satisfaction was assessed using
Nelson Test of Mental Abilities (HN) while attending       a single item (e.g., “All things considered, how satisfied
high school. The HN is a 30-min test that consists of 90   are you with your job as a whole?”) or various, multiple-
items. HN content includes items designed to measure       item scales. Educational attainment was measured as
verbal, spatial, and numerical knowledge and reasoning     the number of years of completed formal education in
(cf. Stephan et al., 2018). Past research has reported     the WLS, NLSY79, and NLSY97. Educational attainment
strong correlations between HN scores and other stan-      in the BCS70 was assessed using the highest level of
dardized cognitive measures, including the Weschler        National Vocational Qualification (NVQ), which ranges
Adult Intelligence Scale (Watson & Klett, 1975).           from 0 (no qualifications) to 5 (higher postsecondary
   Participants in the NLSY79 and NLSY97 completed         degrees and equivalent).
forms of the Armed Services Vocational Aptitude Battery
(ASVAB). In line with past research, we used scores
from the Armed Forces Qualification Test (AFQT) as a
                                                           Health and well-being outcomes
measure of cognitive ability for NLSY79 participants       The second class of outcome variables that we investi-
(e.g., Berry et al., 2006). AFQT scores were calculated    gated was related to health conditions and self-reported
by the U.S. Department of Defense using four of the        well-being. We included dichotomous measures of vari-
10 ASVAB subtests (arithmetic reasoning, mathematics       ous health conditions that have been previously linked
knowledge, word knowledge, and paragraph compre-           to cognitive ability (e.g., diabetes and high blood pres-
hension). To be consistent with data from the NLSY79,      sure; Wraw et al., 2016). Sleep quality was assessed
we also used AFQT scores as a measure of cognitive         using reports of the typical number of hours slept and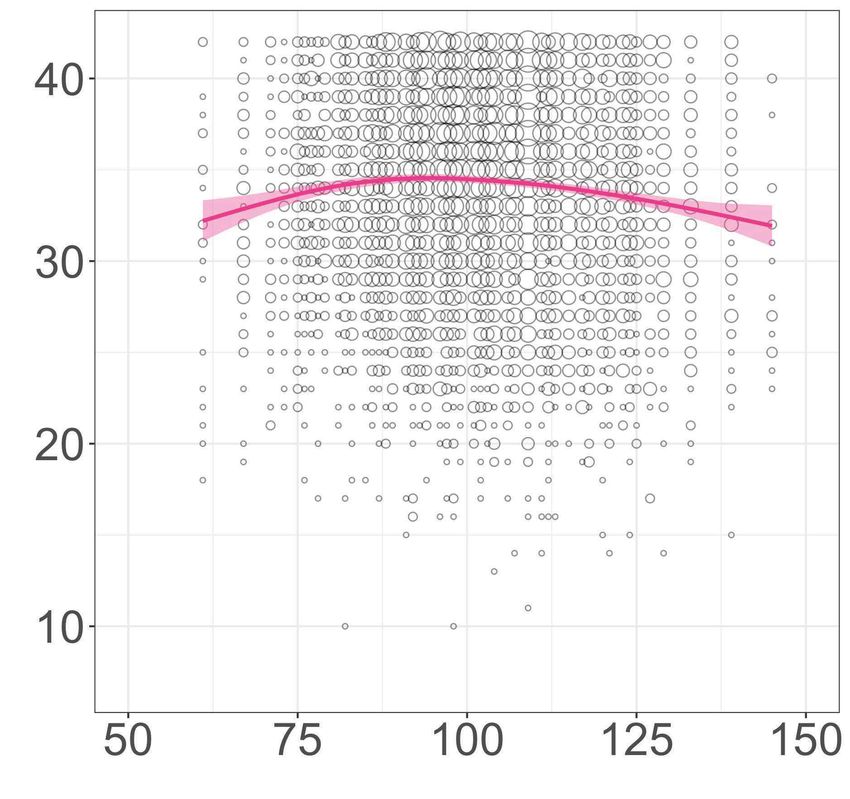
Too Smart                                                                                                              7

reports of trouble sleeping. Physical health was mea-           Of the 214 possible relationships between cognitive
sured using the body mass index (BMI). Self-reported         ability and life outcomes across the four cohort studies,
mental and physical health was measured in the NLSY79        we detected only six statistically significant U-shaped
and WLS using the Short-Form Health Survey (SF-12;           effects. More importantly, we observed only two inverted
Ware et al., 1996). In the BCS70, self-reported health was   U-shaped effects in which cognitive ability had a negative
measured using the SF-36 and the Warwick Edinburgh           effect at high ability levels. For cognitive ability scores
Mental Well-Being scale (Tennant et al., 2007). Self-        greater than −0.2 SD (IQ = 97), we observed a negative
reported depression was measured using short forms           relationship between ability and self-reported positive
of the Center for Epidemiological Studies Depression         relations with others (b = −0.05, z = 5.53, p < .001). How-
symptoms index (Kohout et al., 1993) and Rutter’s            ever, this nonlinear effect was weak in magnitude (incre-
Malaise inventory (Rutter et al., 1970). Subjective well-    mental R2 = .007) and could not be found for any of the
being was measured using the six-dimensional scale           five other psychological well-being dimensions measured
developed by Ryff and Keyes (1995) and several one-          in the WLS cohort (Fig. 1). Likewise, we observed a nega-
item measures of life satisfaction.                          tive relationship between ability and supervisory span
                                                             (the number of direct reports for participants holding a
                                                             supervisory role) in the NLSY79 cohort. Here, the effect
Social outcomes                                              of cognitive ability was negative among individuals with
The third class of outcome variables that we investi-        cognitive scores greater than 0.27 SD (IQ = 104; b = −0.27,
gated was related to social behaviors. This included         z = 2.69, p = .007), but this effect was also weak (incre-
counts of the number of times spent with friends and         mental R2 = .005) and could not be replicated in any of
relatives within the past 4 weeks and the number of          the other leadership outcomes in the NLSY79, WLS, or
social groups in which the participant was an active         BCS70 (Fig. 2). In contrast, four of the six U-shaped
member during the past year. Civic participation was         effects indicated stronger positive effects at higher levels
also assessed as whether the participant reported voting     of cognitive ability. We found these effects only for the
in local or national political elections (e.g., Hauser,      average number of hours slept per night (NLSY97) and
2000). Volunteering was assessed using dichotomous           one instance of job satisfaction (NLSY79). However, these
measures of whether the participant reported participat-     U-shaped effects were not found in any other instance
ing in volunteer work within the past year. Regarding        of either outcome across the different cohorts (Figs. 3
marital status, we coded whether participants were ever      and 4). Given these results, there does not appear to be
married and whether they were ever divorced.                 any evidence for a consistent inverted-U or TMGT effect
                                                             for cognitive ability that can be detected beyond chance.
Results
                                                             Polynomial regression
We conducted a variety of statistical tests and compari-
sons to determine whether any detrimental effects of         Although the two-lines test is considered to be a more
cognitive ability could be detected using conservative       rigorous test for detecting U-shaped effects, because it
or liberal criteria (e.g., Karwowski & Gralewski, 2013).     relies on two independent tests both achieving statisti-
We first tested for U-shaped effects using the two-lines     cal significance, we further explored potential nonlinear
test (Simonsohn, 2018). The two-lines test is designed       relationships between cognitive ability and life out-
to detect the presence of a U-shaped quadratic effect        comes using polynomial regression ( J. Cohen et al.,
within the observed range of predictor values. Thus,         2003). This method provides effect size estimates for
we used this test as our primary criteria for detecting      the nonlinear term (∆R2) and is widely used to test for
the presence of a meaningful U-shaped effect of cogni-       nonlinear effects in psychological research (e.g.,
tive ability. This method first estimates a cubic spline     Arneson et al., 2011; Nickel et al., 2019). We standard-
for the relationship between predictor and outcome           ized all variables before entering them into each of the
variables and then uses interrupted regression to esti-      regression models. We used several types of regression
mate the linear effect of the predictor above and below      models depending on the distribution of the outcome
the inflection point. A U-shaped effect is detected when     variable. For dichotomous outcomes, such as health
the signs of the linear effects above and below the          conditions or supervisory role, we used binomial logis-
inflection point are different (e.g., positive before the    tic regression. For count variables with long tails (e.g.,
break point and negative after the break point) and are      power law distributions; Joo et al., 2017), such as the
both statistically significant (p < .05). According to       number of depression symptoms, we used Poisson
Simonsohn (2018), this test yields fewer false positives     logistic regression. We used linear regression for out-
compared with other existing methods.                        comes with relatively normal distributions. We also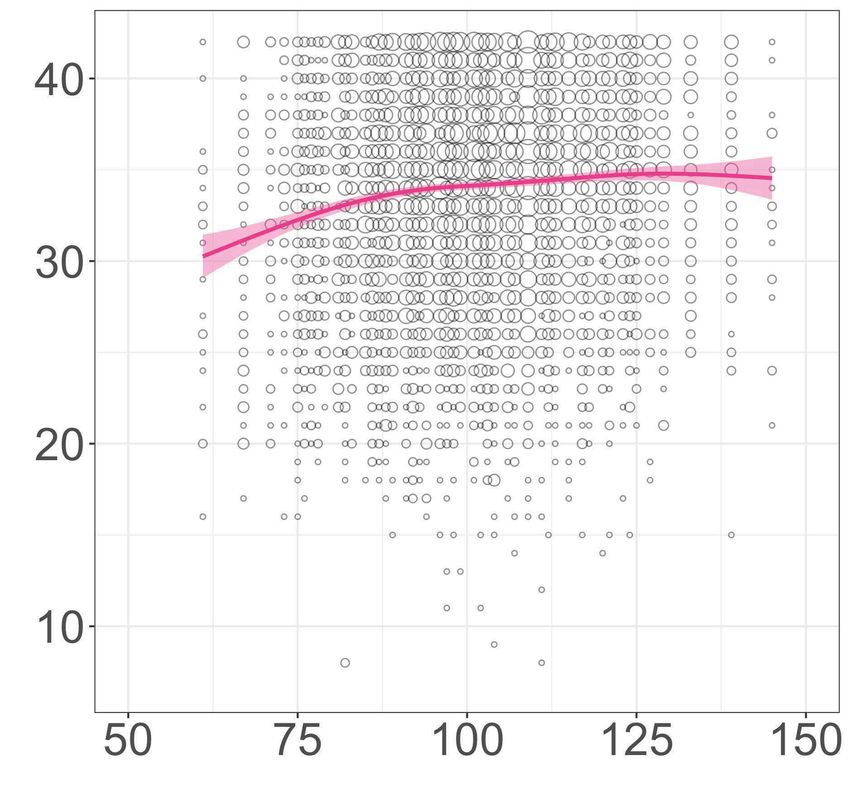
8                                                                                                                Brown et al.

    a                                                       b
                        Positive Relations                                     Self-Acceptance
          40                                                     40

          30                                                     30

          20                                                     20

          10                                                     10

               50       75      100       125      150                50      75       100      125      150
                        Linear R 2 = .001                                      Linear R 2 = .004
                       Quadratic R 2 = .007                                   Quadratic R 2 = .002
    c                                                       d
                         Personal Growth                                        Purpose in Life

          40                                                     40

          30                                                     30

          20                                                     20

          10                                                     10

               50       75      100      125      150                 50      75      100       125      150
                                   2                                                     2
                         Linear R = .029                                       Linear R = .011
                        Quadratic R 2 = .003                                  Quadratic R 2 = .002

    e                                                        f
                     Environmental Mastery                                         Autonomy
          40                                                     40

          30                                                     30

          20                                                     20

          10                                                     10

               50       75      100      125      150                 50      75       100      125      150
                         Linear R 2 = .001                                     Linear R 2 = .022
                        Quadratic R 2 = .004                                  Quadratic R 2 < .001

    Fig. 1. Locally weighted regression plots for psychological well-being regressed on cognitive abil-
    ity. Each plot represents the observed relationship for each dimension of psychological well-being in
    the Wisconsin Longitudinal Survey (WLS; Herd et al., 2014) cohort. A significant U-shaped effect was
    detected for Positive Relations with Others but not for any of the five remaining well-being dimen-
    sions. Moreover, no U-shaped or practically significant nonlinear effects were found for life satisfaction
    measures in the 1970 British Cohort Study (BCS70; Elliott & Shepard, 2006), the National Longitudinal
    Survey of Youth 1979 (NLSY79; Bureau of Labor Statistics, 2019a), or the National Longitudinal Survey
    of Youth 1997 (NLSY97; Bureau of Labor Statistics, 2019b).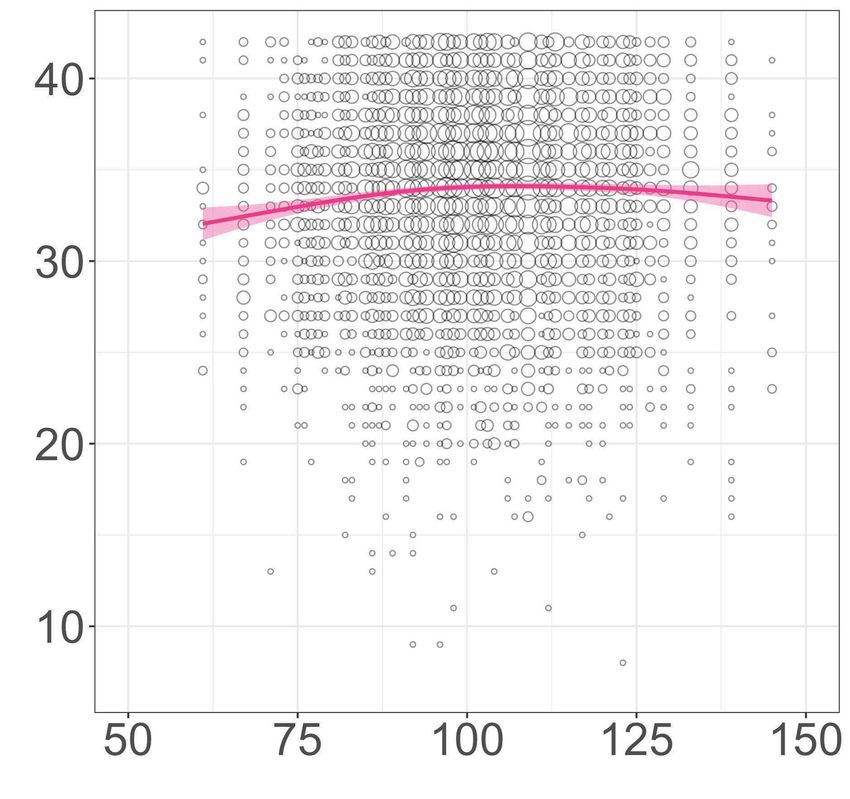
Too Smart                                                                                                                    9

                 a                                                  b
                                    NLSY79 (1988)                                       NLSY79 (1990)
                     50                                                  50

                     40                                                  40

                     30                                                  30

                     20                                                  20

                     10                                                  10

                      0                                                   0
                          60      80       100      120      140              60      80       100      120      140
                                   Linear R 2 < .001                                   Linear R 2 = .002
                                  Quadratic R 2 = .001                                Quadratic R 2 = .004

                 c                                                   d
                                    NLSY79 (1996)                                       NLSY79 (1998)
                     50                                                  50

                     40                                                  40

                     30                                                  30

                     20                                                  20

                     10                                                  10

                      0                                                   0
                          60      80       100      120      140              60      80       100      120      140
                                             2                                                   2
                                   Linear R = .001                                     Linear R = .006
                                  Quadratic R 2 = .005                                Quadratic R 2 = .002

                 Fig. 2. Locally weighted regression plots for number of subordinates regressed on cognitive abil-
                 ity. Each plot represents the observed relationship for all four instances of this outcome within the
                 National Longitudinal Survey of Youth 1979 (NLSY79; Bureau of Labor Statistics, 2019a) cohort. A
                 significant U-shaped effect was detected for data from 1996 but was not replicated in either of the
                 three remaining time periods.

performed a logarithmic transformation for annual                     significance (Funder & Ozer, 2019; Gignac & Szodorai,
income, as commonly used in past research (e.g., Warren               2016). In both articles, the authors recommended that
et al., 2002). We present a summary of the regression                 an effect of r = .10 (which translates to R2 = .01) be
results organized by outcome category and cohort in                   interpreted as a small but potentially consequential
Table 3. For each outcome, we calculated the sample-                  effect. In common language effect size terms, an increase
weighted mean R 2 as recommended by Hunter and                        from R2 = .00 to .01 represents an improvement in the
Schmidt (2004). A full account of all regression models               probability of correct classification from 50% to 53%
can be found in the Supplemental Material.                            (Dunlap, 1994). Results for each individual regression
   Given our large sample sizes, we relied on effect sizes            model are all reported in the Supplemental Material.
(incremental R2) to determine whether a meaningful                    Overall, we failed to find a single instance in which the
nonlinear effect is present. Given recent guidelines for              polynomial cognitive ability term accounted for more
psychological and individual differences research, we                 than 1% of incremental variance in any outcome. Even
consider effects of R2 = .01 or greater to be of practical            after rounding adjusted R2 estimates to two decimal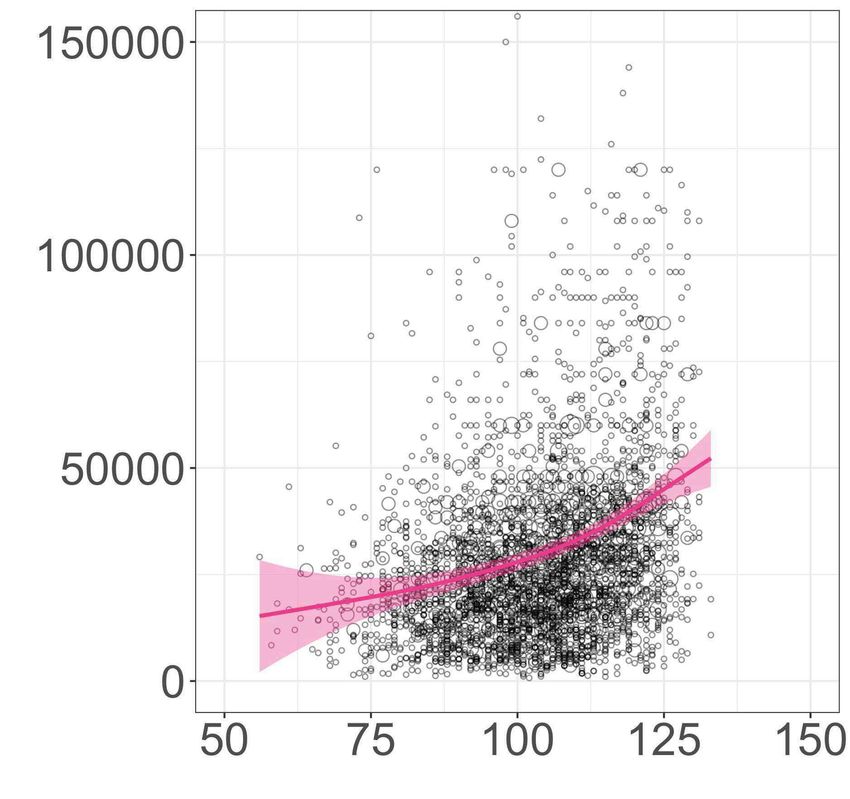
10                                                                                                                        Brown et al.

                 a                                                    b
                                      WLS (2011)                                           BCS70 (2016)
                     15                                                   15

                     10                                                   10

                      5                                                    5

                      0                                                    0
                          60     80       100      120       140               50     75       100       125      150
                                   Linear R 2 < .001                                    Linear R 2 = .002
                                  Quadratic R 2 < .001                                 Quadratic R 2 < .001

                 c                                                    d
                                  NLSY79 (Age 50)                                        NLSY97 (2010)
                     15                                                   15

                     10                                                   10

                     5                                                     5

                     0                                                     0
                          60     80       100      120      140                60     80       100      120       140
                                   Linear R 2 = .003                                   Linear R 2 < .001
                                  Quadratic R 2 = .001                                Quadratic R 2 = .007

                 Fig. 3. Locally weighted regression plots for sleep habits (reported number of hours slept) regressed
                 on cognitive ability. Each plot represents the strongest nonlinear effect found within each cohort.
                 Several significant U-shaped effects were found within the National Longitudinal Survey of Youth 1997
                 (NLSY97; Bureau of Labor Statistics, 2019b) cohort (typical hours slept per night in 2010, 2011, and
                 2015 survey waves) but were not replicated in either of the three remaining studies. WLS = Wisconsin
                 Longitudinal Survey (Herd et al., 2014); BCS70 = 1970 British Cohort Study (Elliott & Shepherd, 2006).

places, we found that adding the polynomial term met                  positive effect in which ability grew more strongly
our threshold for practical significance in only 5% of all            related to education at increasingly higher levels of abil-
of the regression models tested (11 out of 214; Table 3).             ity. This effect was similar to models reported by Arneson
Beyond the six U-shaped effects that we found using the               et al. (2011) and T. R. Coyle (2015) but were not repli-
two-lines test, we detected nonlinear effects for cognitive           cated in the three other cohorts (Fig. 5).
ability on annual income for participants in the NLSY97.                  In contrast, we detected practically significant linear
These effects were similar to the nonlinear effects                   effects in 66% of all models (141 out of 214). We illus-
reported by Ganzach et al. (2013), but nonlinear effects              trate the average linear and nonlinear effects by out-
on income could not be replicated in any of the remain-               come in Figure 6. We observed the strongest positive
ing cohorts (Fig. 5). We also detected a nonlinear effect             linear effects of cognitive ability among educational
of ability on educational attainment within the BCS70                 and occupational outcomes, including educational
cohort. In this relationship, we observed an increasingly             attainment (mean R 2 = .254), occupational attainment
Too Smart 11
a b
WLS (1975) BCS70 (2012)
4 5
4
3
3
2
2
1 1
50 75 100 125 150 50 75 100 125 150
2 2
Linear R = .001 Linear R = .001
Quadratic R 2 < .001 Quadratic R 2 < .001
c NLSY79 (2014)
d NLSY97 (2016)
4 5
4
3
3
2
2
1 1
50 75 100 125 150 50 75 100 125 150
2 2
Linear R < .001 Linear R = .006
Quadratic R 2 = .001 Quadratic R 2 = .001
Fig. 4. Locally weighted regression plots for job satisfaction regressed on cognitive ability. Each plot
represents the strongest nonlinear effect observed within each cohort study. A significant U-shaped
effect was detected in National Longitudinal Survey of Youth 1979 (NLSY79; Bureau of Labor Statistics,
2019a) job-satisfaction ratings in 2014 but was not replicated in either of the three remaining cohorts.
WLS = Wisconsin Longitudinal Survey (Herd et al., 2014); BCS70 = 1970 British Cohort Study (Elliott
& Shepherd, 2006).
(mean R 2 = .155), and annual income (mean R 2 = .064). Further comparisons
Among social outcomes, individuals with higher cogni-
tive ability were more likely to report working as a Despite finding little evidence for robust nonlinear
volunteer (mean R 2 = .032) and were more likely to effects across the ability range, we continued to test for
vote in elections (mean R 2 = .013). Likewise, individuals differences in the predictive validity of cognitive ability
with higher cognitive ability were slightly less depressed scores above and below certain points along the ability
(mean R 2 = .029) and reported more frequent physical range. This methodology has been used by researchers
exercise (mean R 2 = .015). We also found that ability to test threshold hypotheses in which the effect of
had practically no linear effect on self-reported subjec- cognitive ability ceases or changes direction beyond a
tive well-being, job satisfaction, or sleep habits. There- specific point on the ability range (Karwowski &
fore, we suggest that the predominant effect of cognitive Gralewski, 2013). This analysis was prompted in part
ability is linear and that nonlinear effects are practically by recent arguments by Taleb (2019) that cognitive
negligible for many important life outcomes. ability tests mainly measure “extreme unintelligence”12 Brown et al.
Table 3. Summary of Polynomial Regression Results by Outcome
Category
Linear Quadratic
Variable k Mean n R2 ∆R 2
Educational and occupational
Educational attainment 4 7,132 .254 .001
Occupational attainment 10 5,498 .155 .000
Annual income (log) 27 4,899 .064 .002
Unemployment 16 6,363 .051 .001
Leadership 13 5,520 .012 .000
Job satisfaction 16 6,296 .002 .000
Health and well-being
Depression 9 6,969 .029 .002
Physical exercise 11 6,299 .015 .000
Self-reported health 16 6,328 .011 .001
Body mass index 13 6,233 .011 .000
Subjective well-being 12 6,465 .006 .002
Sleep habits 14 6,290 .004 .002
Health conditions 12 6,068 .004 .000
Social
Volunteering 9 6,037 .032 .000
Civic participation 11 5,793 .022 .000
Social participation 13 6,283 .013 .001
Marital status–divorced 4 5,857 .007 .002
Marital status–married 4 7,775 .007 .002
Note: k = number of outcomes tested. All R 2 estimates are sample weighted.
and that “‘[very] low IQ’ may provide information; while ability remained relatively constant above or below
‘very high IQ’ may convey nothing better than random.” average ability for many of our outcome variables.
Likewise, regarding the relationship between cognitive There was no instance in which we found a negative
ability and income, Rothwell (2019) recently claimed (harmful) effect of cognitive ability among those with
that “changes in IQ matter less at the top than at the above average ability. Likewise, we observed only three
bottom” (p. 74). This notion is similar to Spearman’s instances in which there was a negative (harmful)
law of diminishing returns (Blum & Holling, 2017), in effect of cognitive ability for those with relatively high
which the g-factor is often found to be more strongly ability (> 120). However, these correlations were rela-
related to cognitive task performance among individu- tively weak in magnitude. We also observed that
als with lower ability. Likewise, several popular writers restricting the samples on the basis of a threshold of
have alluded to an ideal-IQ threshold of 120, which 120 (> 120; = +1.33 SD) substantially reduced the vari-
they sometimes attribute to notable academic research- ance in ability scores. The variability in scores among
ers such as Arthur Jensen or J. P. Guilford. For example, participants above 120 was between 16% (NLSY97) and
Gladwell (2008) wrote that “once someone has reached 39% (BCS70) of the standard deviation of scores among
an IQ of somewhere around 120, having additional IQ the full samples. This direct range restriction is a likely
points doesn’t seem to translate to any measurable, explanation for the slight decrease in correlation size
real-world advantage” (pp. 78–79). Likewise, some (Hunter & Schmidt, 2004). Given these results, greater
researchers have also claimed the existence of a thresh- cognitive ability does not cease to remain beneficial
old of 120 when studying the relationship between for individuals with above average ability or with
intelligence and creativity (e.g., Andreasen, 2014). scores greater than IQ = 120.
Therefore, we calculated the correlations between cog- Finally, to check the possibility that only very high
nitive ability and our outcome measures after dividing intelligence is detrimental, we tested for outcome dif-
our samples above and below possible thresholds at ferences between individuals within the top 10% and
IQ = 100 and IQ = 120. top 20% of ability scores. This methodology has been
We report a summary of these results in Table 4. A used in past research on ability differences among
full account of all correlation results can be found in the highly gifted students (e.g., Wai et al., 2005). We per-
Supplemental Material. The average effect of cognitive formed a median split within each group (top 10% anda b c d
WLS (1974) BCS70 (2008) NLSY79 (2004) NLSY97 (2011)
150000 125000
50000 150000
40000 100000
100000 100000
30000 75000
20000 50000
50000 50000
10000 25000
0 0 0 0
50 75 100 125 150 50 75 100 125 150 50 75 100 125 150 50 75 100 125 150
2 2 2 2
Linear R = .019 Linear R = .073 Linear R = .104 Linear R = .085
Quadratic R 2 = .002 Quadratic R 2 = .004 Quadratic R 2 = .002 Quadratic R 2 = .008
e f g h
WLS BCS70 NLSY79 NLSY97
20 5 20 20
4
18 15 15
3
16 10 10
2
14 5 5
1
12 0 0 0
60 80 100 120 140 50 75 100 125 150 60 80 100 120 140 60 80 100 120 140
2 2 2 2
Linear R = .199 Linear R = .177 Linear R = .344 Linear R = .303
Quadratic R 2 = .002 Quadratic R 2 = .006 Quadratic R 2 < .001 Quadratic R 2 = .001
Fig. 5. Locally weighted regression plots for annual income (top) and educational attainment (bottom) regressed on cognitive ability. Annual income is displayed in dollars (or pounds)
without a log transformation. A practically significant nonlinear effect was found for annual income within the National Longitudinal Survey of Youth 1997 (NLSY97; Bureau of Labor
Statistics, 2019b) cohort (survey waves 2008, 2009, 2010, and 2011) but not in any of the remaining three cohorts. Educational attainment is reported in number of years (Wisconsin
Longitudinal Survey [WLS; Herd et al., 2014], National Longitudinal Survey of Youth 1979 [NLSY79; Bureau of Labor Statistics, 2019a], and NLSY97) or using the National Vocational
Qualification (NVQ; 1970 British Cohort Study [BCS70; Elliott & Shepard, 2006]. A practically significant nonlinear effect was found for educational attainment in the BCS70 but not in
any of the remaining cohorts.
1314 Brown et al.
Educational Attainment
Occupational Attainment
Annual Income (log)
Unemployment
Volunteering
Depression
Civic Participation
Physical Exercise
Social Participation
Leadership
Self-Reported Health
Body Mass Index
Marital Status–Divorced
Marital Status–Married
Subjective Well-Being
Sleep Habits Linear
Health Conditions Quadratic
Job Satisfaction
0% 5% 10% 15% 20% 25% 30%
Percentage of Variance Explained
Fig. 6. Summary of linear and nonlinear cognitive ability effects by outcome. Red
bars represent the percentage of variance explained (R2) by the linear effect of
cognitive ability. In approximately 90% of all models, linear effects indicated that
greater cognitive ability is predicted to yield better occupational, educational, health,
or social outcomes (194 of 214 models). Offset black bars represent the incremental
percentage of variance accounted for by the quadratic effect of cognitive ability.
top 20%) and compared outcome scores for individuals even when using more liberal statistical tests. Not only
above or below the median using a simple t test or χ2 test is the overall relationship mostly linear in nature, but
of proportions. In only a minority of cases did we detect also our results suggest that extremely high ability is
a significant difference (p < .05) within the top 10% (20 more likely to be an extra advantage rather than a sur-
out of 214 comparisons, 9%) or top 20% (48 out of 214 prising limitation.
comparisons, 22%) of cognitive ability scores. Among the
rare instances in which we did find a difference, higher
Discussion
cognitive ability was associated with worse outcomes
only 13% of the time (9 out of 68 comparisons). Instead, By analyzing data from four representative longitudinal
greater cognitive ability was often associated with cohort studies (three in the United States and one in
greater occupational prestige (50% of comparisons) and the United Kingdom) spanning more than 60 years, we
greater educational attainment (100% of comparisons) found that greater cognitive ability typically provides
even within the top 20% or 10% of cognitive ability an advantage for the attainment of various educational,
scores. These results further indicate that the effect of occupational, health, or social outcomes. More cogni-
cognitive ability is highly unlikely to change direction tive ability typically appears to be advantageous even
and turn from positive to negative within the right tail at high ability levels. As often observed in past researchToo Smart 15
Table 4. Sample Weighted Correlations Below and Above
Theorized Cognitive Ability Thresholds
Threshold Threshold
IQ = 100 IQ = 120
Variable Below Above Below Above
Educational and occupational
Educational attainment .267 .340 .418 .168
Occupational attainment .210 .240 .330 .108
Annual income (log) .137 .145 .209 .068
Unemployment −.081 −.054 −.121 −.018
Leadership .059 .066 .105 .019
Job satisfaction .008 .000 .017 −.005
Health and well-being
Depression −.106 −.054 −.148 −.022
Physical exercise .088 .075 .091 .010
Self-reported health .075 .038 .086 −.002
Body mass index −.038 −.057 −.080 −.026
Subjective well-being .026 .025 .041 −.007
Sleep habits −.008 .052 .027 .019
Health conditions −.033 −.023 .005 −.003
Social
Volunteering .069 .104 .166 .051
Civic participation .089 .084 .137 .019
Social participation .045 .029 .050 −.017
Marital status–divorced −.019 −.070 −.049 −.051
Marital status–married .083 .018 .077 .006
Note: All values are sample-weighted correlations; Sleep habit outcomes were all
coded such that greater values correspond to better sleep (more hours of sleep
or fewer problems sleeping).
(Beier & Oswald, 2012), we found that greater cognitive physical exercise, and being more likely to vote in elec-
ability appears to practically never be a bad thing. At tions and perform volunteer work.
worst, cognitive ability has only a weak or null effect on Across all outcomes, we generally observed that the
some of the outcomes that we observed. For example, magnitude of linear effects greatly outweighed the
although we found some negative correlations between incremental validity to be gained from adding a nonlin-
cognitive ability and job satisfaction, the sample- ear term. Even when there was practically no linear
weighted average effect size was practically zero (R 2 = effect of cognitive ability, we also failed to detect any
.002), which is in line with past reviews in which the consistent U-shaped or nonlinear effects. These results
effect of cognitive ability has been found to be highly suggest that it is unlikely that there are strong, underly-
mediated by job complexity and income (Ganzach, 1998; ing, U-shaped cognitive ability effects in which greater
Gonzalez-Mule et al., 2017). We also observed relatively ability becomes detrimental at high levels. It is more
weak effects of cognitive ability on leadership role often the case that cognitive ability either has a positive
occupancy, BMI, sleep habits, and health conditions. linear effect or practically no effect at all. Moreover, these
Adding a nonlinear term did little to improve the pre- small effect sizes indicate that most typical studies in
diction of these outcomes. These results suggest that psychological research likely lack the necessary statisti-
cognitive ability may be essentially unrelated to these cal power to reliably detect nonlinear effects (e.g.,
outcomes. On the other hand, we observed that indi- Sassenberg & Ditrich, 2019; Shen et al., 2011). Given
viduals with higher cognitive ability scores were not these results, we suggest that there is little evidence for
only likely to report greater income, shorter instances a meaningful nonlinear effect of cognitive ability on many
of unemployment, and higher occupational and edu- life outcomes.
cational attainment but also better outcomes in several Unlike some of the individual studies in which nega-
health and social domains. Individuals with higher cog- tive or threshold effects of cognitive ability have been
nitive ability generally reported experiencing fewer reported, our study has several methodological strengths.
depression symptoms, performing greater amounts of Our use of four large, longitudinal cohort samples16 Brown et al.
across the United States and United Kingdom provided modified organisms). The lack of acceptance of cogni-
a large degree of statistical power. This not only elimi- tive ability in education and other applied fields is also
nates power as an alternative explanation for a lack of worth considering (e.g., Maranto & Wai, 2020; Wai
nonlinear effects but also helps prevent the detection et al., 2018; Wiliam, 2019).
of spurious nonlinear effects due to a subset of extreme Another possible explanation for the resiliency of
outliers. A tendency of finding interactive or nonlinear these ideas about the role of cognitive ability could be
effects more easily in smaller samples was recently a tendency to misattribute people’s successes or fail-
observed by Van Iddekinge and colleagues (2018), who ures. This “misattribution hypothesis” was introduced
reported that larger multiplicative effects of cognitive by Nickel and colleagues (2019), who proposed that
ability and motivation were most often found in studies people might, for example, mistakenly identify high
with smaller, rather than larger, samples. In addition, conscientiousness as a cause of maladaptive behavior
the longitudinal design allowed us to test the effects of while overlooking the true cause for the behavior (e.g.,
cognitive ability measured in adolescence on outcomes low emotional stability). We believe that this hypothesis
later in life. This provides stronger evidence for the may also explain commonly held ideas regarding
causal direction of these relationships, compared with threshold or negative effects of extremely high cogni-
studies using cross-sectional designs (Cook et al., 1990). tive ability. Researchers and authors in the popular
Our samples also allowed us to observe whether effects press often highlight fictional depictions of highly intel-
found within one sample could be replicated in other ligent yet ineffective people as a way of expressing the
longitudinal samples collected at different points in negative effects of cognitive ability. For example, in The
time. Because our samples were representative of Social Animal, David Brooks (2011) described a fic-
broader regional or national populations and our data tional consulting firm that emphasizes intelligence
sets come from six decades and our respondents from when hiring new employees. As a result, the firm’s
multiple generations, we can have confidence in the consultants are overly eager to show off their intellect
generality of our results. Because of these characteris- but unable to develop lasting, profitable relationships
tics, we believe that our results provide an accurate with clients. Likewise, researchers have used the char-
representation of the likelihood of detecting nonlinear acter of Sheldon Cooper from the popular TV series
effects of cognitive ability on many important life The Big Bang Theory as an example of how overly high
outcomes. cognitive ability relative to your peers may negatively
affect their perceptions of you (e.g., Antonakis et al.,
Resilience of misconceptions about 2017). These examples appear to suggest that high intel-
ligence or cognitive ability causes people to be perceived
cognitive ability as aloof, arrogant, or generally antisocial. However,
Our findings indicate that popular ideas about the det- research indicates that cognitive ability is weakly associ-
rimental effects of high cognitive ability are not sup- ated with most personality traits (Ackerman & Heggestad,
ported by empirical data. However, we suspect that 1997; Carretta & Ree, 2018). In our opinion, the problems
these ideas may remain appealing to some people encountered by these characters—and their real-world
despite our research and similar reports from past stud- counterparts—are more plausibly explained by other
ies (e.g., Arneson et al., 2011). An important direction personality traits (e.g., low agreeableness, sociability, or
for future research is to identify potential causes for the empathy) than by high cognitive ability.
knowledge gaps between researchers, practitioners,
and the general public regarding cognitive ability. Past
Implications for research and practice
studies that have examined this question report that
people’s beliefs or attitudes about cognitive ability may It is also important to acknowledge that high cognitive
be driven by their own self-interest or values. One study ability does not at all guarantee success or beneficial
found that individuals who had higher GPAs and stan- outcomes in life. Across four longitudinal cohort stud-
dardized test scores (e.g., proxies for cognitive ability) ies, we found that even the strongest effects accounted
believed more strongly in the validity of cognitive abil- for only up to 25% of the variance in life outcomes.
ity (Caprar et al., 2016). In addition, Highhouse and These outcomes are determined by a multitude of fac-
Rada (2015) observed that people’s worldviews (e.g., tors beyond cognitive ability and other individual dif-
belief in scientific determinism) are correlated with ferences, including environmental factors, luck, and
their perceptions about the usefulness of cognitive abil- chance (Pluchino et al., 2018). Past research also dem-
ity testing. This is akin to broader trends in science in onstrates that cognitive ability scores still vary even
which perceptions among the general public are found among individuals within the highest levels of educa-
to conflict with those held within the scientific commu- tional or occupational attainment (e.g., Berry et al.,
nity (e.g., regarding the safety of vaccines or genetically 2006; Park et al., 2008; Sackett & Ostgaard, 1994).You can also read