CEP Discussion Paper No 1662 Revised January 2021 (Replaced revised August 2020 version) The Intellectual Spoils of War? Defense R&D, Productivity ...
←
→
Page content transcription
If your browser does not render page correctly, please read the page content below

ISSN 2042-2695

 CEP Discussion Paper No 1662
 Revised January 2021
 (Replaced revised August 2020 version)

 The Intellectual Spoils of War?
Defense R&D, Productivity and International Spillovers

 Enrico Moretti
 Claudia Steinwender
 John Van Reenen
Abstract We examine the impact of government funding for R&D - and defense-related R&D in particular - on privately conducted R&D, and its ultimate effect on productivity growth. We estimate longitudinal models that relate privately funded R&D to lagged government-funded R&D using industry-country level data from OECD countries and firm level data from France. To deal with the potentially endogenous allocation of government R&D funds we use changes in predicted defense R&D as an instrumental variable. In many OECD countries, expenditures for defense-related R&D represents by far the most important form of public subsidies for innovation. In both datasets, we uncover evidence of “crowding in” rather than “crowding out,” as increases in government-funded R&D for an industry or a firm result in significant increases in private sector R&D in that industry or firm. On average, a 10% increase in government-financed R&D generates a 5% to 6% additional increase in privately funded R&D. We also find evidence of international spillovers, as increases in government-funded R&D in a particular industry and country raise private R&D in the same industry in other countries. Finally, we find that increases in private R&D induced by increases in defense R&D result in productivity gains. Key words: R&D, defense, productivity, international spillovers JEL Codes: O31; O32; O38; H56; H57 This paper was produced as part of the Centre’s Growth Programme. The Centre for Economic Performance is financed by the Economic and Social Research Council. We thank the Economic and Social Research Council for their financial support through the Centre for Economic Performance. Patrick Warren has provided truly outstanding research assistance. Pierre Azoulay, Josh Lerner, Heidi Williams, and participants in many seminars have given helpful comments. Mirko Draca kindly made his data on US defense procurements available to us, which was invaluable. We are also grateful to Sharon Belenzon and David Thesmar for useful discussions and sharing their data with us. Enrico Moretti, Berkeley, NBER and CEPR. Claudia Steinwender, MIT, NBER, CEPR and Centre for Economic Performance, London School of Economics. John Van Reenen, MIT, LSE, NBER, CEPR and Centre for Economic Performance, London School of Economics. Published by Centre for Economic Performance London School of Economics and Political Science Houghton Street London WC2A 2AE All rights reserved. No part of this publication may be reproduced, stored in a retrieval system or transmitted in any form or by any means without the prior permission in writing of the publisher nor be issued to the public or circulated in any form other than that in which it is published. Requests for permission to reproduce any article or part of the Working Paper should be sent to the editor at the above address. E. Moretti, C. Steinwender and J. Van Reenen, revised 2021.
1 Introduction
 Given the central role that productivity plays in explaining economic growth, it is not surprising
that the search for the determinants of productivity has been central to modern economics. While a large
body of empirical research has argued that R&D is a key source of firm productivity growth (e.g. Aghion
and Howitt, 1992; Romer, 1990), the question of exactly which policies governments should adopt to
foster R&D investment is still largely an open question.
 In this paper, we study the impact of government funding for R&D on privately conducted and
financed R&D, and its ultimate effect on firm productivity growth. We use two complementary
longitudinal datasets—a country-industry-year-level dataset for OECD countries and a firm-year-level
dataset for France—to address two related questions. First, we estimate the effect of government-funded
R&D on private R&D—namely, R&D conducted and financed by private businesses. We are interested
in whether government-funded R&D in a given country and industry (or to a given firm) displaces or
fosters private R&D in the same country and industry (or firm). Having found evidence of a positive
effect, we next estimate how investment in R&D affects productivity. For both types of analysis, we
assess whether the benefits of public R&D investment are limited to a single country or spill over across
multiple countries.1
 To isolate the causal effect of government-funded R&D, we use arguably exogenous variation in
defense-related R&D. Defense-related R&D is an important but relatively understudied component of
public policy on R&D. It represents a key channel through which governments all over the world seek
to shape innovation. In the US, annual government defense-related R&D expenditures amounted to about
$78.1 billion in 2016, 57.2% of all government-funded R&D (Congressional Research Service, 2018).
While defense-related R&D is motivated by goals that are not mainly economic, it is often the most

1
 For a recent survey of the literature on the evaluation of innovation policies, see Bloom, Van Reenen, and Williams (2019).
The literature focuses on two types of R&D policies. First, there are fiscal policies towards R&D such as Hall (1993), Bloom,
Griffith, and Van Reenen (2002), Moretti and Wilson (2014), Dechezlepretre et al. (2019) and Rao (2016). This generally
finds positive effects. Second, there is a body of empirical research on the effect of public R&D on private R&D (e.g. David,
Hall, and Toole, 2000; Lach, 2002; Goolsbee, 1998; Wallsten, 2000). The results here are mixed – see for example the meta-
study of Dimos and Pugh (2016). There is a small number of recent papers that have clearer causal identification strategies,
but these papers tend to differ from ours in that they focus on single countries, different policy instruments, and different
outcomes than those we focus on. For example, Jacob and Lefgren (2011) and Azoulay et al. (2019a) study the effect of NIH
grants on publications and patenting; Bronzini and Iachini (2014) focus on the effect of R&D subsidies on capital investment
by Italian firms; Howell (2017) looks at Department of Energy SBIR grants on venture capital funding and patents; and
Slavtchev and Wiederhold (2016) study the effect of government procurement on innovation. Guellec and van Pottelsberghe
de la Potterie (2001) and Pless (2019) are rare exceptions that look at multiple types of R&D policies.

 2
important de facto industrial policy used by the federal government to affect the speed and direction of
innovation in the economy. The amount of public money flowing into defense R&D dwarfs the amount
spent on other prominent innovation policy tools in the US. For example, the total budget of the National
Science Foundation or the overall value of the federal R&D tax credit in a typical year are less than one
tenth of federal outlays for defense-related R&D (NSF 2006). Defense R&D is the single most important
component of government-funded R&D in the UK and France as well, and a major component of
government-sponsored R&D in many other developed economies.
 We begin our empirical analysis using a unique dataset that we constructed by linking detailed
information on defense-related and non-defense related government-funded R&D to information on
private R&D, output, employment, and salaries in 26 industries in all OECD countries over 23 years.
We estimate models that relate privately funded R&D in a given country, industry, and year to
government-funded R&D in the previous year, conditioning on a full set of country-industry and
industry-year fixed effects.
 We complement this industry-level analysis with a firm-level analysis based on a longitudinal
sample of firms that engage in R&D followed collected by the French Ministry of Research from 1980
to 2015. This is the only available dataset we know of that disaggregates public defense R&D subsidies
by firms across the whole economy. One advantage of using firm-level data is that we observe which
firms within an industry actually receive public R&D funds and which do not. The longitudinal nature
of the data allows us to control for firm fixed effects, absorbing all time invariant unobserved differences
across firms that may be systematically correlated with the propensity to invest in R&D. We compare
the same firm to itself in different moments in time and identification stems from the exact timing of the
public R&D award.
 In both the OECD data and the French data, we use predicted defense R&D as an instrumental
variable to isolate exogenous variation in public R&D. This instrument combines nationwide changes to
defense R&D with fixed allocations across industries. Predicted defense R&D provides arguably
exogenous variation because annual aggregate changes in defense spending reflect political and military
priorities that are largely independent of productivity shocks in different domestic industries. Wars,
changes of government, and terrorist attacks have had major influences on defense spending. In the US,
for example, military R&D spending ramped up under President Reagan; fell back after the end of the
Cold War, and rose again after 9/11. Importantly for our identification strategy, the impact that

 3
nationwide exogenous changes in military spending have on defense related R&D varies enormously
across industries, because some industries (e.g. aerospace) always rely more heavily on defense-funding
than others (e.g. textiles).2
 The sign of the effect of government-funded R&D on privately-funded R&D could be positive
or negative, depending on whether government-funded R&D crowds out or crowds in privately-funded
R&D. Crowding out may occur if the supply of inputs to the R&D process (specialized engineers, for
example) is inelastic within an industry and country (Goolsbee, 1998). In this case, the only effect of an
increase in government-funded R&D is to displace private R&D with no net gains for total R&D.
Crowding in may occur if (i) R&D activity involves large fixed costs and, by covering some of the fixed
 3
costs, government-funded R&D makes some marginal private sector projects profitable; (ii)
government-funded R&D in an industry generates technological spillovers that benefit other private
firms in the same industry; and/or (iii) firms face credit constraints.
 Empirically, we find strong evidence of crowding-in both the OECD and French datasets.
Increases in government-funded R&D generated by variation in predicted defense R&D translate into
significant increases in privately-funded R&D expenditures, with our preferred estimates of the elasticity
equal to 0.518. Our estimate implies that defense-related R&D is responsible for an important part of
private R&D investment in some industries. For example, in the US “aerospace products and parts”
industry, defense-related R&D amounted to $3,026 million in 2002 (nominal). Our estimates suggest
that this public investment results in $1,948 million of additional private investment in R&D.
Considering the total amount spent by the US government, we estimate that private R&D investment in
the US is $85 billion higher than the counterfactual with no government-funded defense R&D. Using
our estimates, we calculate that dollar-for dollar, publicly funded R&D generates twice as much overall
R&D compared to R&D tax credits.
 Our estimates also indicate that cross-country differences in defense R&D might play an
important role in determining cross-country differences in overall private sector R&D investment. For

2
 The idea of using military spending as an exogenous component of government spending has been used in other contexts.
In the analysis of fiscal multipliers Ramey (2011), Barro and Redlick (2011) and Nakamura and Steinsson (2014) have argued
for the importance of using defense spending to mitigate endogeneity concerns. See also Perotti (2014).
3
 Examples of fixed costs include labs that can be used both for government-financed R&D and for private R&D or human
capital investment in the form of learning by scientists on topics that have both military and civilian applications.

 4
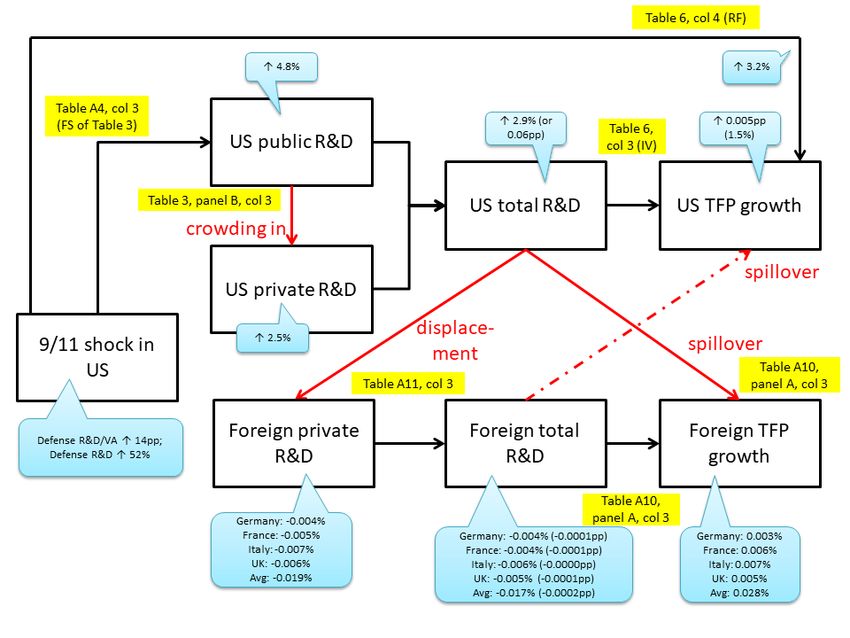
example, we estimate that if France increased its defense R&D to the level of the US as a fraction of its
GDP (admittedly a large increase) private R&D in France would increase by 10.3%.
 We find evidence of spillovers between countries.4 In the OECD data, increases in government
funded R&D in one country appear to increase private R&D spending in the same industry in other
countries. For example, an increase in government-funded R&D in the US chemical industry induced by
an increase in US defense spending in the chemical industry raises the industry’s private R&D in the
US, but it also raises private R&D in the German chemical industry. This type of cross-border spillover
is consistent with the presence of industry-wide technological or human capital externalities.
In the final part of the paper, we turn to the effect of investment in R&D on productivity. We estimate
models where measures of productivity growth – growth in TFP or output per worker - are regressed on
lagged private R&D intensity, using predicted defense R&D as a share of value added or sales as an
instrumental variable. Industry-level models based on OECD data indicate a positive effect of private
R&D on TFP. An increase in the defense R&D to value added ratio of one percentage point is estimated
to cause a 8.3% increase in the yearly growth rate of TFP (e.g., from 0.98 percent per annum to 1.06
percent). OLS estimates from firm-level models based on French data are qualitatively consistent with
these findings, but IV estimates are imprecisely determined.5
 We view this as a significant but not overwhelming effect. It suggests that a small fraction of US
economic growth is accounted for by investment in defense R&D. For example, defense R&D in the US
increased by a third between 2001 and 2004 following the 9/11 attack. We estimate that, holding taxes
constant, this translated into a 0.005 percentage point increase of the annual TFP growth rate in the US
in the affected years—about a 1.5% increase.
 Overall, our estimates suggest that cross-country differences in defense R&D play a role in
explaining cross-country differences in private R&D investment, speed of innovation, and ultimately in
productivity of private sector firms. We caution that our estimates do not necessarily imply that it is
desirable for all countries to raise defense R&D across the board. Our finding that government-funded
R&D results in increased private R&D does not necessarily imply that defense R&D is the most efficient

4
 International spillovers of R&D are studied by Hall, Mairesse, and Mohnen (2010); Coe and Helpman (1995); Pottelsberghe
and Lichtenberg (2001); Keller (2004); and Bilir and Morales (2015).
5
 Consistent with the existence of international technology spillovers, we also uncover a positive effect of investment in R&D
in an industry and country on productivity of firms in the same industry but in different countries.

 5
way for a government to stimulate private sector innovation and productivity. There are other possible
 innovation policies available to governments (Bloom, Van Reenen and Williams, 2019) and our analysis
 does not compare defense R&D to other types of public R&D spending.
 The structure of the paper is as follows. Section 2 presents a simple framework and the empirical
models. Section 3 describes the data. Sections 4 and 5 present the empirical results first on crowd-in and
then on productivity. Section 6 concludes. Online Appendices detail the data (A); quantify alternative
policies, such as the comparison with R&D tax credits (B) and simulate the impact of the 9/11 shock (C).

 2 Conceptual Framework, Econometric Models and Identification
 We start with a simple framework that is useful in deriving the empirical models we take to the
 data, and in clarifying how to identify and interpret our empirical estimates. Here we focus on the effect
 of government-funded R&D on private R&D activity. Specifically, we are interested in the direct effect
 for an industry-country pair or a firm of receiving government-funded R&D on the recipient’s own
 private R&D investment. In addition, we are interested in international spillover effects that might arise
 if changes in government-funded R&D in a particular industry and country indirectly affect private R&D
 activity in the same industry in other countries. In Section 5, we will discuss the framework to estimate
 the direct and indirect effects of R&D investment on productivity.

 2.1 Conceptual Framework
 We assume that output of firm f in industry i in country k at time t is a function of capital, K,
 labor, L, and intermediate inputs, M:

 = ( , , ) (1)

 where A is Hicks-neutral TFP. Following the R&D literature (e.g. Griliches, 1979) we assume that A is
 determined by the lagged R&D knowledge stock G:

 ln = ln ( −1) + + (2)

 6
where = is the elasticity of output with respect to the business R&D stock, X are other factors

influencing TFP, and is a stochastic error term. The R&D stock G is an increasing function of
privately funded R&D expenditures (R) and government-funded R&D expenditures (S).
 We assume that S is set by the government, while R is chosen by the firm based on the technology
embodied in equations (1) and (2), as well as on the cost of R&D. We assume that the (static) demand
for private R&D can be written as:

 ln R = σ ln U(S) + β ln Y + v (3)

 where U is the Hall-Jorgenson tax-adjusted user cost of R&D capital, which is allowed to depend
on public subsidies, S (see Criscuolo et al, 2019, for a discussion of how subsidies affect the user cost of
capital). The user cost will also depend on current and expected interest rates, depreciation and the tax
system as a whole (including R&D tax credits). This equation can be rationalized as the steady state
demand for R&D from the first order conditions from specializing equation (1) to a CES production
function (e.g. Bloom, Griffith, and Van Reenen, 2002). Under this interpretation, σ is the elasticity of
substitution and β is the returns to scale parameter (β =1 indicates constant returns) and v is a function
of technological parameters in the production function indicating factor biases.6
 In our empirical analysis, we use two alternative datasets to estimate two variants of equation
(3). In our analysis of OECD data, the level of observation is an industry-country-year and we assume
that we can take a first order approximation of equation (3) as:

 ln Rikt = αOECD ln Sik(t-1) + βOECDln Yikt + λXkt + dik+ dit + υikt (4)

where the determinants of R&D other than S and Y are assumed to be a vector of country by year
observables Xkt, a set of industry by country fixed effects (dik), industry by year dummies (dit, e.g.
industry specific product demand or technological shocks), and an idiosyncratic error (υikt). 7 In our

6
 If the production function was more general than CES, v would also include other factor prices such as the wage rate.
7
 We include dummy variables to control for the country-industry fixed effects, which formally requires strict exogeneity of
the right hand side variables. Since our panel is long (up to 26 years) we do not think there is likely to be much bias from this
issue, but to check we also estimated the equation in first differences, which requires weaker exogeneity assumptions and
obtained similar results.

 7
baseline models, Xkt includes country-specific linear trends and GDP at t-1, thus controlling for country-
specific long run trends and business cycles as these demand side effects are likely to affect innovation
(e.g. Shleifer, 1986). (The linear trends are not absorbed by the vector dit because they are allowed to
vary by country). In some specifications, Xkt includes a country-specific quadratic trend and additional
controls that may affect R&D.
 In our analysis of the French data, the level of observation is firm-years, and we assume that we
can take a first order approximation of equation (3) as:

 ln Rfit = αFRA ln Sfi(t-1) + βFRAln Yfit + df + dt+ υfit (5)

where we include a set of firm fixed effects (df) to absorb all sources of time-invariant heterogeneity
across firms. Since in this specification we only have one country, we do not include Xkt and dik - these
are absorbed by the time dummies and firm fixed effects respectively.
 Equations (4) and (5) represent our baseline models in the empirical analysis of the effects of
government R&D on private R&D. The focus of our analysis is on estimating the coefficients αOECD and
αFRA that relate changes in government-funded R&D in a given year to changes in private R&D in the
following year. (Recall that the dependent variable is only the privately funded part of business R&D,
so there is no mechanical association between R and S.)
 The sign of α is unknown a priori. If increases in government-funded R&D crowd out private
R&D, the α terms should be negative. In the case of complete crowding out, the only effect of the policy
is to displace private R&D, with no net gain in total R&D. This would be the case if, for example, the
supply of inputs in the R&D process in any given industry was perfectly inelastic in the short run. A key
input in this respect is likely to be specialized scientists and engineers and the elasticity of their supply
to a country-industry depends on their mobility across industries and countries. With inelastic supply to
a country-industry, increases in public funds for R&D come at the expense of declines in private R&D.
 If, on the other hand, increases in government funded R&D crowd in private R&D, the α terms
should be positive. In this case, more public R&D stimulates even more private R&D. There are at least
three possible reasons for why this might be the case.

 8
First, in the presence of large fixed costs, public R&D may make marginal private projects
feasible. In most industries, R&D activity is characterized by large fixed costs in the form of labs,
research, human capital accumulation, set up costs, etc. It is realistic to think that some of these fixed
costs can be used for multiple projects. For example, lab infrastructure set up for a specific project can,
in some cases, be used for other projects as well. Similarly, a scientist’s human capital acquired while
working on a specific project—the intellectual understanding of a specific literature, for example, or her
mastery of a scientific technique—can be helpful in other projects. By paying for some of the fixed costs,
government-funded R&D may make profitable for private firms’ projects that otherwise would not have
been profitable. Similarly, if government-funded R&D results in process innovation, it is conceivable
that this innovation can indirectly benefit private R&D.
 Second, if firms are credit constrained, the public provision of R&D might relax these financial
constraints. Although capital markets are generally well developed for the OECD countries we study,
the special nature of R&D investments highlighted by Arrow (1962), such as riskiness and asymmetric
information, may make it especially vulnerable to financial frictions.8
 Third, government-financed R&D investment by one firm may make other firms in the same
industry more productive because of technology or human capital spillovers (e.g. Moretti, 2004 and
2019). In this case, an increase in government-financed R&D directly raises R&D in the firm that
receives the government contract, and may indirectly raise R&D in other firms in the same industry or
same locality. Spillovers could also be negative in the case of strategic substitutability, as rival firms
could free ride off the R&D of the supported firms (e.g. Bloom, Schankerman, and Van Reenen, 2013).
 An implication is that in the presence of R&D spillovers within an industry the estimated
coefficient from industry-level data in equation (4) does not need to be identical to the coefficient from
firm-level data in equation (5). Broadly, we expect industry coefficients should be larger if crowd-in
induces rival firms to do more R&D (due to strategic complementarity) or smaller if rivals do less R&D
(due to strategic substitutability).
 In terms of inference: to account for the possible correlation of residuals in each year across
industries in a given country and across countries in a given industry, standard errors for OECD data
throughout the paper are multi-way clustered by country by industry pair and country by year pair

8
 See Garicano and Steinwender (2016) for some empirical evidence on financial frictions for R&D.

 9
(Miller, Cameron and Galbech, 2009). In the regressions based on the French data, we cluster at the 2-
digit industry for industry-level regressions; and 3-digit industry for firm-level regressions.

 2.2 Identification
There are at least two reasons why OLS estimates of equations (4) and (5) may be biased.
 (a) First, government R&D policies are unlikely to be random and may be set endogenously as a
function of shocks to firms in the private sector. In particular, it is possible that government allocation
of R&D funding to specific industries or specific firms is correlated with determinants of private R&D
investment.
 Of course, equations (4) and (5) allow us to control for a wide variety of shocks that affect private
R&D and may also be correlated with government-financed R&D. In equation (4), the inclusion of
industry-year dummies accounts for the fact that different industries have different propensities to invest
in R&D, and these differences can vary over time as a function of technology shocks and product demand
shocks. The inclusion of industry-country fixed effects accounts for differences in the propensity to
invest in R&D across countries and the fact that these international differences may be more pronounced
in some industries than others.
 In equation (5), the vector of controls also include firm fixed effects. This is an important
advantage of using firm-level data. It allows us to absorb all time-invariant unobserved differences across
firms that may be systematically correlated with propensity to invest in R&D. In equation (5), we
compare the same firm to itself at different moments in time. Identification stems from the timing of the
public R&D award.
 But even after conditioning on this rich set of controls, our models yield inconsistent estimates
if the timing and amount of public R&D is correlated with unobserved time-varying determinants of
private R&D. This may happen, for example, if governments tend to use public funds to help firms in
sectors that are struggling and are experiencing declines in private R&D. In this case, changes in public
R&D would be negatively correlated with unobserved determinants of private R&D, introducing a
negative bias in our estimates of the coefficient α in equations (4) and (5). The opposite bias arises if
governments tend to use public funds to help firms in sectors that are thriving, and are experiencing
increases in R&D over and above those experienced by the same sector in other countries.

 10
In either case, Sik(t-1) might be correlated with υikt in equation (4) and Sfik(t-1) might be correlated
with υfikt in equation (5). If governments disproportionately help “winners”, the correlation between Sik(t-
1) and υikt (and Sfik(t-1) and υfikt) is positive and OLS overestimates the true effect. If governments
disproportionately help “losers” (compensatory policies), the correlation between Sik(t-1) and υikt (and Sfik(t-
1) and υfikt) is negative and OLS overestimates the true effect. Note that in equation (4) what matters are
industry-country specific time-varying shocks. Equation (4) is robust to industry specific time-varying
shocks shared by all countries. For example, if the telecommunication industry is struggling in all
countries, and governments decide to endogenously increase publicly funded R&D for the industry,
equation (4) would yield consistent estimates.
 (b) A second possible reason why the OLS estimates of equations (4) and (5) may be biased is the
presence of measurement error in our measure of public subsidies. In the presence of classic
measurement error in S, attenuation bas may arise, leading OLS estimates to understate the true effect of
public subsidies on private R&D.

 Instrumental Variable. To deal with these two issues, we use an instrumental variable that is a
function of variation in defense R&D subsidies. Defense R&D is by far the largest component of
government R&D in many countries, e.g., United States, United Kingdom, and France. Defense R&D
also causes the biggest variations in public R&D over time, and there is a large variation across countries,
ranging from pacifist countries like Japan or neutral countries like Austria, to defense-heavy countries
like the United States and South Korea. This ensures that our instrument has a strong first stage.
 Defense R&D is usually motivated by geopolitical, not economic, considerations (Mowery,
2010), raising the possibility of using actual R&D defense subsidies as the instrument for government
funded R&D. However, we are concerned that while most of the variation in defense R&D is motivated
by geopolitical considerations, variation in defense R&D may also include an endogenous component.
This would be the case if changes in the timing and amount of defense R&D allocated to some industries
and firms respond at least in part to shocks to the supply or demand of private R&D in those industries
or firms. For example, governments may allocate R&D defense subsidies not based on purely military
considerations but also as a way to foster employment and investment in specific sectors or firms. If
defense R&D subsidies are correlated with unobserved determinants of private R&D, an instrument
based on defense R&D would be invalid. While variation in R&D defense subsidies is almost certainly

 11
more exogenous than variation in overall public R&D, we can’t rule out the existence of an endogenous
component.
 For this reason, we use predicted defense R&D subsidies as instrumental variable instead of
actual defense R&D subsidies. Predicted defense R&D subsidies isolate variation in defense R&D
subsidies based on the combination of lagged defense R&D subsidies to a given industry and the overall
total defense R&D spending. The idea is that changes in overall R&D defense spending will impact
some industries more than others, depending on their past share of defense R&D spending. While the
use of predicted instead of actual defense R&D subsidies may weaken the power of the instrument in the
first stage, it strengthens its validity. In practice, our first stage has good power and is robust to various
changes in the assumptions we use to construct the instrument.
 The exact definition of predicted public defense R&D differs slightly for the OECD and the
French dataset due to differences in level of aggregation and variable definitions. The details on how we
construct the instrument are in Appendix A.

 For the OECD analysis, predicted defense R&D subsidies ( ) is defined as

 = ℎ ( −1) ̃
 ∙

 ̃
 where
 is country k’s total defense R&D spending in year t. The term ℎ ( −1) is a
 9

weighted average of one-year lagged government defense R&D in industry i as a share of all the
government defense R&D in the United States and France. The weights are country-industry-time
specific and depend on the similarity of country k’s patent technology class distribution to the

distributions of the United States and France. We use ℎ ( −1) rather than the actual own country
share in order to further reduce the risk that the industry distribution of defense R&D subsidies responds
to expected country-specific shocks. Using the US and French data also has the practical advantage that
defense R&D subsidy data at the country-industry level by year is not available for the other countries.10

9
 This includes not only defense related R&D subsidies spent by businesses, but also spend by sectors including e.g.,
universities (called “government budget appropriations or outlays on R&D” or GBAORD by the OECD). We do not have
aggregate numbers for the business sector only component for all OECD countries (only for France). In Table 3 we conduct
robustness tests where we control for non-business R&D to make sure our affects are not being driven by defense R&D
carried out in government labs or universities.
10
 The US industry shares are given for each fiscal year, so it is partially lagged compared to the other variables. It is available
for the years 1987-2003 for the US (we hold the 2003 share constant for the years after 2003). Apart from the US, the defense
breakdown by industry is only available for France between 1980 and 2015 (see data description further below). Our results
are robust to dropping either the US or France or both. We use only the France-specific data in the French firm-level analysis
below.

 12
Notice that since ℎ ( −1) is country-industry-year specific, it is not absorbed by any of our fixed
effects.
 Our identifying assumption is that variation over time in the amount of predicted defense-related
R&D experienced by a given industry in a given country is driven by shocks that are orthogonal to
private R&D shocks, such as wars, terrorism, geopolitical shocks like the end of the Cold War, and the
ideological preferences of the political leaders in power.
 It is possible that while the overall level of defense spending in a country is orthogonal to the
residual υikt, the industry composition of defense spending may still be correlated with υikt. This would
be the case if, for example, French defense spending declined after the end of the Cold War for
exogenous reasons, but the decline was smaller in, say, aerospace, for endogenous reasons. Because we
are using a weighted average of US and French industry shares for all countries, this is a problem only
to the extent that endogenous adjustments to the industry shares reflect unobserved industry-specific
time-varying shocks that are shared by the US, France and the relevant country. As tests of this we look
at models that exclude the US or France (or both) and find that they all yield similar estimates.
 We argued above that an additional motivation for using an instrumental variable is the possible
presence of measurement error in the variable S. We note that whatever measurement error exists in S
in our OECD data, it is independent of the measurement error in defense R&D and therefore in the
instrumental variable. As explained in our data Appendix, the two variables come from different data
sources so there is no mechanical correlation.
 In the French analysis, the IV for firm-level models is defined as

 ̃
 = ℎ 4 ∙ 3,

 where ℎ 4 is the annual share of defense R&D subsidies allocated to firm f’s main four-digit
 ̃
SIC industry (averaged across all years); and 3, is the level of defense subsidies defined at the three-

digit industry level excluding subsidies going to firm f itself in a particular year, to avoid a mechanical
correlation between the IV and instrumented variable.
 In some models, we perform an analysis at the three-digit industry level for France. In this case,
we use the three-digit industry defense R&D share and the two-digit industry defense R&D subsidy
 ̃
excluding the subsidy to firm f’s three digit industry: ℎ 3 ∙ 2, . We tried using the US shares for

 13
the French analysis, but the level of coarseness of the aggregation of industry meant that the first stages
were weak.
 It is possible that government-funded R&D by country i is set endogenously in response to
government-funded R&D by country i’s competitors. For example, an increase in government-funded
R&D in, say, the German chemical sector may induce France to increase its own government-funded
R&D in the chemical sector. This does not invalidate our estimates—even in an ideal randomized setting
where public subsidies are randomly assigned this issue would arise—but it affects their interpretation.
In this case, the α parameters should be interpreted as the effect of S on R, after allowing for the
endogenous reaction of other countries. This is arguably the parameter of interest for policy. It informs
policymakers of what they can expect from a policy change is other countries react.

 Product Demand Shocks. In both the OECD and French settings, a plausible concern is that
shocks to predicted military R&D could in principle signal shocks to future product demand. For
example, an event such as 9/11 generated a direct increase in military R&D, but also increased current
and future demand for military products. In turn, this second channel could stimulate additional private
R&D through a demand or market size effect, thus invalidating our instrument. We note that it is not ex
ante obvious that this is a major issue in our context because historically large increases in government
defense procurement are typically targeted toward existing, rather than new technologies, while most
R&D is likely to be directed at new technologies.11
 We present four tests intended to probe the sensitivity of our findings to these demand effects.
(i) As a first pass, we estimate models that condition on future industry output. These models are not our
preferred specification, because future output needs to be thought of as an endogenous variable. (ii) We
then estimate models that condition on non-R&D military spending and expectations thereof. (iii) We
also estimate our baseline model solely on the US, where we have industry-specific R&D and non-R&D
public military spending. (iv) Finally, we perform placebo tests based on components of defense
spending that are unrelated to R&D subsidies paid to businesses. The idea is that our instrumental
variable estimates should not be driven by changes in defense procurement that stimulate demand rather

11
 This is why many historians like Milward (1977) have argued that wars tend to retard technological change by engendering
a more conservative attitude to military procurement.

 14
than R&D. Overall, our findings indicate that changes in expected demand are not major sources of bias
in our models.

 Local Average Treatment Effect (LATE). An important issue to consider in interpreting our
IV estimates is whether the effect of public R&D is homogeneous or heterogeneous. Under the
assumption of homogenous treatment effects, our IV estimates reflect the causal effect of public R&D
on private R&D (if the IV is valid). On the other hand, if the effect of public R&D is heterogeneous and
it varies across firms and sectors, our IV estimates identify a particular Local Average Treatment Effect
(LATE). In this case, the IV estimate of the treatment effect of government R&D on private R&D is
reflective of the effect for compliers, which in our case are sectors and firms that receive an increase in
government R&D because of an increase in defense R&D, as opposed to other forms of public R&D
subsidies. This raises the question of whether the effect for compliers is large or small—more precisely:
whether defense R&D has large or small effects on private R&D compared to other government policies
designed to subsidize private R&D.
 The magnitude of the effect of defense R&D on private sector R&D has been hotly debated for
many years (e.g., see surveys by Mowery, 2010, and Lichtenberg, 1995). Skeptics have argued that the
effect of defense R&D on private R&D is likely to be limited because the secrecy that surrounds defense
R&D inherently limits the scope of spillovers to civilian firms. By contrast, recipients of non-defense
public R&D subsidies are typically not subject to secrecy requirements and sometime may even be
required to publicize their research. On the other hand, proponents of the benefits of defense R&D for
the private sector point to the commercial success of major innovations such as jet engines, computers,
radar, nuclear power, semiconductors, GPS, and the Internet as evidence that military R&D can trigger
vast amounts of private R&D investment directed to civilian applications.12 Proponents of this view
often point to Israel as an example of how defense R&D spending has resulted in high levels of private
sector R&D (e.g. Senor and Singer, 2009). Overall, while there is much anecdotal evidence of some of

12
 For example, see Lichtenberg (1984, 1988), Ruttan (2006), Mazzucato (2013) and the recent discussion of the DARPA
model by Azoulay et al. (2019b). Draca (2013) estimates the impact of US defense spending on firm-level innovation and
finds that increases in procurement contracts are associated with increases in patenting and R&D. Bhattacharya (2018)
presents a structural model of R&D in the context of the US Department of Defense SBIR program and has a good recent
survey of issues around military procurement and innovation. Some even argue that the Pentagon’s role as the world’s most
generous investor in technological innovation during the Cold War—ultimately resulting in superior technologies for
American companies and enduring gains in their competitiveness (Braddon, 1999)—was an important reason that US
industries became so dominant.

 15
the positive and negative effects that defense R&D might have on private R&D, there is little systematic
econometric evidence.
 We note that the magnitude of the treatment effect for compliers matters when comparing IV and
OLS estimates. If the effect on private R&D for sectors and firms that experience an increase in
government R&D due to an increase in defense R&D subsidies is larger (smaller) than the effect for
sectors and firms that experience an increase in government R&D due to an increase in non-defense
R&D subsidies, then our IV estimates may be larger (smaller) than our OLS estimates even if OLS
estimates are unbiased.

 2.3 Employment and Wages
We also examine the effect of increases in public R&D investment on employment and wages. This is
important because an increase in private R&D expenditures does not necessarily equal an increase in
R&D activity. We distinguish between the effect on labor market outcomes of R&D workers and labor
market outcomes of non-R&D workers. If the supply of R&D workers is completely inelastic in the short
run, increased R&D spending could simply result in higher wages, with little or no effect on employment
and innovation (Goolsbee, 1998). On the other hand, if R&D workers can move across industries or
across countries so that supply to a specific country and industry is fairly elastic, we might find
significant increases in R&D personnel and limited increases in their wages. The effects on demand for
non-R&D personnel in the industry depend on whether R&D generates technologies that substitute for
or complement such labor. On the one hand, more R&D in an industry may result in product innovation,
higher sales, and therefore more labor demand. On the other hand, process innovation can easily reduce
employment by making it easier to produce the same output with fewer labor inputs.
 To empirically assess these questions, we estimate models where the dependent variable is the
employment of R&D workers, employment of non-R&D workers, and average wages.

 2.4 International Spillovers
It is in principle possible that increases in government-funded R&D in an industry in a given country
affect private R&D investment by firms in the same industry located abroad. For example, an increase
in government-funded R&D in the German chemical industry may reduce private R&D in the French
chemical industry. This may be due to strategic reasons, as French firms decide it is not worth competing

 16
to catch up with their German rivals (e.g. international R&D is a strategic substitute) or the cost of internationally used industry-specific R&D inputs (e.g. chemical engineers) may be driven up. The opposite spillover effect could also arise if R&D is a strategic complement between countries, so that increased public R&D in Germany results in French firms investing more to keep up in the race; or if there are significant cross-country technological or human capital externalities. To empirically assess international spillovers, we use our OECD data to estimate models of the form: lnRikt = α OECDlnSik(t-1) + γ OECDlnSPik(t-1) + β OECDlnYikt + λ Xkt + dit + dik + υikt (6) where SPik(t-1) is a weighted average of government-funded R&D in other countries in the same industry and year with weights measuring the between country i and each other country: SPik(t-1) = ∑j dijSjk(t-1) where dij is the economic or geographic “distance” between country i and country j (normalized to sum to one for each country i) and Sjk(t-1) is, as before, government-funded R&D in industry i in country j. 3 Data and Basic Facts We use two separate data sets: section 3.1 details the data used in our OECD industry-country level analysis; section 3.2 describes the data used in our French firm-level analysis. 3.1 OECD Industry-Country Data Data Sources. We combine data for OECD countries from the STructural ANalysis (STAN) dataset and the Main Science and Technology Indicators (MSTI) dataset. Our data include 26 countries, 26 industries, and 23 years, from 1987 to 2009. The Data Appendix describes in detail how we cleaned and merged the data and provides the exact definition of each variable with the corresponding source. The definitions of R&D are based on the internationally recognized “Frascati Manual” used by the OECD and national statistical agencies. Our main R&D variable measures industry-level R&D conducted by businesses (known as “Business Enterprise R&D” or “BERD”). We will generally refer to BERD as simply “R&D” for brevity. While all BERD is conducted by firms, some of its funding comes from private sector sources while other funding comes from the government. Hence, in the notation of our model, BERD = R + S. We refer to the part of BERD that is funded by private sources as “privately-funded R&D,” or “private R&D.” This is the variable R, the main dependent variable in equations (4) and (5). 17
We refer to the part of BERD that is funded by the government as “government-funded R&D” or “public R&D.” This is the variable S. A subset of public R&D is defense-related, and we refer to it as “defense R&D.” Note that S only includes government-funded R&D conducted by private firms, and does not include R&D conducted by universities (and other non-profits) and by the government itself (e.g. in government R&D labs). Also note that we do not have data on industry-specific defense R&D in the OECD dataset, but we instead construct a predicted defense R&D as described above.13 Appendix Table A1 (Panel A) summarizes the variable definition and presents summary statistics. Facts about R&D. There is wide variation in private R&D, public R&D, and defense R&D across countries, industries, and years. Consider first aggregate R&D as a percent of GDP by country (Appendix Table A2). The most R&D-intensive country is South Korea at 2.7%, followed by Sweden at 2%. The US also has a very high R&D/GDP ratio of 1.9%. At the other end of the spectrum, there are Southern European countries like Greece and Portugal, with ratios approximately 0.2%. Although there appears to be a general upward trend in R&D over time, there is substantial variation across countries in growth rates, with some countries experiencing steep increases (e.g. Denmark) while others experience declines (e.g. the UK). R&D intensity also varies widely across industries (see Appendix Table A3). The most R&D- intensive industries are generally Information Technology (Office, accounting, and computing machinery) and telecommunications (Radio, TV, and other communications equipment), with R&D intensities of over 20%. The next most R&D intensive sectors are chemicals (including pharmaceuticals), medical/precision instruments, and transport equipment (including aerospace) with over 10% of value added devoted to R&D. By contrast there is very little formal R&D in the distributive trades (wholesale and retail), personal services, and construction. Public R&D also varies widely across countries and over time. Table 1 shows that the US and Eastern European nations such as Poland and Slovakia have the highest share of R&D funded by the government (over 15%), whereas the share is under 2% in Switzerland and Japan. In many countries, 13 The OECD also reports two other sources of funds: Other national and funds from abroad. These sources are small, with other national sources contributing to 0.01% of total R&D, and sources from abroad contributing to 2.5% of total R&D in the dataset. We add these funding sources to privately funded R&D for simplicity, but our main results are not affected by this. 18
such as the US, the UK, France, and Canada, the rate of public funding has decreased over time. Some
of this is likely to be due to a shift from direct to indirect support to business R&D, such as tax breaks
(see Guellec and van Pottelsberghe de la Potterie, 1999). We explicitly add controls for tax incentives in
robustness checks presented below. Table 2 shows the defense share of government-funded R&D by
country. Not surprisingly, the US has the highest proportion of defense-related R&D (57%), followed
by Great Britain (35%), and then France (29%). In the data, we observe the defense-related part of the
government’s total R&D budget from the OECD MSTI.14 Ideally, we would have just the government-
funded and business-conducted part of R&D, but this data does not exist over time across countries. It
is likely that the two series track each other, however.15
 The defense share of R&D varies not just across countries, but also within country over time.
This is important for the identification of our models, which include country by industry fixed effects.
Figure 1 illustrates how the four largest economies in our data experienced very different developments
in their shares of defense-related and government-funded R&D to GDP ratios over time. In the United
States, defense R&D spending started at a very high level in the late 1980s under Reagan (over 0.8% of
GDP) and fell subsequently after the fall of the Berlin Wall in 1989. After 9/11, defense R&D spending
ramped up again under the War on Terror and the wars in Afghanistan and Iraq, rising from 0.45% (in
2001) to 0.59% (in 2008) of GDP. In Germany, defense spending is at a much lower level. Like the US,
Germany reduced defense spending after the Cold War, with the rise of President Gorbachev and the fall
of the Berlin Wall. In 1996, however, Germany and France cofounded a military agency focusing on
R&D activities, causing a pick-up in defense R&D in Germany. In contrast to the US, Germany did not
ramp up defense spending after 9/11; instead, it continued to downsize its military (European Parliament,
2011). In stark contrast, Japan has an even lower level of defense R&D spending, as its constitution
commits the country to pacifism. However, Japan increased its military activities in response to North
Korean missile tests in the late 1990s by starting a surveillance satellite program that resulted in satellite
launches in 2003, 2006, and 2007 (Hagström and Williamsson, 2009). Finally, France shows a time-

14
 Specifically, “Total government funded R&D” is all government budget appropriations or outlays of total R&D, i.e., not
just the government-funded part of R&D conducted by businesses, but also the government-funded part of R&D conducted
outside of enterprises.
15
 Indeed, for the US and for France we have a more detailed breakdown and we confirm that the correlation is 0.73 (US) and
0.88 (France).

 19
pattern relatively similar to Germany: The reduction in defense spending after the end of the Cold War
is visible, but in contrast to Germany, France did ramp up defense spending after 9/11.
 Overall, the experiences of these four major economies with highly variable levels of defense
R&D illustrate how the timing of changes in defense R&D often reflects factors that are largely
exogenous to economic and technological conditions, being driven by geopolitical events that are
heterogeneous across countries.16
 Our instrumental variable strategy is predicated on the notion that defense R&D is an important
driver of overall government-funded R&D. Figure 2 presents the series of defense R&D and public R&D
by country (summed across industries). Clearly, in most cases the two series tend to move together: the
average correlation is 0.29 (standard error 0.11). The importance of defense R&D varies widely across
industries: Aerospace tends to be the single most important beneficiary of defense R&D. In the OECD
data the first stage of our IV relies on the relationship between public R&D and predicted defense R&D.
The correlation at the industry level is visually strong (see Appendix Figure A1). In years when defense
R&D is high (low), overall government funded R&D tends to be high (low). Below we quantify this
relationship more formally.

3.2 French Firm-level Data
 Data Sources. We use firm-level data collected by the French Ministry of National Education,
Higher Education and Research (“Ministry of Research”) in their annual R&D survey from 1980 through
2015. The Data Appendix provides details on the survey that seeks to include all large firms that perform
R&D and a rotating sample of smaller firms that perform R&D. Firms conducting research and
development are asked to report detailed information on their R&D activity (R&D budget, number of
R&D employees, R&D wage bill, number of researchers), and broader firm information (such as their
firm identifier - SIREN, total number of employees, sales, main industry, etc.). Importantly for us, the
dataset includes information on which firms receive R&D subsidies and how much, as well as what type
of subsidy they receive (including defense). In the rest of the paper:

16
 Spain saw a rise in military spending after 1996, when the conservative center-right party came to power and pursued a
new defense policy. The policy included a large increase in the military budget, which resulted in a sharp increase in military
R&D spending. The financial crisis in 2008 forced the government to significantly cut the military budget, including R&D
contracts (Miralles, 2004; Barbé and Mestres, 2007).

 20
We refer to all R&D subsidies originating from Ministry of the Armed Forces and its agencies as “defense R&D subsidies.” We refer to the sum of all R&D subsidies (including defense R&D subsidies) originating from any ministry or government agency as “total R&D subsidies” or just “R&D subsidies.” We refer to the firm’s R&D budget less total R&D subsidies, other national funds, and international funds, as “privately funded R&D.” Descriptive Statistics. The sample includes 40,787 firms for an average of 3.9 years each. Only 24% of firms appear in five or more years and almost 40% of firms appear just once. Since our models include firm fixed effects, we drop firms that appear only once. We also drop firms with missing R&D data. The usable sample includes 12,539 firms appearing an average of 6.5 years each, 56% of which appear in more than 5 years. Summary statistics are in Panel B of Appendix Table A1. The largest two-digit industries by firm count in our sample are business services (8,025 firms) and software/data (7,507 firms), followed by machinery (2,755 firms). Because the survey targets firms that are likely to be conducting R&D, this ordering also holds when we rank industries by number of firms conducting R&D in one or more years: 7,112, 6,940, and 2,550 firms in business services, software/data, and machinery, respectively. Looking at the number of firms receiving R&D subsidies, business services (3,118 firms), software/data (3,092 firms), and machinery (1,178 firms) remain the three most prominent industries. R&D subsidies cover a large fraction of firms in these industries, while a much smaller portion receive defense R&D subsidies: just 229 business services firms, 133 electronics firms, and 115 software/data firms over the 36-year period for which we have data. While most R&D subsidies are not for defense, most euros allocated via subsidies are for defense. Of the €833 billion in R&D conducted in our sample, €87 billion was publicly funded, and €57 billion of that was targeted at defense. In industries like aerospace/transport,17 the dominance of defense subsidies is even clearer, with the industry conducting €119 billion in R&D, of which €38 billion was publicly funded, almost €31 billion specifically for defense. Using the value of defense subsidies allocated to each industry, the largest defense industries after aerospace/transport are electronics, technical instruments, machinery, and chemicals. 17 In addition to aerospace, this includes rail and ships, but not automobiles. 21
You can also read