CFA Society Of NZ Presentation
   Matthew Goodson, CFA
          May 2020
←
→
Page content transcription
If your browser does not render page correctly, please read the page content below

CFA Society Of NZ Presentation
Matthew Goodson, CFA
May 2020
US Data Shows A Retail Surge

• Trade Reporting Facility data sourced from Citigroup shows retail activity surge.
• Ameritrade daily trades have risen from just under 1m to just under 3m.
• So-called “free” trades a key catalyst. Order-routing the next scandal?

Page 2
Democratisation Of Equities Or Last Marginal Buyer?

Page 3
ASIC Says “Don’t Try This At Home”

• Sydney Morning Herald article on 6 May 2020 re an ASIC report on a boom in
  retail share investors.
• Average daily turnover by retail brokers lifted from A$1.6bn to A$3.3bn from late
  Feb to early May.
• 4,675 new accounts per day registered during the Covid-19 period – up by a factor
  of 3.4x per day.
• On over two-thirds of the days that retail investors were net buyers, the share
  prices declined the next day.
• On over half the days that retail investors were net sellers, share prices increased
  the next day.
• The average holding period has fallen to under one day – these losses do not get
  recouped by holding for the long term.
• “In the week from 16 to 22 March 2020, based on a sample of 12 Australian
  licensed CFD providers, retail client losses were just over $428 million gross“ - ASIC
• "Even market professionals find it hard to time the market in a turbulent
  environment, and the risk of significant losses is a regular challenge“ – ASIC

Page 4
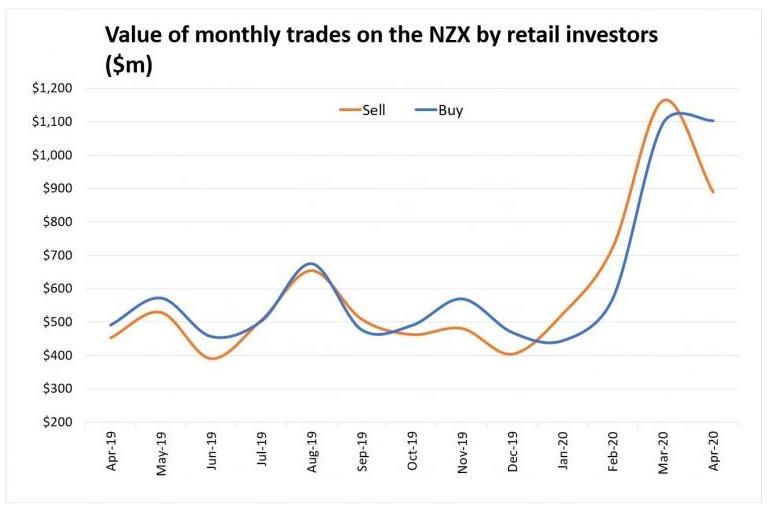
Retail Investor Flows In NZ
Source: NZX data & interest.co.nz
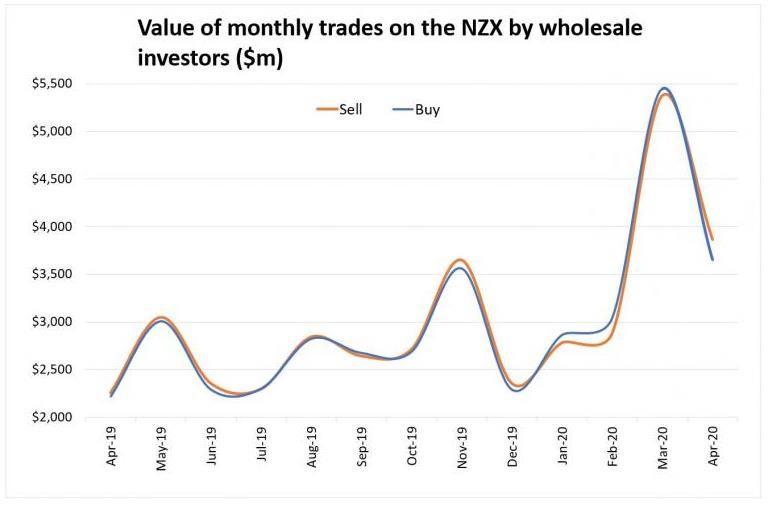
Page 5Wholesale Investor Flows in NZ Page 6
The Sudden Rise Of Mass Retail In NZ

                                                                                      Source: Iress

     •   2020 market shares is ASB Securities = 4.3% and Sharesies = 1.0%.
     •   Net buyers of $123m and $157m respectively during 2020.
     •   BUT in Jan/Feb 2020, ASB net seller of -$15m and Sharesies net buyer of just $15m. All the
         net buying has come in March and April.
     •   To date, this looks like good market timing in defiance of global trends.
     •   Or are they just buying their own performance….for now….
     •   AIR.nz market share since March 1 is 19.9% and 9.8% and net buyers of $30m and $64m
         respectively. The business will survive but current equity holders’ share in it may not?

Page 7
Retail Surge But Valuations Are High
• The “core” forward PE is a historically high 33.8x at end April and 36.1x now. It is still c31x ex
FPH and ATM. The median PE is a far less alarming 16.5x but subject to downgrade risk.
• TINA trade is important but there’s far less earnings growth and greater risk premia.
• There were true bargains at the fleeting March trough but most inflow has been since then
and the market is not a bargain now – quite the reverse.
Page 8Other Forces Driving Equity Markets • Buybacks are so 2019…This will be a particular issue for the US market where corporates are more levered and rely far more on buybacks due to dividend double-tax and perverse management incentives. • M&A has taken a back seat in the short term given the sheer economic uncertainty plus inability & unwillingness of banks to fund. It will return. • A flood of emergency equity raisings, with Auckland Airport’s $1bn+ raise the highlight so far in NZ. More to come. • Investors have been surprisingly willing to fund these thus far. Early evidence points to strong returns but only from the issue price not from the weighted average price. As a strategy you only make money if you get far more than pro rata. Several notable exceptions. • Kiwisaver inflows will continue but at a lesser net rate due to job losses, income cuts and hardship withdrawals. NZ equities relative outperformance of other asset classes will have generated rebalancing outflows. • Market volume has been thin and prices extremely volatile with large intra-day movements. Aggregate volumes are skewed by equity raisings. • Growth of passive funds at expense of active likely to continue but do not forget about fees, tax and implementation drag. Create a wedge of circa -1.8%pa in NZ. Page 9
Passive Investing – Market Implications

• In the past 5 years, 82% of US active share funds have underperformed according
  to S&P Dow Jones.
• In NZ, the median active equity manager has outperformed since inception but
  this is no longer the case on 3 and 5 year returns.
• In August 2019, assets in US passive funds and ETFs reached $4.271trn, surpassing
  the $4.246trn in active funds according to Morningstar.
• The larger a company and the more its share price goes up, the more a passive
  fund has to own.
• This has led to “size” and “price momentum” being dominant factors explaining
  returns. Think of the “FANG” stocks in the US and the “WAAX” stocks in Australia.
• NZ is no exception. The 3 year return for the S&P/NZX Large Cap Gross Index is
  +14.8% vs +9.5% for the Mid Cap. But 10 year returns are +12.8% and +12.9%.
• Passive has seen the market closing auction become ever more dominant. In NZ, it
  now accounts for 40% of turnover on heavy days and frequently leads to sizeable
  price movements. Passive investors get the closing price.
• Corporate governance oversight is now being increasingly outsourced to proxy
  advisors. This potentially risks a tick-box approach to complex issues.

Page 10
The Rise Of The Closing Auction In NZ

Page 11
Disclaimer
The information in this presentation has been prepared from sources believed to be reliable and
accurate at the time of preparation but Salt Funds Management Limited, its officers and directors, make
no representation or warranty as to the accuracy or completeness of any of the information contained
within. All analysis, opinions and views reflect a judgment at the date of presentation and are subject to
change without notice. This presentation is provided for general information purposes only. To the
extent that any of the information in this presentation does constitute advice, it does not take into
account an individual investor’s financial situation or goals. An individual investor should, before
making any investment decisions, seek professional advice, having regard to the individual investor’s
financial situation and goals. Past performance is not a reliable indicator of future performance and no
representation or warranty, express or implied, is made regarding future performance. This
presentation is solely for the use of the person or persons to whom it is provided and must not be
distributed or copied, in part or in whole, without the permission of Salt Funds Management Limited.

Page 12
You can also read