Challenges in Studying Wildfire Health Impacts - Exposure Assessment - The National Academies of Sciences, Engineering ...
←
→
Page content transcription
If your browser does not render page correctly, please read the page content below
Challenges in Studying Wildfire
                       Health Impacts – Exposure
                              Assessment
                National Academies of Sciences – Implications of the California Wildfires for
                                Health, Communities, and Preparedness

                       Colleen Reid, PhD MPH
           Assistant Professor, Department of Geography
                   University of Colorado Boulder
                 Email: Colleen.Reid@Colorado.edu

Image Credit: NASA                           Reid CE | NAS 2019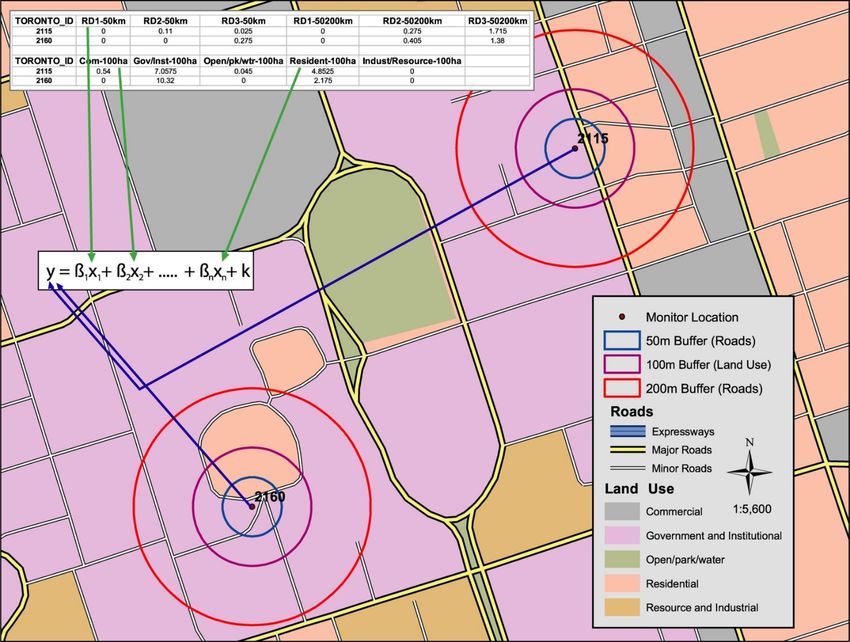
When investigating a wildfire
retrospectively, how do you
assess which people were
exposed?

               Reid CE | NAS 2019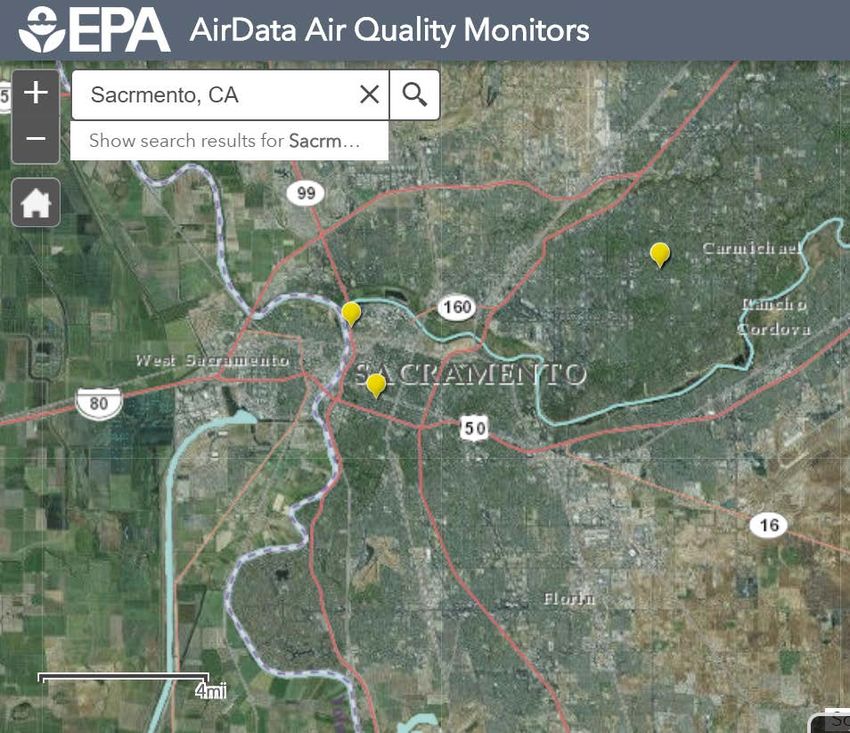
Exposure Assessment Methods Used in
Wildfire Epidemiological Studies
• Temporal Comparisons
  • Relatively easy
  • Can’t estimate dose-response
  • Associations may not be solely
    due to smoke exposure

                                                          Holstius et al. 2012, EHP

                                     Reid CE | NAS 2019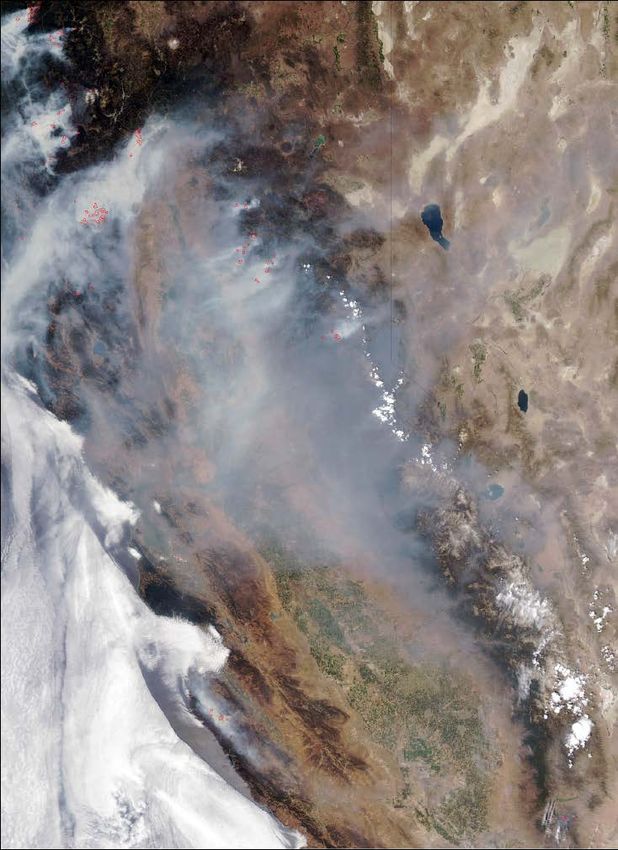
When investigating a wildfire
retrospectively, how do you
assess how much exposure those
people experienced?

             Reid CE | NAS 2019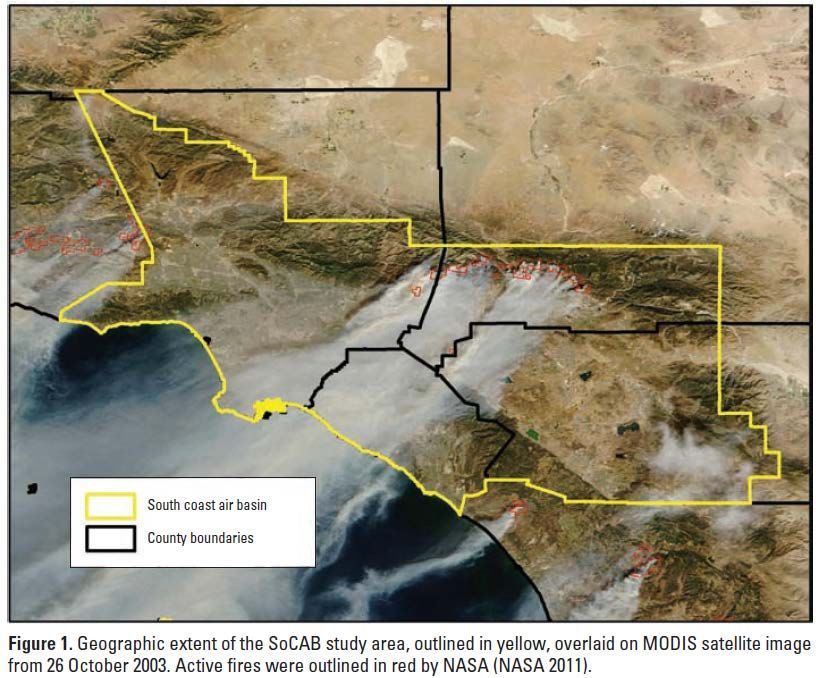
Exposure Assessment Difficulties with
Wildfires
 •Monitoring data
    • Lots of data – relatively easy to access
 • The monitors are not always in all of the locations
   that you want
 • Many EPA PM2.5 monitors only measure every
   sixth or third day
 • Leads to spatial and temporal averaging of
   exposure measurements
     • But, smoke plumes migrate quickly, changing
       exposures over smaller spatial and temporal
       scales

                                           Reid CE | NAS 2019   5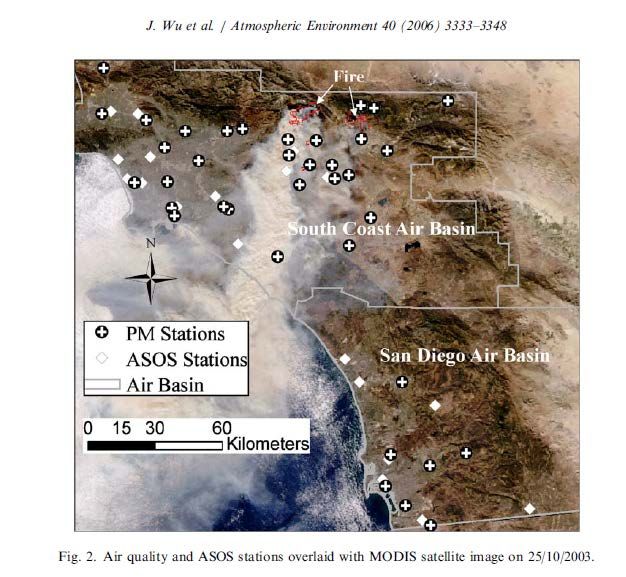
Exposure Assessment Methods Used in
Wildfire Epidemiological Studies
• Nearest air pollution
  monitor or average of
  regional monitors

https://www.epa.gov/out
door-air-quality-
data/interactive-map-air-
quality-monitors
                            Reid CE | NAS 2019
                              Reid CE | NAS 2019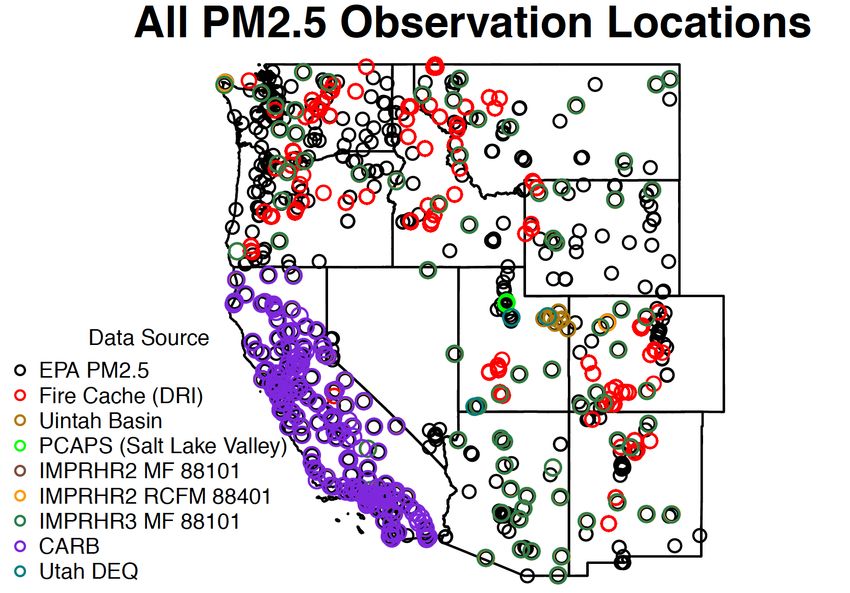
Exposure Assessment Methods Used in
 Wildfire Epidemiological Studies
                                                               MODIS AOD August 2018
• Satellite Data – Aerosol
  Optical Depth
   • Benefits
      • Full spatial coverage (except
        for cloud masking)
      • Actual measurement
   • Drawbacks
      • Full column measurement
        and not just at ground level
      • Missing data

                                        https://earthobservatory.nasa.gov/global-maps/MODAL2_M_AER_OD

                                          Reid CE | NAS 2019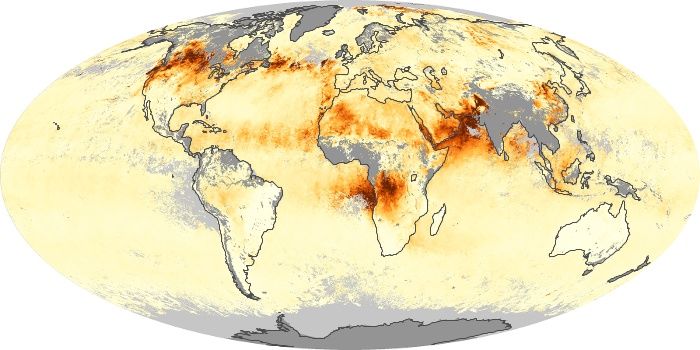
Exposure Assessment Methods Used in
Wildfire Epidemiological Studies
• Air pollution models                               • Advantages
   • Dispersion models                                         • Complete spatial coverage
      • HYSPLIT (Thelen et al., 2013)                          • Can get just ground-level
      • CalPuff (Henderson et al. 2011)                          concentration estimates
   • Chemical Transport Models                                 • Allow estimation of counterfactual
     (CTMs)
      • GEOS Chem (Liu et al. 2016; Liu et al.
                                                     • Disadvantages
        2017)                                                  • Dependent on the inputs
      • WRF-Chem (Gan et al. 2017)                             • uncertainties in emissions
      • CMAQ (DeFlorio-Barker et al., 2019)                      estimates from fires

                                          Reid CE | NAS 2019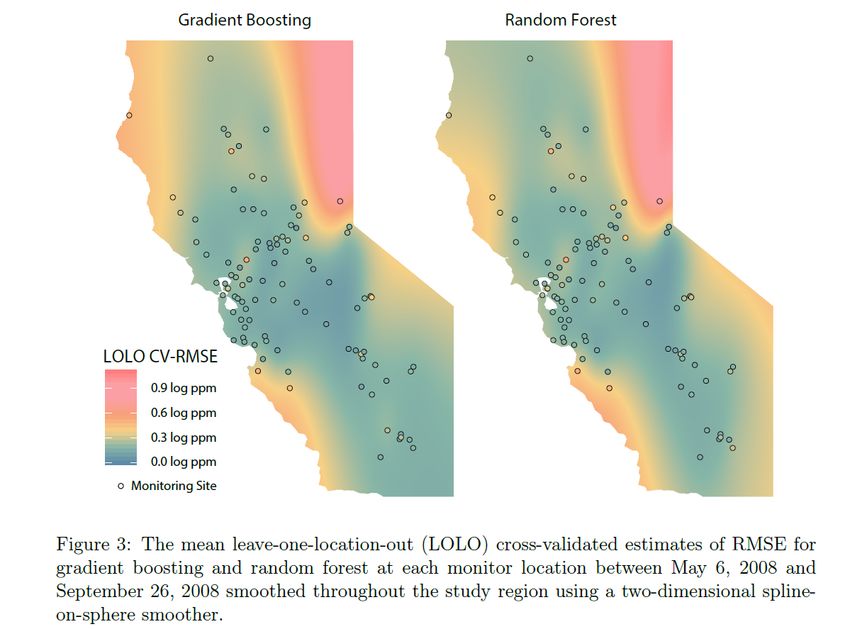
Exposure Assessment Methods Used in
Wildfire Epidemiological Studies
• Blended Models
   • Statistically combine CTMs, satellite data, and
     monitoring data
   • Sometimes also auxiliary data

• GWR method – Gan et al. 2017 and
  Lassman et al. 2017
• Machine learning method – Reid et al.
  2015 and Yao et al. 2018

                                     Reid CE | NAS 2019
Adapt Land Use Regression Modeling with Machine
Learning and Adding Temporal Component
• Include novel spatiotemporal datasets
• Apply machine learning methods to
• Select from a long list of predictor variables
• Select from a variety of statistical algorithms
Reid CE | NAS 2019 10
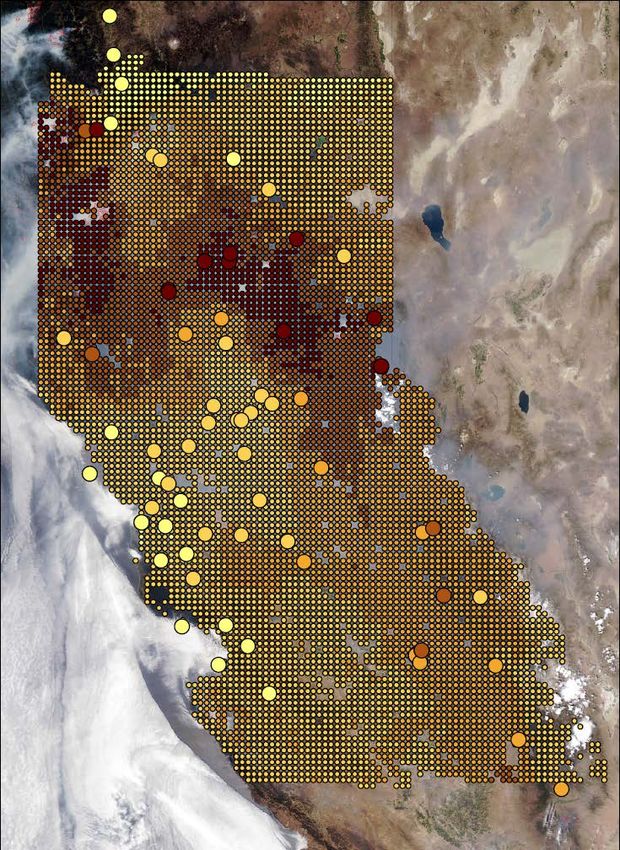
Image courtesy of Mike JerrettSource: Reid et al. 2015. Spatiotemporal Prediction of Fine Particulate Matter During the 2008 Northern California Wildfires Using Machine Learning.
Environmental Science & Technology.
11July 11, 2008
75 µg/m3
Reid CE | NAS 2019
Large circles are observed values at monitors, small circles are predicted valuesWatson et al.
Under Revisions
at
Environmental
Pollution
Reid CE | NAS 2019 13PM2.5 and ozone exposure estimates by ZIP code
by day for the 2008 northern California wildfires
Reid et al. 2019 Env Int
14
Reid CE | NAS 2019Variables Data Source Temporal Resolution Spatial Resolution Buffer Size
Goal #1: Estimating Exposures
Dependent Variable
US EPA, states
Federal Land Manager Environmental Database, Fire
Cache Smoke Monitor Archive, IMPROVE Network,
PM2.5 from monitoring stations academic research groups Daily or hourly point
Spatiotemporal Variables
GOES Aerosol and Smoke Product (GASP) AOD NOAA Hourly 4 km
Multi-Angle Implementation of Atmospheric
Correction (MAIAC) AOD NASA Daily 1 km
MODIS Active Fire Detection NASA Daily 1 km
VIIRS Fire Occurence NASA Daily 375 m
Hazard Mapping System (HMS) Smoke and Fire 25km, 50, 100km, 500km,
Product NOAA Daily 4km 1000km, 2000km
MODIS Normalized Difference Vegetation Index
(NDVI) NASA Monthly 1 km
14 Meteorological Variables NOAA: North American Mesoscale (NAM) Forecast System 6-Hourly 12 km
Spatial Variables
Elevation (m) USGS Nominal 2-month cycle 1 arc-second
Percentages of land cover types National Land Cover Database 2011 Every 5 years 30 m 1km
Kilometers of highway within buffer zones National Highways Planning Network, US DOT 100, 250, 500, and 1000 m
Temporal Variables
Julian Date Daily
Weekend Daily
Maestas, Reid, Considine, Li et al. Work In ProgressBlended Models…
• Strengths
• May be able to combine best of satellite and CTM
• Full spatial coverage
• Weaknesses
• There are assumptions of each model that should be understood –
performance may vary spatially and temporally
• There are errors in these models that should be considered
• Results of epidemiological investigations may differ because of the exposure
assessment method….Different findings from different exposure
models….
Henderson et al. (2011) EHP Gan et al. (2017) GeoHealth
Reid CE | NAS 2019Moving Forward….
• More work to improve and compare exposure models
• More work on integrating exposure measurement error into
epidemiological models
• Possibly increased use of social media on its own or in blended
models to estimate exposure (i.e., Ford et al. 2017 Atmos. Chem.
Phys.)
• Cheaper sensors or personal monitoring
Reid CE | NAS 2019References
• DeFlorio-Barker S, Crooks J, Reyes J, Rappold AG. 2019. Cardiopulmonary Effects of Fine Particulate Matter Exposure among Older Adults,
during Wildfire and Non-Wildfire Periods, in the United States 2008-2010. Environ Health Perspect 127:37006; doi:10.1289/EHP3860.
• Ford B, Burke M, Lassman W, Pfister G, Pierce JR. 2017. Status update: is smoke on your mind? Using social media to assess smoke
exposure. Atmos Chem Phys 17:7541–7554; doi:10.5194/acp-17-7541-2017.
• Gan RW, Ford B, Lassman W, Pfister G, Vaidyanathan A, Fischer E, et al. 2017. Comparison of wildfire smoke estimation methods and
associations with cardiopulmonary-related hospital admissions. Geohealth 1:122–136; doi:10.1002/2017GH000073.
• Henderson SB, Brauer M, Macnab YC, Kennedy SM. 2011. Three measures of forest fire smoke exposure and their associations with
respiratory and cardiovascular health outcomes in a population-based cohort. Environmental health perspectives 119:1266–71;
doi:10.1289/ehp.1002288.
• Holstius DM, Reid CE, Jesdale BM, Morello-Frosch R. 2012. Birth weight following pregnancy during the 2003 Southern California wildfires.
Environmental health perspectives 120:1340–5; doi:10.1289/ehp.1104515.
• Lassman W, Ford B, Gan RW, Pfister G, Magzamen S, Fischer EV, et al. 2017. Spatial and temporal estimates of population exposure to
wildfire smoke during the Washington state 2012 wildfire season using blended model, satellite, and in situ data. GeoHealth 1:106–121;
doi:10.1002/2017GH000049.
• Liu JC, Wilson A, Mickley LJ, Dominici F, Ebisu K, Wang Y, et al. 2016. Wildfire-specific Fine Particulate Matter and Risk of Hospital Admissions
in Urban and Rural Counties. Epidemiology (Cambridge, Mass) 28:77–85; doi:10.1097/ede.0000000000000556.
• Liu JC, Wilson A, Mickley LJ, Ebisu K, Sulprizio MP, Wang Y, et al. 2017. Who Among the Elderly Is Most Vulnerable to Exposure to and Health
Risks of Fine Particulate Matter From Wildfire Smoke? Am J Epidemiol 186:730–735; doi:10.1093/aje/kwx141.
• Reid CE, Considine EM, Watson GL, Telesca D, Pfister GG, Jerrett M. 2019. Associations between respiratory health and ozone and fine
particulate matter during a wildfire event. Environment International 129:291–298; doi:10.1016/j.envint.2019.04.033.
• Reid CE, Jerrett M, Petersen ML, Pfister GG, Morefield PE, Tager IB, et al. 2015. Spatiotemporal prediction of fine particulate matter during
the 2008 northern California wildfires using machine learning. Environmental science & technology 49:3887–96; doi:10.1021/es505846r.
• Thelen B, French NH, Koziol BW, Billmire M, Owen RC, Johnson J, et al. 2013. Modeling acute respiratory illness during the 2007 San Diego
wildland fires using a coupled emissions-transport system and generalized additive modeling. Environmental health : a global access science
source 12:94; doi:10.1186/1476-069x-12-94.
• Wu J, Winer A, Delfino R. 2006. Exposure assessment of particulate matter air pollution before, during, and after the 2003 Southern
California wildfires. Atmospheric Environment 40: 3333–3348.
• Yao J, Brauer M, Raffuse SM, Henderson S. 2018. A machine learning approach to estimate hourly exposure to fine particulate matter for
urban, rural, and remote populations during wildfire seasons. Environ
CE ReidSci Technol;
| NAS 2019 doi:10.1021/acs.est.8b01921. 19Thank You!!
Questions?
Colleen.Reid@Colorado.eduYou can also read