Changes in the age-specific body mass index distribution among urban children between 2002 and 2018 in Changsha, China
←
→
Page content transcription
If your browser does not render page correctly, please read the page content below
Original Article

Changes in the age-specific body mass index distribution among
urban children between 2002 and 2018 in Changsha, China
Sha Zhao1#, Xun Li2#^, Shi-Ting Xiang2, Lihua Xie3, Rutong Kang2, Liping Li2, Zhenghui Xiao4^,
Yan Zhong1^
1
    Institute of Child Health, Hunan Children’s Hospital, Changsha, China; 2Pediatrics Research Institute of Hunan Province, Hunan Children’s
Hospital, Changsha, China; 3Outpatient Department, Hunan Children’s Hospital, Changsha, China; 4Hunan Province Key Lab of Pediatric
Emergency Medicine, Hunan Children’s Hospital, Changsha, China
Contributions: (I) Conception and design: S Zhao, X Li, Y Zhong; (II) Administrative support: S Zhao, L Xie, R Kang, L Li, Z Xiao, Y Zhong; (III)
Provision of study materials or patients: S Zhao, L Xie, R Kang, L Li, Z Xiao, Y Zhong; (IV) Collection and assembly of data: S Zhao, X Li, SX, L
Xie, R Kang, L Li, Z Xiao, Y Zhong; (V) Data analysis and interpretation: All authors; (VI) Manuscript writing: All authors; (VII) Final approval of
manuscript: All authors.
#
These authors contributed equally to this work.
Correspondence to: Yan Zhong. Institute of Child Health, Hunan Children’s Hospital, 86 Ziyuan Road, Changsha 410007, China.
Email: yz_hnch@163.com.

                  Background: It had been reported that the increase in the prevalence of childhood overweight and obesity
                  in several developed countries over the decade was largely a consequence of changes in the upper end of the
                  body mass index (BMI) distribution. We speculated that the change in BMI distribution among Chinese
                  children is different from that in developed countries. Therefore, we investigated the changes in the BMI
                  distribution among urban children in Changsha, China.
                  Methods: A secondary data analysis of the 2002 and 2018 Annual Survey on Students’ Constitution and
                  Health from Yuhua District, Changsha City, China was performed. The BMI distribution of children aged
                  6–15 years (n=72,061) was examined by calculating the BMI value at 5th, 50th, 85th, and 95th percentiles.
                  Differences in the BMI value at the 5th, 50th, 85th, and 95th percentiles between 2002 and 2018 according
                  to age and sex were calculated.
                  Results: From 2002 to 2018, the standardized rate of underweight decreased from 6.9% to 3.4%, whereas
                  that of obesity increased from 6.1% to 13.8%. The BMI of the population increased over the 16-year period.
                  The greatest change between the years was seen in the 85th percentile, and moderate changes were seen
                  in the 5th and 50th BMI percentiles. Also, the greatest changes in the BMI percentiles were evident at age
                  12–14 years.
                  Conclusions: The whole spectrum of BMI distribution among school-aged children shifted over the 16-year
                  study period, although the increases were more marked in the upper than lower percentiles. Health professionals
                  and health policymakers should develop strategies and interventions aimed at preventing adverse health effects
                  caused by this change.

                  Keywords: Children; body mass index (BMI); distribution; obesity; overweight

                  Submitted Sep 22, 2020. Accepted for publication Jan 17, 2021.
                  doi: 10.21037/tp-20-305
                  View this article at: http://dx.doi.org/10.21037/tp-20-305

^ ORCID: Xun Li, 0000-0002-5070-8950; Zhenghui Xiao, 0000-0003-2056-8798; Yan Zhong, 0000-0003-1132-5567.

© Translational Pediatrics. All rights reserved.                           Transl Pediatr 2021;10(3):502-509 | http://dx.doi.org/10.21037/tp-20-305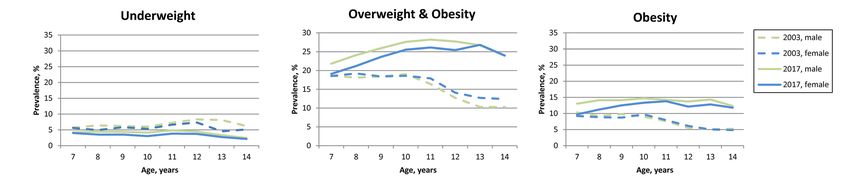
Translational Pediatrics, Vol 10, No 3 March 2021                                                                                                  503

Introduction                                                                        We present the following article in accordance with the
                                                                                 STROBE reporting checklist (available at http://dx.doi.
To g e t h e r w i t h s o c i o e c o n o m i c d e v e l o p m e n t a n d     org/10.21037/tp-20-305).
transformation of lifestyle, the childhood obesity epidemic
in different part of this world has changed over time (1-4).
                                                                                 Methods
Although the childhood obesity rate has plateaued in some
developed countries, it is increasing in rapidly developing                      Study setting and participants
countries, such as China (5,6). The prevalence of overweight
                                                                                 This study was a secondary data analysis of the 2002 and
and obesity among school-aged children in China has
                                                                                 2018 Annual Survey on Students’ Constitution and Health
increased from 5.3% in 1995 to 20.5% in 2014 (7).
                                                                                 from Yuhua District, Changsha City, China. The survey
   Understanding how the BMI distribution changes over
                                                                                 was sponsored by the Education Bureau of Changsha City.
time can allow identification of subpopulations susceptible to
                                                                                 The participants were primary or middle school students. A
overweight and obesity, enabling the development of tailored
interventions (8,9). Studies had investigated the changes in                     random cluster sampling method was used to select schools
the shape and location of BMI distributions over the last                        from Yuhua District. All students at the selected schools
decades in several developed countries, and found the most                       underwent standard physical examinations. Children aged
pronounced elevations in BMI have occurred in the upper                          less than 6 years or more than 15 years from the dataset
part of the BMI spectrum ( >75th percentiles), whereas little                    were excluded from the analysis. In China, school-aged
or no changes have occurred below the 50th percentile (10-14).                   children must complete nine years of compulsory education
These studies concluded that the increases in the mean BMI                       in primary (6 years) and middle (3 years) school, starting
and prevalence of overweight and obesity in children have                        primary school at 6 to 7 years of age. Therefore, surveys in
resulted mainly from the pronounced change in the upper end                      primary and middle schools take into account the majority
of the BMI spectrum, suggesting that the factors leading to                      (>98%) of children 6–15 years of age in the study region.
BMI changes were changed in only a subgroup of the school-                          The authors are accountable for all aspects of the work in
aged population (10-12).                                                         ensuring that questions related to the accuracy or integrity
   However, we speculated that the pattern of change                             of any part of the work are appropriately investigated and
in the BMI distribution in China is different from that                          resolved. The study protocol was reviewed and approved
in developed countries, because the increased obesity                            by the Medical Ethics Committee of the Hunan Children’s
prevalence in China is accompanied by reduced rates of                           Hospital (HCHLL-2019-41). The study was conducted
stunting and thinness (7,15); therefore, the entire spectrum                     in accordance with the Declaration of Helsinki (as revised
of BMI distribution may have shifted. The aim of this study                      in 2013). Informed consent was waived because this was
was to investigate the changes in the BMI distribution of                        a retrospective study, and the authors had no access to
Chinese children overtime and identify the age at which the                      information that could identify individual participants
BMI distribution is most sensitive to change.                                    during and after data collection.
   We chose the Yuhua District of Changsha City as the
study site. Changsha is a second-tier city located in central
                                                                                 Measurements and variables
south China. The lifestyle in Changsha has changed
dramatically over the past two decades as a result of rapid                      Age (years), sex, height, and weight were collected from
socioeconomic development. Yuhua District is one of                              the Annual Survey on Students’ Constitution and Health
six districts of Changsha City, and it covers 292 square                         dataset. Height and weight were measured by a team of
kilometers. The gross domestic product of Yuhua District                         health professionals, following the Handbook of National
increased from ¥2,425 million in 2002 to ¥188,816 million                        Student Constitution and Health Survey. BMI was
in 2018. We investigated the prevalence of underweight,                          calculated as weight in kilograms divided by the square of
overweight, and obesity among children aged 6–15 years in                        height in meters. The weight status of children was defined
Yuhua District in 2002 and 2018. The distribution of BMI                         according to BMI percentile based on growth charts for
was examined as the BMI values at 5th, 50th, 85th, and 95th                      Chinese children and adolescents aged 0–18 years (16).
percentiles. And the changes of BMI percentiles over time                        The growth charts provide age and sex-specific BMI cutoff
were calculated according to age and sex.                                        values for underweight (BMI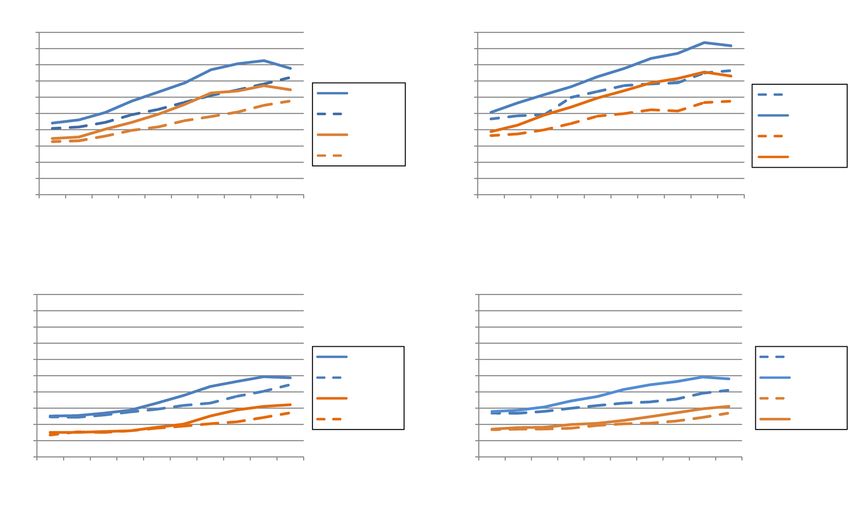
504                                                                   Zhao et al. Changes in the BMI distribution among Chinese children

 Table 1 Sample size of the study population according to sex and         2003 and 2017 Annual Survey on Students’ Constitution
 survey year, Yuhua District, Changsha, China                             and Health. As data for children aged 6 and 15 years
                                               Survey year                were not available in the 2003 dataset, the sensitivity
 Sex and age (years)
                                       2002                  2018         analyses were performed in children aged 7–14 years. The
                                                                          standardized rates of the weight status; the age and sex-
 All participants
                                                                          specific prevalence of underweight, overweight and obesity;
   6–15                               26,644                 45,417       and the BMI at 5th, 50th, 85th, and 95th percentile by age
      6–10                            14,345                 25,310       and sex in 2003 and 2017 were calculated.
      11–15                           12,299                 20,107

 Males                                                                    Results
   6–15                               14,127                 24,214       The sample sizes of the two surveys are shown in Table 1.
      6–10                            7,570                  13,289       In 2002 and 2018, 26,644 and 45,417 children 6–15 years
      11–15                           6,557                  10,925       of age, respectively, participated in the health survey. All
                                                                          participants had complete records for age, sex, height, and
 Females
                                                                          weight; therefore, no participants were excluded because of
   6–15                               12,517                 21,203       missing data.
      6–10                            6,775                  12,021          The distributions of weight status according to sex and
      11–15                           5,742                  9,182
                                                                          survey year are presented in Table 2. The standardized rate
                                                                          of underweight decreased from 6.9% in 2002 to 3.4% in
                                                                          2018, and that of overweight increased from 7.3% in 2002
                                                                          to 12.4% in 2018. The prevalence of obesity increased from
weight (BMI 5th–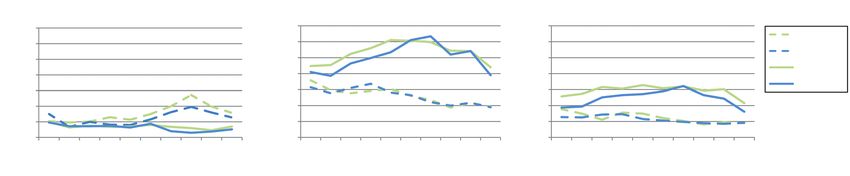
Translational Pediatrics, Vol 10, No 3 March 2021                                                                                                                                                 505

 Table 2 Distribution of weight status according to sex and survey year among children 6–15 years
                                                              Crude rates, % (95% CI)                                                                Standardized ratesa, % (95% CI)
 Weight status and sex
                                                         2002                                          2018                                          2002                      2018

 Underweight

     Both sexes                                      6.8 (6.5, 7.1)                                3.4 (3.2, 3.5)                               6.9 (6.6, 7.2)             3.4 (3.2, 3.5)

       Male                                          7.5 (7.0, 7.9)                                3.5 (3.3, 3.7)                               7.5 (7.1, 8.0)             3.5 (3.3, 3.7)

       Female                                        6.0 (5.6, 6.4)                                3.2 (3.0, 3.4)                               6.1 (5.7, 6.5)             3.2 (3.0, 3.4)

 Healthy weight

     Both sexes                                     79.9 (79.4, 80.4)                            70.5 (70.1, 70.9)                          79.8 (79.3, 80.2)             70.4 (70, 70.8)

       Male                                         79.2 (78.6, 79.9)                            69.6 (69.0, 70.1)                          79.1 (78.4, 79.8)            69.5 (68.9, 70.1)

       Female                                       80.6 (79.9, 81.3)                            71.5 (70.9, 72.1)                          80.5 (79.8, 81.2)            71.5 (70.9, 72.1)

 Overweight

     Both sexes                                      7.3 (7.0, 7.6)                              12.3 (12.0, 12.6)                               7.3 (7, 7.6)            12.4 (12.1, 12.7)

       Male                                          7.0 (6.6, 7.4)                              12.0 (11.6, 12.4)                               7 (6.6, 7.5)            12.1 (11.7, 12.5)

       Female                                        7.6 (7.1, 8.0)                              12.6 (12.2, 13.1)                              7.6 (7.2, 8.1)           12.7 (12.2, 13.1)

 Obesity

     Both sexes                                      6.1 (5.8, 6.3)                              13.8 (13.5, 14.2)                              6.1 (5.8, 6.4)           13.8 (13.5, 14.2)

       Male                                          6.3 (5.9, 6.7)                              14.9 (14.5, 15.4)                              6.3 (5.9, 6.7)           14.9 (14.5, 15.4)

       Female                                        5.8 (5.4, 6.2)                              12.6 (12.2, 13.1)                              5.8 (5.4, 6.2)           12.6 (12.2, 13.1)
 a
  , rates were adjusted by age and sex, using the sum of both population as the standard population. CI, confidence interval.

                                      Underweight                                          Overweight & obesity                                             Obesity
                      35                                                      35                                                       35
                                                                                                                                                                                   2002, male
                      30                                                      30                                                       30
      Prevalence, %

                                                              Prevalence, %

                                                                                                                       Prevalence, %

                                                                                                                                                                                   2002, female
                      25                                                      25                                                       25
                                                                                                                                                                                   2018, male
                      20                                                      20                                                       20
                                                                                                                                                                                   2018, female
                      15                                                      15                                                       15
                      10                                                      10                                                       10
                       5                                                       5                                                        5
                       0                                                       0                                                        0
                           6   7   8 9 10 11 12 13 14 15                           6   7    8 9 10 11 12 13 14 15                           6    7   8 9 10 11 12 13 14 15
                                      Age, years                                              Age, years                                               Age, years

Figure 1 Age and sex-specific prevalence of underweight, overweight, and obesity among children in 2002 and 2018, Yuhua District,
Changsha, China.

BMI percentile was moderately elevated from 2002 to 2018                                                      also observed at the 95th percentiles, with growth in percent
in most ages, with most growths less than 10%. In males,                                                      ranging from 4.2% to 15.2% among male, and from 3.6%
the BMI at 50th percentile increased by >10% after 11 years                                                   to 14.2% among female. Overall, the greatest change in the
of age. For female, the growth of BMI at 50th percentile                                                      value of BMI percentiles occurred at age 12–14 years.
increased until the age of 12 years (+12.27%), and slowed
down thereafter. The greatest change in BMI from 2002 to
                                                                                                              Sensitivity analysis
2018 was in the 85th percentile, with differences in percent
ranging from 2.8% to 19.7% among male, and from 2.2%                                                          Sensitivity analyses were conducted using data from the
to 14.8% among female. Substantial increases in BMI were                                                      2003 and 2017 Annual Survey on Students’ Constitution

© Translational Pediatrics. All rights reserved.                                                          Transl Pediatr 2021;10(3):502-509 | http://dx.doi.org/10.21037/tp-20-305
506 Zhao et al. Changes in the BMI distribution among Chinese children
Female Male
30 30
28 28
26 26
24 24
22 2018, p95 22 2002, p95
BMI
BMI
20 2002, p95 20 2018, p95
18 2018, p85 18
2002, p85
16 16
2002, p85 2018, p85
14 14
12 12
10 10
6 7 8 9 10 11 12 13 14 15 6 7 8 9 10 11 12 13 14 15
Age, years Age, years
Female Male
30 30
28 28
26 26
24 24
22 2018, p50 22 2002, p50
BMI
20 20
BMI
2002, p50 2018, p50
18 18
2018, p5 2002 p5
16 16
14 2002, p5 14 2018, p5
12 12
10 10
6 7 8 9 10 11 12 13 14 15 6 7 8 9 10 11 12 13 14 15
Age, years Age, years
Figure 2 Distribution of BMI at 5th, 50th, 85th, and 95th percentile according to age and sex among children in 2002 and 2018, Yuhua
District, Changsha, China. p5, 5th percentile; p50, 50th percentile; p85, 85th percentile; p95, 95th percentile. BMI, body mass index.
and Health. The standardized rate of underweight decreased obesity, as well as the decreased prevalence of underweight
from 6.2% in 2003 to 3.8% in 2017, while the prevalence over the 16-year period are consistent with other studies
of overweight increased from 8.6% in 2003 to 11.7% in in Chinese populations (15,18-21). Because of regional
2017, and the prevalence of obesity increased from 8.1% in disparities in socioeconomic development in China, the
2003 to 13.1% in 2017 (Table S1). The distributions of the epidemic of overweight and obesity started to emerge in all
age and sex-specific prevalence of underweight, overweight parts of China with different speed (20). Without immediate
and obesity in 2003 and 2017 are presented in Figure S1. interventions, it could be foreseen that the increasing trends
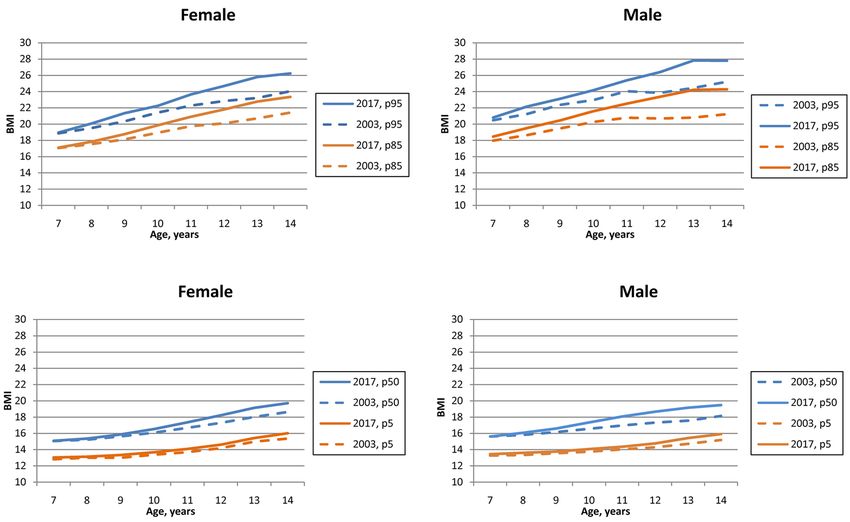
The BMI at 5th, 50th, 85th, and 95th percentile according in the prevalence of overweight and obesity in China would
to age and sex in 2003 and 2017 are shown in Figure S2. be sustained in the years to come.
The differences in the age and sex-specific prevalence of Comparing the age specific BMI distributions over time
three weight statuses and in the BMI percentiles between can pinpoint the ages at which BMI is sensitive to change,
2003 and 2017 were similar to those differences between allowing identification of the susceptible age groups to
2002 and 2018, but in a relatively more gradual and gentle launch interventions. In this study, the changes of BMI in
manner. percentiles increased with age in both sexes. Similar patterns
had been observed in the 95th percentile among children
in the United States, 1988–1994 through 2013–2014 (13).
Discussion
Whether this is because the BMI of older children are more
The prevalence of underweight decreased from 6.8% in 2002 sensitive to lifestyle changes or a result of a cumulative
to 3.4% in 2018 among children 11–15 years of age, and that effect of lifestyle changes on weight status is unclear.
obesity increased from 6.1% to 13.8%. The BMI of the entire However, our data suggest the need for interventions to
population increased over the 16-year study period in both prior to 12 years of age.
sexes, and the greatest change was seen in the 85th percentile, Studies in several developed countries showed that the
with moderate changes seen in the 5th and 50th percentiles. increases in mean BMI and prevalence of obesity were
As for the age specific changes of BMI distribution, the caused by an increase of BMI among children who were in
greatest changes occurred at the 12–14 years of age. the upper BMI percentiles (10-14). For example, Kurokawa
Our findings of increased prevalence of overweight and et al. analyzed the trends of BMI distribution in Japanese
© Translational Pediatrics. All rights reserved. Transl Pediatr 2021;10(3):502-509 | http://dx.doi.org/10.21037/tp-20-305Translational Pediatrics, Vol 10, No 3 March 2021 507
Table 3 Changes in BMI percentiles from 2002 to 2018 according to sex and age, Yuhua District, Changsha, China
5th percentile 50th percentile 85th percentile 95th percentile
Sex Age
a a a
Difference % Difference % Difference % Differencea %
Male 6 0.07 0.52 0.19 1.23 0.49 2.84 0.82 4.24
7 0.19 1.42 0.37 2.41 1.09 6.24 1.59 8.07
8 0.21 1.56 0.54 3.46 1.83 10.18 2.48 12.50
9 0.46 3.40 0.90 5.63 2.03 10.83 1.31 5.96
10 0.25 1.80 1.11 6.80 2.24 11.39 1.82 8.01
11 0.42 2.99 1.67 10.04 2.83 14.16 2.11 9.00
12 0.80 5.65 2.11 12.58 3.33 16.28 3.14 13.28
13 1.02 7.08 2.15 12.56 4.00 19.70 3.62 15.22
14 1.06 7.13 2.00 11.21 3.76 17.62 3.73 14.92
15 0.83 5.39 1.40 7.69 3.10 14.41 3.06 12.10
Female 6 0.31 2.44 0.10 0.67 0.37 2.24 0.66 3.64
7 −0.07 −0.50 0.20 1.34 0.45 2.70 0.87 4.75
8 0.11 0.85 0.23 1.52 0.85 4.94 1.22 6.46
9 0 0 0.21 1.35 0.99 5.53 1.68 8.47
10 0.11 0.81 0.76 4.79 1.56 8.51 2.14 10.44
11 0.24 1.74 1.23 7.53 2.00 10.47 2.39 11.18
12 0.95 6.75 2.04 12.27 2.90 14.78 3.17 14.27
13 1.47 10.3 1.82 10.42 2.60 12.89 3.23 14.11
14 1.37 9.23 1.80 9.96 2.42 11.52 2.88 12.19
15 0.99 6.42 0.85 4.50 1.38 6.41 1.12 4.58
a 2
, unit: kg/m . BMI, body mass index.
children from 1989 to 2003, and found little or no change past two decades has led to a dramatic change in lifestyle,
in the 10th and 25th percentiles. However, the increases in resulting in an obesity epidemic (22,23). This change is
the 75th and 90th percentiles were more marked than that in now affecting the health of the younger generation (7,22).
the 50th percentile among primary school children (11). The The increase in BMI among children of all ages and in all
authors speculated that a subgroup of the population (in the BMI percentiles was unsurprising and indicates the need
upper percentiles of BMI) is more susceptible to factors that for actions to prevent adverse consequences. The health
increase the risk of overweight and obesity (11). However, we consequence of the shift in BMI distribution should be
found a shift in the BMI distribution in the entire population, investigated, and interventions are needed to slow the
although the increases in the upper percentiles were more increasing obesity prevalence and prevent related adverse
marked than those in the lower percentiles. Unlike in health effects.
developed countries, the BMI shift in this study indicated that This study had several limitations. First, BMI was used
the factors that contributing to the increased BMI influenced to evaluate overweigh and obesity. Although BMI is an
the entire population. This finding emphasizes the need for imperfect measure of body fat and adiposity (24,25), it is the
studies on the short- and long-term effect of increasing BMI most feasible and widely used measurement in public health
on population health. surveillance (1,7,17,26,27). The weight status of children
The rapid socioeconomic development in China over the and teenagers is defined according to BMI percentiles for
© Translational Pediatrics. All rights reserved. Transl Pediatr 2021;10(3):502-509 | http://dx.doi.org/10.21037/tp-20-305508 Zhao et al. Changes in the BMI distribution among Chinese children
age and sex. As shown in this study, the BMI distribution Data Sharing Statement: Available at http://dx.doi.
is changing, meaning that BMI percentile values are not org/10.21037/tp-20-305
fixed. To make the distribution of weight status comparable
between 2002 and 2018, fixed cutoff points to define weight Conflicts of Interest: All authors have completed the ICMJE
status are needed (26). Therefore, we used the cutoffs from uniform disclosure form (available at http://dx.doi.
the growth charts delivered in 2009 (16), which are still in org/10.21037/tp-20-305). The authors have no conflicts of
use in China in 2020. Second, as a retrospective study, we interest to declare.
analyzed available data only and thus could not evaluate
factors associated with the BMI change. Also, as a cross- Ethical Statement: The authors are accountable for all
sectional study, we could not analyze the BMI trajectory. aspects of the work in ensuring that questions related
Predicting age-specific trends in BMI shifting and to the accuracy or integrity of any part of the work
developing targeted interventions will require identification are appropriately investigated and resolved. The study
of the associated factors and their effect sizes. Therefore, protocol was reviewed and approved by the Medical
a further longitudinal study is needed. Third, this study Ethics Committee of the Hunan Children’s Hospital
used cross-sectional data from 2002 and 2018, and not the (HCHLL- 2019- 41). Th e study was con du c t ed i n
yearly data in between; therefore, we could not investigate accordance with the Declaration of Helsinki (as revised in
the pattern and changing trend in BMI over the 16-year 2013). The requirement for written informed consent was
period. To predict future changes in BMI and evaluate waived by the Medical Ethics Committee of the Hunan
the effectiveness of interventions, annual changes in BMI Children’s Hospital.
distribution need to be monitored. Fourth, this study
was conducted in a single district in China, limiting the Open Access Statement: This is an Open Access article
generalization of the findings. Further studies are needed distributed in accordance with the Creative Commons
to investigate whether other regions in China and other Attribution-NonCommercial-NoDerivs 4.0 International
developing countries are undergoing similar transitions in License (CC BY-NC-ND 4.0), which permits the non-
BMI distribution, and what kind of interventions are needed commercial replication and distribution of the article with
to prevent adverse health consequences. the strict proviso that no changes or edits are made and the
original work is properly cited (including links to both the
formal publication through the relevant DOI and the license).
Conclusions
See: https://creativecommons.org/licenses/by-nc-nd/4.0/.
The whole spectrum of BMI distribution among school-
aged children in Yuhua District was shifted over the 16-
References
year study period in both sexes. The increases in BMI were
moderate at the 5th and 50th percentiles, and was greatest 1. Ng M, Fleming T, Robinson M, et al. Global, regional,
at 85th percentile. Further studies should investigate and national prevalence of overweight and obesity in
the short- and long-term effects of increasing BMI on children and adults during 1980–2013: a systematic
population health, and interventions to prevent the adverse analysis for the Global Burden of Disease Study 2013.
health effects of increased BMI are needed. Lancet 2014;384:766-81.
2. de Onis M, Blossner M, Borghi E. Global prevalence
and trends of overweight and obesity among preschool
Acknowledgments
children. Am J Clin Nutr 2010;92:1257-64.
Funding: This work was supported by the Science 3. Wang Y, Lim H. The global childhood obesity epidemic
Foundation of Hunan Children’s Hospital (2019-A). and the association between socio-economic status and
childhood obesity. Int Rev Psychiatry 2012;24:176-88.
4. NCD Risk Factor Collaboration. Worldwide trends in
Footnote
body-mass index, underweight, overweight, and obesity
Reporting Checklist: The authors have completed the from 1975 to 2016: a pooled analysis of 2416 population-
STROBE reporting checklist. Available at http://dx.doi. based measurement studies in 128.9 million children,
org/10.21037/tp-20-305 adolescents, and adults. Lancet 2017;390:2627-42.
© Translational Pediatrics. All rights reserved. Transl Pediatr 2021;10(3):502-509 | http://dx.doi.org/10.21037/tp-20-305Translational Pediatrics, Vol 10, No 3 March 2021 509
5. Wabitsch M, Moss A, Kromeyer-Hauschild K. Unexpected childhood overweight and obesity. Natl Health Stat Report
plateauing of childhood obesity rates in developed 2010;(25):1-5.
countries. BMC Med 2014;12:17. 18. Zhai L, Dong Y, Bai Y, et al. Trends in obesity, overweight,
6. Olds T, Maher C, Zumin S, et al. Evidence that the and malnutrition among children and adolescents in
prevalence of childhood overweight is plateauing: data Shenyang, China in 2010 and 2014: a multiple cross-
from nine countries. Int J Pediatr Obes 2011;6:342-60. sectional study. BMC Public Health 2017;17:151.
7. Dong Y, Jan C, Ma Y, et al. Economic development and 19. Zhang YX, Wang ZX, Zhao JS, et al. Trends in overweight
the nutritional status of Chinese school-aged children and obesity among rural children and adolescents from
and adolescents from 1995 to 2014: an analysis of five 1985 to 2014 in Shandong, China. Eur J Prev Cardiol
successive national surveys. Lancet Diabetes Endocrinol 2016;23:1314-20.
2019;7:288-99. Erratum in: Lancet Diabetes Endocrinol. 20. Jia P, Xue H, Zhang J, et al. Time Trend and Demographic
2019 May;7(5):e5. doi: 10.1016/S2213-8587(19)30110-X. and Geographic Disparities in Childhood Obesity
Epub 2019 Mar 20. Prevalence in China-Evidence from Twenty Years of
8. Hayes A, Gearon E, Backholer K, et al. Age-specific Longitudinal Data. Int J Environ Res Public Health
changes in BMI and BMI distribution among Australian 2017;14:369.
adults using cross-sectional surveys from 1980 to 2008. Int 21. Song Y, Wang HJ, Dong B, et al. 25-year trends in gender
J Obes (Lond) 2015;39:1209-16. disparity for obesity and overweight by using WHO and
9. Benjamin Neelon SE, Ostbye T, Hales D, et al. Preventing IOTF definitions among Chinese school-aged children: a
childhood obesity in early care and education settings: multiple cross-sectional study. BMJ Open 2016;6:e011904.
lessons from two intervention studies. Child Care Health 22. Zhao P, Gu X, Qian D, et al. Socioeconomic disparities
Dev 2016;42:351-8. in abdominal obesity over the life course in China. Int J
10. Eriksson M, Rasmussen F, Nordqvist T. Changes in shape Equity Health 2018;17:96.
and location of BMI distributions of Swedish children. 23. Wang Y, Mi J, Shan XY, et al. Is China facing an
Acta Paediatr 2005;94:1558-65. obesity epidemic and the consequences? The trends in
11. Kurokawa N, Nakai K, Suzuki K, et al. Trends of body obesity and chronic disease in China. Int J Obes (Lond)
mass index distribution in schoolchildren in Sendai, Japan, 2007;31:177-88.
1989-2003. Obes Res Clin Pract 2009;3:1-52. 24. Rothman KJ. BMI-related errors in the measurement of
12. Ekblom O, Oddsson K, Ekblom B. Prevalence and obesity. Int J Obes (Lond) 2008;32 Suppl 3:S56-9.
regional differences in overweight in 2001 and trends in 25. Gómez-Ambrosi J, Silva C, Galofre JC, et al. Body
BMI distribution in Swedish children from 1987 to 2001. mass index classification misses subjects with increased
Scand J Public Health 2004;32:257-63. cardiometabolic risk factors related to elevated adiposity.
13. Ogden CL, Carroll MD, Lawman HG, et al. Trends in Int J Obes (Lond) 2012;36:286-94.
Obesity Prevalence Among Children and Adolescents in 26. Must A, Anderson SE. Body mass index in children
the United States, 1988-1994 Through 2013-2014. JAMA and adolescents: considerations for population-based
2016;315:2292. applications. Int J Obes (Lond) 2006;30:590-4.
14. Kalies H, Lenz J, von Kries R. Prevalence of overweight 27. Ogden CL, Fryar CD, Hales CM, et al. Differences in
and obesity and trends in body mass index in German Obesity Prevalence by Demographics and Urbanization
pre-school children, 1982-1997. Int J Obes Relat Metab in US Children and Adolescents, 2013-2016. JAMA
Disord 2002;26:1211-7. 2018;319:2410-8.
15. Song Y, Agardh A, Ma J, et al. National trends in stunting,
thinness and overweight among Chinese school-aged
Cite this article as: Zhao S, Li X, Xiang ST, Xie L, Kang R,
children, 1985-2014. Int J Obes (Lond) 2019;43:402-11.
Li L, Xiao Z, Zhong Y. Changes in the age-specific body mass
16. Li H, Ji CY, Zong XN, et al. Body mass index growth
index distribution among urban children between 2002 and
curves for Chinese children and adolescents aged 0 to 18
2018 in Changsha, China. Transl Pediatr 2021;10(3):502-509.
years. Zhonghua Er Ke Za Zhi 2009;47:493-8.
doi: 10.21037/tp-20-305
17. Ogden CL, Flegal KM. Changes in terminology for
© Translational Pediatrics. All rights reserved. Transl Pediatr 2021;10(3):502-509 | http://dx.doi.org/10.21037/tp-20-305Supplementary Figure S1 Age and sex-specific prevalence of underweight, overweight, and obesity among children in 2003 and 2017, Yuhua District, Changsha, China. Figure S2 Distribution of BMI at 5th, 50th, 85th, and 95th percentile by age and sex among children from Yuhua District, Changsha, China in 2003 and 2017. p5, 5th percentile; p50, 50th percentile; p85, 85th percentile; p95, 95th percentile. BMI, body mass index. © Translational Pediatrics. All rights reserved. http://dx.doi.org/10.21037/tp-20-305
Table S1 Standardized rates of underweight, healthy weight, overweight, and obesity in 2003 and 2017 among children 7–14 years, Yuhua
 District, Changsha, China
                                                                                 Standardized ratesa, % (95% CI)
 Weight status and sex
                                                                    2003                                               2017

 Underweight

     Both sexes                                                 6.2 (6.0, 6.4)                                     3.8 (3.7, 3.9)

      Male                                                      6.6 (6.4, 6.9)                                     4.1 (3.9, 4.3)

      Female                                                    5.6 (5.4, 5.9)                                     3.4 (3.2, 3.6)

 Healthy weight

     Both sexes                                               77.1 (76.7, 77.4)                                71.5 (71.1, 71.8)

      Male                                                    77.0 (76.5, 77.5)                                70.2 (69.7, 70.6)

      Female                                                  77.2 (76.7, 77.7)                                73.0 (72.5, 73.4)

 Overweight

     Both sexes                                                 8.6 (8.4, 8.9)                                 11.7 (11.5, 11.9)

      Male                                                      8.2 (7.9, 8.5)                                 11.8 (11.5, 12.1)

      Female                                                    9.2 (8.8, 9.5)                                 11.6 (11.2, 11.9)

 Obesity

     Both sexes                                                 8.1 (7.9, 8.3)                                 13.1 (12.8, 13.3)

      Male                                                      8.2 (7.9, 8.5)                                 13.9 (13.6, 14.2)

      Female                                                    8.0 (7.7, 8.3)                                 12.1 (11.7, 12.4)
 a
  , rates were adjusted by age and sex, using the sum of both population as the standard population. CI, confidence interval.

© Translational Pediatrics. All rights reserved.                                                           http://dx.doi.org/10.21037/tp-20-305
You can also read