Risk of Coronavirus Disease 2019 Transmission in Train Passengers: an Epidemiological and Modeling Study
←
→
Page content transcription
If your browser does not render page correctly, please read the page content below
Clinical Infectious Diseases
MAJOR ARTICLE
Risk of Coronavirus Disease 2019 Transmission in Train
Passengers: an Epidemiological and Modeling Study
Maogui Hu,1,a Hui Lin,2,a Jinfeng Wang,1 Chengdong Xu,1 Andrew J. Tatem,3 Bin Meng,4 Xin Zhang,5 Yifeng Liu,2 Pengda Wang,2 Guizhen Wu,6
Haiyong Xie,2,7,a and Shengjie Lai3,8,a
1
State Key Laboratory of Resources and Environmental Information System, Institute of Geographic Sciences and Natural Resources Research, Chinese Academy of Sciences, Beijing, China,
Downloaded from https://academic.oup.com/cid/advance-article/doi/10.1093/cid/ciaa1057/5877944 by guest on 24 October 2020
2
China Academy of Electronics and Information Technology, Beijing, China, 3WorldPop, School of Geography and Environmental Science, University of Southampton, Southampton, United Kingdom,
4
Beijing Union University, Beijing, China, 5Aerospace Information Research Institute, Chinese Academy of Sciences, Beijing, China, 6Chinese Center for Disease Control and Prevention, Beijing,
China, 7University of Science and Technology of China, Hefei, China, and 8School of Public Health, Fudan University, Shanghai, China
Background. Train travel is a common mode of public transport across the globe; however, the risk of coronavirus disease 2019
(COVID-19) transmission among individual train passengers remains unclear.
Methods. We quantified the transmission risk of COVID-19 on high-speed train passengers using data from 2334 index patients
and 72 093 close contacts who had co-travel times of 0–8 hours from 19 December 2019 through 6 March 2020 in China. We ana-
lyzed the spatial and temporal distribution of COVID-19 transmission among train passengers to elucidate the associations between
infection, spatial distance, and co-travel time.
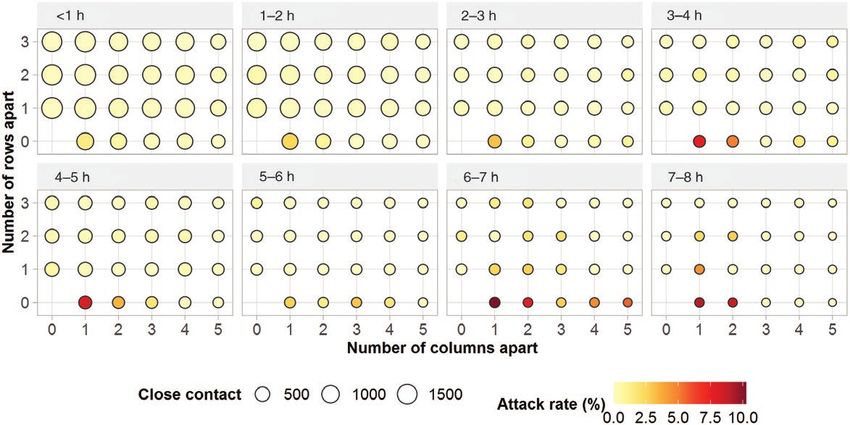
Results. The attack rate in train passengers on seats within a distance of 3 rows and 5 columns of the index patient varied from
0 to 10.3% (95% confidence interval [CI], 5.3%–19.0%), with a mean of 0.32% (95% CI, .29%–.37%). Passengers in seats on the same
row (including the adjacent passengers to the index patient) as the index patient had an average attack rate of 1.5% (95% CI, 1.3%–
1.8%), higher than that in other rows (0.14% [95% CI, .11%–.17%]), with a relative risk (RR) of 11.2 (95% CI, 8.6–14.6). Travelers
adjacent to the index patient had the highest attack rate (3.5% [95% CI, 2.9%–4.3%]) of COVID-19 infection (RR, 18.0 [95% CI,
13.9–23.4]) among all seats. The attack rate decreased with increasing distance, but increased with increasing co-travel time. The
attack rate increased on average by 0.15% (P = .005) per hour of co-travel; for passengers in adjacent seats, this increase was 1.3%
(P = .008), the highest among all seats considered.
Conclusions. COVID-19 has a high transmission risk among train passengers, but this risk shows significant differences with
co-travel time and seat location. During disease outbreaks, when traveling on public transportation in confined spaces such as trains,
measures should be taken to reduce the risk of transmission, including increasing seat distance, reducing passenger density, and use
of personal hygiene protection.
Keywords. COVID-19; SARS-CoV-2; train; co-travel time; spatial distance.
Coronavirus disease 2019 (COVID-19) was first identified in early stages [5, 7, 12]. Additionally, significant correlations were
Wuhan, China, in early December 2019 [1], with a subsequent found between case numbers and the volume of domestic trans-
spread across the globe. Population movements within and be- portation, including flights, trains, and buses [13, 14]. Travel re-
tween regions and countries play a key role in seeding the virus strictions and social distancing measures have been introduced
and accelerating COVID-19 spread [2–5]. For instance, the across countries to contain or mitigate COVID-19 transmission
large-scale travel during the Lunar New Year holiday facilitated [15, 16]. However, only meta-population-level transportation
the transmission of COVID-19 in China [6, 7]. Meanwhile, cases data and models were used in those studies to measure the po-
related to domestic and international travel have been reported tential risk of seeding the virus between locations [17–20], and
in many countries, such as Canada, France, and the United how COVID-19 transmits between individual travelers on spe-
States [8–11]. Based on air travel data, studies have assessed cific transportation modes remains unknown.
the risk of potential international spread of the disease in the Trains are one of the most common and important modes of
transportation in many countries, especially in European and
Asian countries. In China, the high-speed train (G train) car-
Received 20 June 2020; editorial decision 17 July 2020; accepted 21 July 2020; published ried an estimated 2 billon passengers in 2018, which is 3.3 times
online July 29, 2020. the number the passengers carried by airplanes. Additionally,
a
M. H., H. L., H. X., and S. L. contributed equally to this work.
Correspondence: J. Wang, Institute of Geographic Sciences and Natural Resources Research,
the G train is the most widely used train in China, transporting
Chinese Academy of Sciences, China (wangjf@lreis.ac.cn). more passengers than any other type of train and accounting for
Clinical Infectious Diseases® 2020;XX(XX):1–7 >60% of the country’s rail passengers [21, 22]. The 2020 Lunar
© The Author(s) 2020. Published by Oxford University Press for the Infectious Diseases Society
of America. All rights reserved. For permissions, e-mail: journals.permissions@oup.com.
New Year travel season in China started on 10 January 2020, at
DOI: 10.1093/cid/ciaa1057 the early stage of the COVID-19 outbreak. Approximately 150
Risk of COVID-19 Transmission During Train Travel • cid 2020:XX (XX XXXX) • 1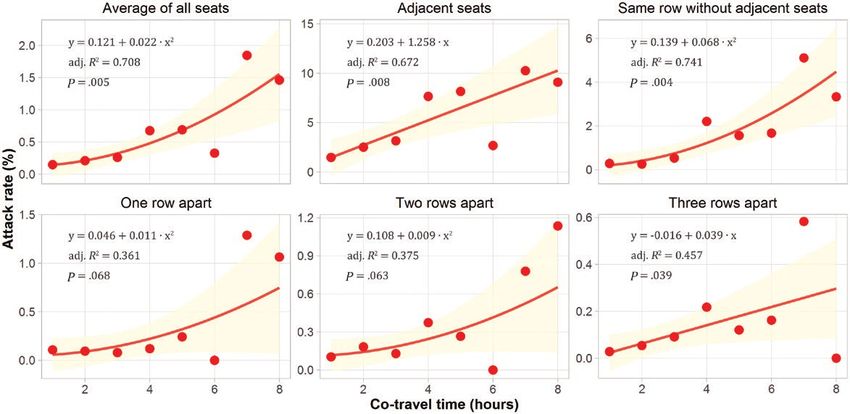
million passengers traveled by train across China [23] from 10 queried from the China railway-booking website (www.12306.
January through 23 January 2020, when the Chinese govern- cn) to calculate travel time between each pair of departure
ment imposed a full lockdown on Wuhan and other cities in and destination stations. Considering that the incubation pe-
Hubei province. At least 1058 persons with COVID-19 might riod of COVID-19 is up to 14 days, the G train travel records
have traveled by train before Wuhan’s lockdown [24]. However, were restricted to before 25 February 2020. Based on the date of
the risk and relevant factors of COVID-19 transmission among symptom onset, finally, 2334 train passengers were included as
train passengers remain unclear. index patients in different coaches, while 234 passengers among
Using itinerary data from anonymous passengers who were 72 093 close contacts, whose seat was within the distance of 3
later diagnosed as COVID-19 cases and their close contacts on rows to an index patient, have been subsequently confirmed as
G trains during the outbreak from December 2019 through secondary COVID-19 cases.
Downloaded from https://academic.oup.com/cid/advance-article/doi/10.1093/cid/ciaa1057/5877944 by guest on 24 October 2020
March 2020 in China, we attempted to quantify the individual-
level risk of COVID-19 transmission during travel. We inves- Data Analysis
tigated the attack risk of COVID-19 in train travelers as well Based on the close contact data, we calculated COVID-19 attack
as the correlations between the risk of infection and seat loca- rates by different seat locations referring to the seat occupied by
tions, spatial distance, and travel duration on trains. Findings an index patient on a train, accounting for the effect of co-travel
from our study provide improved evidence to tailor interven- time (Figure 1). For each coach, the case with the earliest date of
tion strategies to reduce the risk of COVID-19 transmission onset was considered as an index patient in that coach. The attack
during travel. rate for each seat between 19 December 2019 and 6 March 2020
was defined as the number of passengers on this seat who were
diagnosed as COVID-19 cases, divided by the total number of pas-
METHODS
sengers who were on the same seat and travel with index patients
Data Sources in a coach. Wilson binomial 95% confidence intervals (CIs) were
Epidemiological investigations of COVID-19 cases and their calculated for each point estimate of the attack rate.
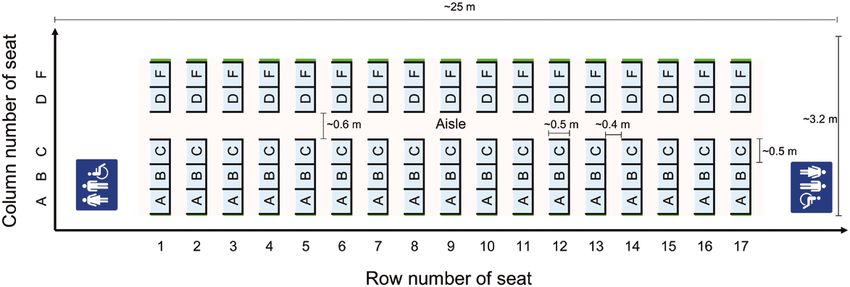
close contacts were conducted by the Chinese and local Centers Two variables, spatial distance and co-travel time on train, were
for Disease Control and Prevention in China. We included a selected as potential determinants of transmission risk. Spatial dis-
total of 2568 confirmed cases who reported having traveled be- tance between an index patient and each close contact was meas-
tween 19 December 2019 and 6 March 2020 by G train across ured as a row and column number–based difference from the index
mainland China within the preceding 14 days before or during patient’s seat. A seat is approximately 0.5 meter in width. The dis-
illness onset. Dates of symptom onset and diagnosis were avail- tance between adjacent rows is approximate 0.4 meter. The aisle
able for cases. A close contact was defined as a person who had between the seat C and the seat D was counted as a seat when we
co-traveled on a train within a 3-row seat distance of a con- calculated the column distance between seats. Co-travel time for
firmed case (index patient) within 14 days before symptom onset an index patient and each close contact was calculated based on
[25]. For this study, seat information (including seat number travel time between the shared departure and destination stations.
and names of departure and destination stations) of cases and Relative risk (RR) and χ2 test were used to compare the attack rate
close contacts were obtained from the China State Railway between different seats. The spatial statistical index Moran I was used
Group (www.china-railway.com.cn). Railway timetables were to measure the global spatial autocorrelation of the attack rates of
Figure 1. Distribution of second-class seats in a typical high-speed train coach.
2 • cid 2020:XX (XX XXXX) • Hu et al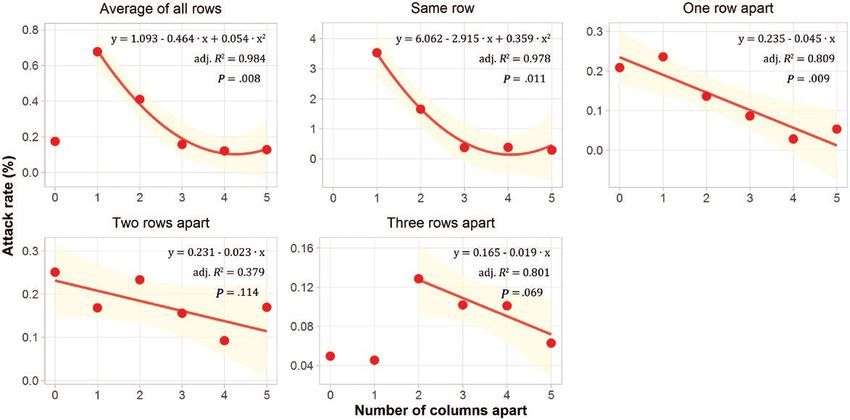
seats [26]. A Moran I value approximating 1.0 indicates spatial clus-                    (234/72 093; 95% CI, .29%–.37%). The average attack rates
tering, whereas a value approximating −1.0 indicates spatial disper-                     of passengers per seat from A to F in each row as presented
sion. The Wang q index was applied to compare the differences in                         in Figure 1 with co-travel time
an average attack rate of 1.5% (142/9299; 95% CI, 1.3%–1.8%),                                    quadratic fitted curve, the slope was larger when the co-travel
approximately 10 times higher than that of seats that were 1 and                                 time extended beyond 4 hours. However, the attack rate by
2 rows apart (Table 1; Supplementary Table S1). However, there                                   seat location had a different relationship with co-travel time.
was no significant difference (P = .36) in transmission risk be-                                 A linear relationship was found for both adjacent seats and seats
tween seats that were 1 and 2 rows apart. Although seats that                                    that were 3 rows apart, whereas a quadratic relationship was
were 3 rows apart were at risk of COVID-19 transmission, this                                    found for the other seats. For the adjacent seats, 1 additional
attack rate was approximately half of the risk of infection at                                   hour co-travel with the index patient resulted in up to 1.26%
seats that were 1 and 2 rows apart (Figure 3).                                                   (P = .008) increase in the attack rate, which was the highest
   Passengers on seats adjacent to an index patient had the                                      among all considered seats, followed by other seats in the same
highest attack rate at 3.5% (92/2605; 95% CI, 2.9%–4.3%), which                                  row, with a rate increase of 0.26% (P = .004), and then seats 1, 2,

                                                                                                                                                                                              Downloaded from https://academic.oup.com/cid/advance-article/doi/10.1093/cid/ciaa1057/5877944 by guest on 24 October 2020
was >2 times higher than that in the second most exposed seat                                    and 3 rows away with rate increase of 0.10% (P = .068), 0.09%
and >10 times higher than the minimum rate within the same                                       (P = .063), and 0.04% (P = .039), respectively.
row. Compared to other seats, the seat adjacent to the patient                                      The average attack rate for all considered seats in the first
was at high risk of infection (RR, 18.0 [95% CI, 13.9–23.4]).                                    group (194/21008; 0.92% [95% CI, .80%–.11%]) was signifi-
The average attack rate for all rows decreased rapidly with an                                   cantly higher (P < .01) than that in the second group (33/50816;
increase in the number of columns between them. For seats                                        0.06% [95% CI, .05%–.09%]) (Supplementary Figures S2 and
within the same row as the index patient, when the number of                                     S3). In the first group, the attack rate increased significantly
columns was
Downloaded from https://academic.oup.com/cid/advance-article/doi/10.1093/cid/ciaa1057/5877944 by guest on 24 October 2020
Figure 3. Relationships between coronavirus disease 2019 attack rate and rows apart from the index patients.
more close contact behavior that would facilitate the spread of are also more likely to spread at close range [29]. Third, the
virus between them. Second, passengers within the same row backrests that separate rows might be a good barrier to slow the
might be easily infected by each other because, during a long spread of virus-laden aerosols [30, 31].
journey, they tend to leave their seat for a drink, to go to the The difference of attack rates between the 2 groups might
washroom, or simply to move around and relax. When a pas- be because passengers from the first group had a higher con-
senger leaves a window or middle seat, the other passengers tact rate with nearby passengers/patients due to family mem-
in the row need to let them pass, potentially increasing close bers, friends, or even just strangers but shared same workplace/
face-to-face contact. Viruses attached on aerosols and droplets hometown anecdotes. In contrast, passengers from the second
Figure 4. Relationships between coronavirus disease 2019 attack rate and co-travel time with the index patient.
Risk of COVID-19 Transmission During Train Travel • cid 2020:XX (XX XXXX) • 5group might have a lower probability to communicate and In conclusion, using a large dataset of cases and contacts of
contact with each other, which might reduce the risk of trans- train passengers, the present epidemiological and modeling
mission. Additionally, restricting the interval of seat reuses, analysis has explicitly measured the spatial and temporal dis-
disinfecting the seat, and improving hand hygiene may help re- tribution of COVID-19 attack rate and relevant risk factors
duce the risk of transmission. for high-speed train passengers. Our findings can help inform
Therefore, social distancing is an important method of reducing policy on travel duration, seat allocation, and personal protec-
the risk of disease transmission on public transportation [32, 33]. tive behavior to reduce the spread risk of COVID-19 for coun-
The allocation of passenger seats on a train should be carefully con- tries with community transmission, and to prevent resurgence
sidered to reduce the risk of disease transmission. Given the attack for countries preparing to relax travel and social distancing
rates estimated for passengers on the seats within the same row as interventions and reopen their economies.
Downloaded from https://academic.oup.com/cid/advance-article/doi/10.1093/cid/ciaa1057/5877944 by guest on 24 October 2020
the index patient, it follows that within 1 hour spent together, the
safe social distance is >1 meter. After 2 hours of contact, a distance Supplementary Data
Supplementary materials are available at Clinical Infectious Diseases online.
of10. Eldin C, Lagier JC, Mailhe M, Gautret P. Probable aircraft transmission of Covid- 21. Phoenix New. China’s high-speed rail train fleet sends 9 billion passengers:
19 in-flight from the Central African Republic to France. Travel Med Infect Dis more than 60% in 2018 [in Chinese]. 2019. Available at: https://tech.ifeng.com/
2020; 35:101643. c/7j6hzuFRsF0. Accessed 14 March 2020.
11. Silverstein WK, Stroud L, Cleghorn GE, Leis JA. First imported case of 2019 novel 22. CAAC News. A total of 610 million passengers traveled on Chinese civil avi-
coronavirus in Canada, presenting as mild pneumonia. Lancet 2020; 395:734. ation flights in 2018 [in Chinese]. 2019. Available at: http://caacnews.com.
12. Bogoch II, Watts A, Thomas-Bachli A, Huber C, Kraemer MUG, Khan K. cn/1/1/201901/t20190107_1264347.html. Accessed 9 May 2020.
Pneumonia of unknown aetiology in Wuhan, China: potential for international 23. People’s Daily. Railway Spring Festival sends more than 100 million passengers [in
spread via commercial air travel. J Travel Med 2020; 27:taaa008. Chinese]. 2020. Available at: http://finance.people.com.cn/n1/2020/0120/c1004-
13. Zheng R, Xu Y, Wang W, Ning G, Bi Y. Spatial transmission of COVID-19 via public 31556468.html. Accessed 14 March 2020.
and private transportation in China. Travel Med Infect Dis 2020; 34:101626. 24. People’s Daily. Querying tool for same itinerary as the patient diagnosed with
14. Zhao S, Zhuang Z, Ran J, et al. The association between domestic train transpor- COVID-19 (v1.3) [in Chinese]. 2020. Available at: https://h5.peopleapp.com/
tation and novel coronavirus (2019-nCoV) outbreak in China from 2019 to 2020: txcx/index.html. Accessed 12 May 2020.
a data-driven correlational report. Travel Med Infect Dis 2020; 33:101568. 25. Li Q, Guan X, Wu P, et al. Early transmission dynamics in Wuhan, China, of novel
15. Devi S. Travel restrictions hampering COVID-19 response. Lancet 2020; 395:1331–2. coronavirus–infected pneumonia. N Engl J Med 2020; 382:1199–207.
16. Lai S, Ruktanonchai NW, Zhou L, et al. Effect of non-pharmaceutical interven- 26. Gaetan C, Guyon X. Spatial statistics and modeling. New York: Springer; 2010.
Downloaded from https://academic.oup.com/cid/advance-article/doi/10.1093/cid/ciaa1057/5877944 by guest on 24 October 2020
tions to contain COVID-19 in China [manuscript published online ahead of print 27. Wang J, Xu C. Geodetector: principle and prospective. Acta Geogr Sin 2017;
4 May 2020]. Nature 2020. doi:10.1038/s41586-020-2293-x. 72:116–34.
17. Wu Z, McGoogan JM. Characteristics of and important lessons from the corona- 28. Wang J-F, Zhang T-L, Fu B-J. A measure of spatial stratified heterogeneity. Ecol
virus disease 2019 (COVID-19) outbreak in China: summary of a report of 72 314 Indic 2016; 67:250–6.
cases from the Chinese Center for Disease Control and Prevention [manuscript 29. Morawska L, Milton DK. It is time to address airborne transmission of COVID-19
published online ahead of print 24 February 2020]. JAMA 2020. doi:10.1001/ [manuscript published online ahead of print 6 July 2020]. Clin Infect Dis 2020.
jama.2020.2648. doi:10.1093/cid/ciaa939.
18. Kucharski AJ, Russell TW, Diamond C, et al; Centre for Mathematical Modelling 30. China.org.cn. How to prevent aerosol transmission of COVID-19? 2020.
of Infectious Diseases COVID-19 Working Group. Early dynamics of transmis- Available at: http://www.china.org.cn/chinese/2020-03/02/content_75765535.
sion and control of COVID-19: a mathematical modelling study. Lancet Infect htm. Accessed 18 March 2020.
Dis 2020; 20:553–8. 31. Yu IT, Li Y, Wong TW, et al. Evidence of airborne transmission of the severe acute
19. Hellewell J, Abbott S, Gimma A, et al; Centre for the Mathematical Modelling respiratory syndrome virus. N Engl J Med 2004; 350:1731–9.
of Infectious Diseases COVID-19 Working Group. Feasibility of controlling 32. World Health Organization. Coronavirus disease (COVID-19) advice for the
COVID-19 outbreaks by isolation of cases and contacts. Lancet Glob Health public. 2020. Available at: https://www.who.int/emergencies/diseases/novel-
2020; 8:e488–96. coronavirus-2019/advice-for-public. Accessed 19 March 2020.
20. Bi Q, Wu Y, Mei S, et al. Epidemiology and transmission of COVID-19 in 391 33. Centers for Disease Control and Prevention. Protect yourself. 2020. Available at:
cases and 1286 of their close contacts in Shenzhen, China: a retrospective cohort https://www.cdc.gov/coronavirus/2019-ncov/about/prevention.html. Accessed
study. Lancet Infect Dis 2020; 27:911–9. 12 March 2020.
Risk of COVID-19 Transmission During Train Travel • cid 2020:XX (XX XXXX) • 7You can also read