Characterization and Identification of Variations in Types of Primary Care Visits Before and During the COVID-19 Pandemic in Catalonia: Big Data ...
←
→
Page content transcription
If your browser does not render page correctly, please read the page content below
JOURNAL OF MEDICAL INTERNET RESEARCH                                                                                                      Lopez Segui et al

     Original Paper

     Characterization and Identification of Variations in Types of
     Primary Care Visits Before and During the COVID-19 Pandemic
     in Catalonia: Big Data Analysis Study

     Francesc Lopez Segui1, PhD; Guillem Hernandez Guillamet1,2, MSc; Héctor Pifarré Arolas1, PhD; Francesc X
     Marin-Gomez3,4,5, MD, PhD; Anna Ruiz Comellas3,5,6, MD, PhD; Anna Maria Ramirez Morros2,4, RNU, MPH; Cristina
     Adroher Mas7, MSc; Josep Vidal-Alaball3,4,5, MD, PhD
     1
      Centre de Recerca en Economia i Salut, Pompeu Fabra University, Barcelona, Spain
     2
      Gerència Territorial de la Catalunya Central, Institut Català de la Salut, Sant Fruitós de Bages, Spain
     3
      Health Promotion in Rural Areas Research Group, Gerència Territorial de la Catalunya Central, Institut Català de la Salut, Sant Fruitós de Bages, Spain
     4
      Unitat de Suport a la Recerca de la Catalunya Central, Fundació Institut Universitari per a la recerca a l'Atenció Primària de Salut Jordi Gol i Gurina,
     Sant Fruitós de Bages, Spain
     5
      Faculty of Medicine, University of Vic, Central University of Catalonia, Vic, Spain
     6
      Centre d’Atenció Primària Sant Joan de Vilatorrada, Gerència Territorial de la Catalunya Central, Institut Català de la Salut, Sant Fruitós de Bages,
     Spain
     7
      Sant Joan de Déu Hospital, Barcelona, Spain

     Corresponding Author:
     Josep Vidal-Alaball, MD, PhD
     Health Promotion in Rural Areas Research Group
     Gerència Territorial de la Catalunya Central, Institut Català de la Salut
     Pica d'Estats 36
     Sant Fruitós de Bages
     Spain
     Phone: 34 93 693 0040
     Email: jvidal.cc.ics@gencat.cat

     Abstract
     Background: The COVID-19 pandemic has turned the care model of health systems around the world upside down, causing
     the abrupt cancellation of face-to-face visits and redirection of the model toward telemedicine. Digital transformation boosts
     information systems—the more robust they are, the easier it is to monitor the health care system in a highly complex state and
     allow for more agile and reliable analysis.
     Objective: The purpose of this study was to analyze diagnoses from primary care visits and distinguish between those that had
     higher and lower variations, relative to the 2019 and 2020 periods (roughly before and during COVID-19), to identify clinical
     profiles that may have been most impaired from the least-used diagnostic codes for visits during the pandemic.
     Methods: We used a database from the Primary Care Services Information Technologies Information System of Catalonia. We
     analyzed the register of visits (n=2,824,185) and their International Classification of Diseases (ICD-10) diagnostic codes
     (n=3,921,974; mean 1.38 per visit), as approximations of the reasons for consultations, at 3 different grouping levels. The data
     were represented by a term frequency matrix and analyzed recursively in different partitions aggregated according to date.
     Results: The increase in non–face-to-face visits (+267%) did not counterbalance the decrease in face-to-face visits (–47%),
     with an overall reduction in the total number of visits of 1.36%, despite the notable increase in nursing visits (10.54%). The largest
     increases in 2020 were visits with diagnoses related to COVID-19 (ICD-10 codes Z20-Z29: 2.540%), along with codes related
     to economic and housing problems (ICD-10 codes Z55-Z65: 44.40%). Visits with most of the other diagnostic codes decreased
     in 2020 relative to those in 2019. The largest reductions were chronic pathologies such as arterial hypertension (ICD-10 codes
     I10-I16: –32.73%) or diabetes (ICD-10 codes E08-E13: –21.13%), but also obesity (E65-E68: –48.58%) and bodily injuries
     (ICD-10 code T14: –33.70%). Visits with mental health–related diagnostic codes decreased, but the decrease was less than the
     average decrease. There was a decrease in consultations—for children, adolescents, and adults—for respiratory infections (ICD-10

     https://www.jmir.org/2021/9/e29622                                                                         J Med Internet Res 2021 | vol. 23 | iss. 9 | e29622 | p. 1
                                                                                                                              (page number not for citation purposes)
XSL• FO
RenderX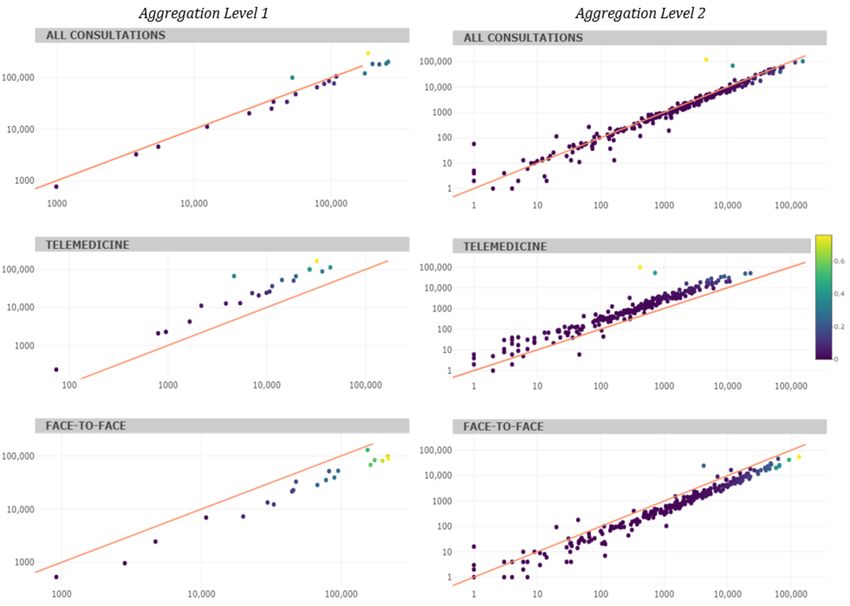
JOURNAL OF MEDICAL INTERNET RESEARCH Lopez Segui et al
codes J00-J06: –40.96%). The results show large year-on-year variations (in absolute terms, an average of 12%), which is
representative of the strong shock to the health system.
Conclusions: The disruption in the primary care model in Catalonia has led to an explosive increase in the number of
non–face-to-face visits. There has been a reduction in the number of visits for diagnoses related to chronic pathologies, respiratory
infections, obesity, and bodily injuries. Instead, visits for diagnoses related to socioeconomic and housing problems have increased,
which emphasizes the importance of social determinants of health in the context of this pandemic. Big data analytics with routine
care data yield findings that are consistent with those derived from intuition in everyday clinical practice and can help inform
decision making by health planners in order to use the next few years to focus on the least-treated diseases during the COVID-19
pandemic.
(J Med Internet Res 2021;23(9):e29622) doi: 10.2196/29622
KEYWORDS
COVID-19; primary care; diagnose variations; big data; ICD10; health system; big data; primary care; healthcare system
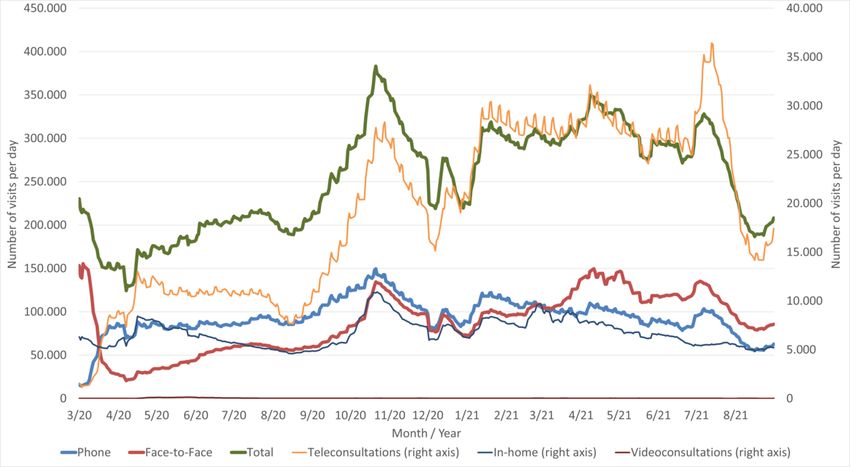
Catalonia includes provider–patient or provider–provider
Introduction communications and can take place synchronously (telephone
The COVID-19 pandemic has turned the care model of health or video calls) or asynchronously (teleconsultations). By the
systems around the world upside down, with the abrupt end of February 2021, all face-to-face activity had not yet
cancellation of face-to-face visits, redirection of the model recovered, although the total number of visits was approximately
toward non–face-to-face care, and then the gradual recovery of 15% higher than that at the start of the pandemic (Figure 1), in
services, first for priority population sectors and later for the part because of the increasing use of telemedicine (mostly in
general population [1-4]. Telemedicine in primary care in the form of telephone consultations).
Figure 1. A 7-day rolling average (with weekends and holidays not included) of primary care daily visits in Catalonia, by type, from March 2020 to
August 2021 (unpublished data, Catalan Ministry of Health).
Because of the disruptions, health systems have begun to to telemedicine visits has not been the same for the whole
identify population profiles that may be most adversely affected population and that, when this type of care becomes
by changes and underdiagnosed diseases during the pandemic predominant, inequalities in access to care may arise [11,12].
[5-8]. Some patients have had to wait longer than before to
According to a recent study [13], COVID-19 has resulted in
receive health care. It has been observed, for example, that
loss of years of life over 7 times greater than that in a typical
cardiac arrests outside hospital have increased, with patients
influenza season in Spain. The health emergency has precipitated
having worse prognoses [9], or that patients with heart failure
policy maker decision-making that has often been without any
have had fewer admissions, but when admitted, heart failure
existing evidence and with long delays [14], but it has also
has been more severe and admission to the intensive care unit
highlighted the value of information systems and, more
is required more often [10]. It has also been noted that access
generally, the role of health policy evaluation agencies [15].
https://www.jmir.org/2021/9/e29622 J Med Internet Res 2021 | vol. 23 | iss. 9 | e29622 | p. 2
(page number not for citation purposes)
XSL• FO
RenderXJOURNAL OF MEDICAL INTERNET RESEARCH Lopez Segui et al
Robust information systems make it easier to assess and monitor the data set was reduced to visits in which at least one diagnosis
the health system in a highly complex state and allow for agile had been identified.
and reliable analysis. In this context, we explored the potential
for the use of a massive amount of primary care data from the
Statistical Analysis
Catalan public health system to inform quick, granular decision Diagnostic codes attributed to visits were analyzed at 3 levels
making regarding which areas have been most neglected as a of aggregation: aggregation level 1 (21 codes, with format
result of the change in the care model. Specifically, we aimed “Neoplasms, C00-D49”), which corresponds to the concept of
to identify which diagnoses in primary care have increased and chapters according to the reference ICD-10 dictionary [16];
decreased from 2019 to 2020 (approximately before and during aggregation level 2, which was a second, more specific grouping
the COVID-19 pandemic), in order to determine which areas (284 different codes, formatted “Malignant neoplasms of
need to be strengthened in view of the gradual recovery of health digestive organs, C15-C26”), which corresponded to the concept
system activity. of blocks in the above-mentioned dictionary; and aggregation
level 3, which was a third grouping with even more specificity
Methods (1532 different codes, with the format “Malignant neoplasm of
anus and anal canal, C21”).
Ethics
The variety of diagnostic codes used in clinical practice
The study was conducted according to the guidelines of the suggested that there would be a need for the use of big data
Declaration of Helsinki and in accordance with European analysis techniques. Visit data were recursively analyzed in 4
General Data Protection Regulations and the Spanish Organic different partitions, and the diagnoses were aggregated according
Law on Data Protection and Guarantee of Digital Rights. No to date. ICD-10 groupings were represented with a term
ethical approval was required; analyses were conducted only frequency matrix [17,18], where matrix columns indicated the
on aggregated data. absolute number of each diagnostic code.
Data The variation index was used to represent the relative weight
The Catalan health system provides universal coverage to 7.6 of the variation of a diagnostic code over the absolute total
million inhabitants. Administratively, it is composed of a single interannual variation of all codes. Thus, in addition to the
public payer and several publicly or privately owned service frequency of use of each diagnostic code, this index takes into
providers, in an integrated system and with an important role account the importance of each on a linear scale to allow
of community and primary health care and the use of visualization of the diagnoses on 2 scales (code frequency and
information technology. We used a database from the Primary variation index). Data were analyzed using R (version 3.4.3; R
Care Services Information Technologies System of the Health Foundation for Statistical Computing).
Region of Central Catalonia (Catalonia, Spain) belonging to
the Catalan Institute of Health. In this region, the Health Results
Information System is used by the majority (32/37, 86.48%) of
Primary Care centers, which facilitated analysis. The variable There were 3,555,799 primary care visits for 376,486 citizens
of interest was primary care visits according to the International (a total of 404,245 citizens are in the reference population of
Statistical Classification of Diseases tenth revision (ICD-10) this health region) in 2019 and 2020, and at least one diagnosis
[16] diagnostic codes. These codes were used as a proxy for the was identified in 79.43% of visits (2824371/3,555,799). The
reason for the visit. degree of coding is slightly higher in the face-to-face visits
compared to the non-face-to-face visits Regarding the effects
Data from primary care visits in 2020 (the period covering most of the pandemic on missing data, during 2019, 18.46%
of the COVID-19 pandemic) and 2019 (the period used as a (262,460/1,421,779) of visits had no associated diagnoses, while
comparator)—both face-to-face (at the primary care center or in 2020, missing instances reached 22.50% (315,541/1,402,406),
at home) and non–face-to-face (telemedicine tools including representing a limited impact on reported outcomes. The final
telephone and teleconsultations)—were analyzed. One visit database was composed of 2,824,185 visits for 358,419 different
could result in several diagnostic codes and not all visits were citizens, with 3,921,974 diagnostic visit codes (1.38 codes per
associated with at least one, as doing so is not mandatory in the visit on average; 3.5% of visits had more than 3 associated
Catalan primary care electronic health record. Consequently, codes; Figure 2 and Figure 3).
https://www.jmir.org/2021/9/e29622 J Med Internet Res 2021 | vol. 23 | iss. 9 | e29622 | p. 3
(page number not for citation purposes)
XSL• FO
RenderXJOURNAL OF MEDICAL INTERNET RESEARCH Lopez Segui et al
Figure 2. Aggregation level 1 cumulative frequency of the 21 most used International Statistical Classification of Diseases, tenth revision, diagnostic
codes (2019 and 2020). behav: behavioral, endoc: endocrine, malf: malformation, metabol: metabolic, nutrit: nutritional.
Figure 3. Aggregation level 2 cumulative frequency of the 21 most used International Statistical Classification of Diseases, tenth revision, diagnostic
codes (2019 and 2020). dis: disease, resp/respirat: respiratory.
The total number of visits in 2020 decreased slightly (–1.36%) more than half of visits (768,548/1,402,406, 54.80%) were
compared to those in 2019; if COVID-19–related visits are telemedicine. The increase in this type of visit, therefore, has
excluded, this figure is even lower (–7.56%). The type of visit not been able to compensate for the decrease in face-to-face
changed markedly (Table 1). In 2019, most visits visits.
(1,212,800/1,421,779, 85.30%) were face-to-face, while in 2020
https://www.jmir.org/2021/9/e29622 J Med Internet Res 2021 | vol. 23 | iss. 9 | e29622 | p. 4
(page number not for citation purposes)
XSL• FO
RenderXJOURNAL OF MEDICAL INTERNET RESEARCH Lopez Segui et al
Table 1. Evolution of visits.
Characteristic 2019 2020 Difference, %
Total patients attended 287,936 287,965 0.01
Total visits, n 1,421,779 1,402,406 –1.36
Face-to-face, n (%) 1,212,800 (85.30) 633,858 (45.20) –47.74
Telemedicine, n (%) 208,979 (14.70) 768,548 (54.80) 267.76
General medicine, n (%) 859,153 (60.43) 822,433 (58.64) –4.27
Nursing, n (%) 427,959 (30.10) 473,051 (33.73) 10.54
Pediatrics, n (%) 134,667 (9.47) 106,922 (7.62) –20.60
a 95,098 (6.69) 76,460 (5.45) –24.38
Early childhood , n (%)
Childhoodb, n (%) 57,436 (4.04) 52,101 (3.72) –10.24
Adolescencec, n (%) 55,768 (3.92) 61,693 (4.40) 9.60
Youthd, n (%) 55,943 (3.93) 69,287 (4.94) 19.26
Adulthoode, n (%) 475,366 (33.43) 514,327 (36.67) 7.58
Older adultf, n (%) 682,168 (47.98) 628,538 (44.82) –8.53
Total diagnostic codes, n 2,079,680 1,912,342 –10.57
Diagnostic codes per visit, mean (SD) 1.46 (1.00) 1.36 (0.89) –6.84
Sex, n (%)
Male 641,602 (45.13) 627,806( 44.77) –2.15
Female 780,074 (54.87) 774,486 (55.23) –0.72
Age of visits, mean (SD) 53.54 (26.25) 52.89 (25.72) –1.21
a
Early childhood: 0 to 5 years old.
b
Childhood: infancy to 11 years old.
c
Adolescence: 12 to 18 years old.
d
Youth: 14-26 years old.
e
Adulthood: 27 to 59 years old.
f
Older adult: over 60 years old.
In relation to the specialty, the number of visits with doctors elsewhere). For aggregation level 2, the 5 most-used codes
decreased slightly (–4.27%), the number of visits with nurses comprised approximately one-quarter of the total (Hypertensive
increased (10.54%), and the number of pediatric visits decreased diseases; Diabetes mellitus; Other back disorders; Persons with
(–20.60%). Despite this decrease, the mean age of patients potential health risks related to personal and family history and
decreased by approximately 1 year (from 53.54 in 2019 to 52.89 certain conditions influencing health status; Persons with
years in 2020). There was a variation in visits according to age potential health risks related to communicable diseases).
groups: there was a decrease in visits for patients in early
For aggregation level 1, large interannual variations were
childhood and infancy (from 0 to 5 years old), an increase in
observed (Table 2), especially for diagnostic codes related to
patients in adolescence (12 to 18 years old) to adulthood (27 to
factors influencing health status and contact with health services
59 years old), and a decrease in older adult patients. The
(ICD-10 codes Z00-Z99), codes that were initially used for
proportion of visits made by women was 55.04%
diagnoses related to COVID-19, and the diagnosis of certain
(1,554,560/2,824,185); the magnitude remained fairly unchanged
infectious and parasitic diseases, which nearly doubled in 2020.
between 2019 and 2020.
The rest of the codes decreased in 2020 compared to 2019;
The cumulative frequency of the 21 most used diagnostic codes however, those related to mental health decreased less than the
for the 2 first levels of grouping were analyzed (Figure 3). In rest (ICD-10 codes F01-F99: –3.39%). Diagnostic codes related
the case of aggregation level 1, the 5 code groupings comprised to injuries were reduced by almost one-quarter (ICD-10 codes
more than half of the total number of codes (Factors influencing S00-T88: –26.85%), possibly due to a drastic reduction in
health status and contact with health services; Endocrine, accidents resulting from people engaging in less activity during
nutritional, and metabolic diseases; Diseases of the circulatory confinement. The variation index shows the weight of each of
system; Diseases of the musculoskeletal system and connective these variations on overall disruption (Table 3).
tissue; Signs, symptoms, and abnormal test results not classified
https://www.jmir.org/2021/9/e29622 J Med Internet Res 2021 | vol. 23 | iss. 9 | e29622 | p. 5
(page number not for citation purposes)
XSL• FO
RenderXJOURNAL OF MEDICAL INTERNET RESEARCH Lopez Segui et al
Table 2. Use of International Statistical Classification of Diseases, tenth revision, diagnostic codes (aggregation level 1).
Diagnostic code Total, n (%) 2019, n (%) 2020, n (%) Interannual Variation
variation, % index
Factors influencing health status and contact with health services 483,368 (12.32) 186,604 (9.06) 296,764 (15.93) 59.03 0.22
(Z00-Z99)
Endocrine, nutritional, and metabolic diseases (E00-E89) 464,009 (11.83) 261,076 (12.68) 202,933 (10.90) –22.27 0.11
Diseases of the circulatory system (I00-I99) 440,256 (11.23) 252,555 (12.26) 187,701 (10.08) –25.68 0.13
Diseases of the musculoskeletal system and connective tissue 405,813 (10.35) 224,901 (10.92) 180,912 (9.71) –19.56 0.09
(M00-M99)
Signs, symptoms, and abnormal test results not elsewhere classi- 385,121 (9.82) 200,711 (9.75) 184,410 (9.90) –8.12 0.03
fied (R00-R99)
Diseases of the respiratory system (J00-J99) 297,074 (7.57) 176,405 (8.57) 120,669 (6.48) –31.60 0.11
Mental, behavioral, and neurodevelopmental disorders (F01-F99) 214,709 (5.47) 109,203 (5.30) 105,506 (5.66) –3.39 0.01
Diseases of the genitourinary system (N00-N99) 182,642 (4.66) 96,692 (4.70) 85,950 (4.61) –11.11 0.02
Injuries, poisonings, and other consequences of external causes 182,045 (4.64) 105,135 (5.11) 76,910 (4.13) –26.85 0.06
(S00-T88)
Diseases of the skin and subcutaneous tissue (L00-L99) 164,759 (4.20) 89,119 (4.33) 75,640 (4.06) –15.12 0.03
Certain infectious and parasitic diseases (A00-B99) 151,999 (3.88) 52,220 (2.54) 99,779 (5.36) 91.07 0.09
Diseases of the digestive system (K00-K95) 143,793 (3.67) 78,968 (3.83) 64,825 (3.48) –17.91 0.03
Neoplasms (C00-D49) 102,910 (2.62) 55,201 (2.68) 47,709 (2.56) –13.57 0.01
Diseases of the ear and mastoid process (H60-H95) 81,495 (2.08) 47,699 (2.32) 33,796 (1.81) –29.15 0.03
Diseases of the nervous system (G00-G99) 72,150 (1.84) 38,057 (1.85) 34,093 (1.83) –10.42 0.01
Diseases of the eye and adnexa (H00-H59) 61,810 (1.58) 36,837 (1.79) 24,973 (1.34) –32.21 0.02
Diseases of the blood and blood-forming organs and disorders 45,551 (1.16) 25,305 (1.23) 20,246 (1.09) –19.99 0.01
affecting the immune mechanism (D50-D89)
External causes of morbidity (V00-Y99) 23,659 (0.60) 12,481 (0.61) 11,178 (0.60) –10.44 0.00
Congenital malformations. congenital deformities, and congenital 10,034 (0.26) 5493 (0.27) 4541 (0.24) –17.33 0.00
chromosomal anomalies (Q00-Q99)
Pregnancy. childbirth, and puerperium (O00-O9A) 7023 (0.18) 3788 (0.18) 3235 (0.17) –14.60 0.00
Certain conditions originating in the perinatal period (P00-P96) 1754 (0.04) 991 (0.05) 763 (0.04) –23.01 0.00
https://www.jmir.org/2021/9/e29622 J Med Internet Res 2021 | vol. 23 | iss. 9 | e29622 | p. 6
(page number not for citation purposes)
XSL• FO
RenderXJOURNAL OF MEDICAL INTERNET RESEARCH Lopez Segui et al
Table 3. Top 10 International Statistical Classification of Diseases, tenth revision, diagnostic codes according to the variation index.
Diagnostic code Variation index
Aggregation level 2
Persons with potential health risks related to communicable diseases (Z20-Z29) 0.20
Other viral diseases (B25-B34) 0.10
Hypertensive diseases (I10-I16) 0.09
Acute upper respiratory infections (J00-J06) 0.05
Diabetes mellitus (E08-E13) 0.04
Metabolic disorders (E70-E88) 0.03
Injury to unspecified body region (T14) 0.03
Other acute lower respiratory tract infections (J20-J22) 0.03
Other soft tissue disorders (M70-M79) 0.03
Other back disorders (M50-M54) 0.02
Aggregation level 3
Contact and exposure (suspected): communicable diseases (Z20) 0.17
Viral infection of unspecified location (B34) 0.08
Essential (primary) hypertension (I10) 0.07
COVID (U07) 0.05
Diabetes mellitus type 2 (E11) 0.03
Injury to unspecified body region (T14) 0.03
Disorders of lipoprotein metabolism and other hyperlipidemias (E78) 0.02
Acute rhinopharyngitis (J00) 0.02
Dorsalgia (M54) 0.02
Overweight and obesity (E66) 0.02
The number of diagnostic codes decreased slightly (Figure 4), E65-E68: –48.58%) and bodily injuries (T14: –33.70%) were
and those for telemedicine and face-to-face visits increased and reduced. The results show year-on-year variations (in absolute
decreased, respectively. Aggregation level 2 analysis shows terms, an average of 12%).
that the diagnostic codes with the largest increase in 2020 were
The frequencies of diagnoses (listed according to the highest
those related to COVID-19 (ICD-10 codes Z20-Z29: 2.540%),
variation index) in face-to-face and non–face-to-face visits were
along with codes related to economic and housing problems
systematically negative (Table 4) and positive (Table 5),
(ICD-10 codes Z55-Z65: 44.40%). Visits with most of the other
respectively. It should also be noted that none of the face-to-face
diagnostic codes decreased in 2020 relative to those in 2019.
visit code groups were offset by those of the non–face-to-face
Visits for chronic pathologies such as arterial hypertension
group (ie, the largest reductions in the former were not offset
(ICD-10 codes I10-I16: –32.73%) or diabetes ( ICD-10 codes
by the largest increases in the latter).
E08-E13: –21.13%), but also those for obesity (ICD-10 codes
https://www.jmir.org/2021/9/e29622 J Med Internet Res 2021 | vol. 23 | iss. 9 | e29622 | p. 7
(page number not for citation purposes)
XSL• FO
RenderXJOURNAL OF MEDICAL INTERNET RESEARCH Lopez Segui et al
Figure 4. Primary care consultations before (in 2019) vs during (in 2020) COVID-19 (absolute frequency, log scale) according to International Statistical
Classification of Diseases, tenth revision, codes. Each point corresponds to an International Statistical Classification of Diseases, tenth revision,
diagnostic code. The 45° line indicates the identical frequency of diagnostic code use between periods; points above indicate the set of diagnostic codes
that have been visited relatively more in 2020 and vice versa. The color of the dot indicates the value of the variation index (the higher, the more
important the year-on-year variation).
Table 4. Top 5 in variation index of diagnostic use in face-to-face visits (aggregation level 2).
ICD-10a diagnostic code Total, n (%) 2019, n (%) 2020, n (%) Interannual Variation
variation, % index
Diseases of the blood and blood-forming organs and disorders 27,197 (1.03) 19,912 (1.12) 7285 (0.83) –63.41 0.14
of the immune mechanism (D50-D89)
Mental, behavioral, and neurodevelopmental disorders (F01-F99) 128,611 (4.85) 89,415 (5.05) 39,196 (4.47) –56.16 0.13
Diseases of the ear and mastoid process (H60-H95) 68,215 (2.57) 45,515 (2.57) 22,700 (2.59) –50.13 0.13
Diseases of the digestive system (K00-K95) 96,028 (3.62) 67,589 (3.81) 28,439 (3.24) –57.92 0.11
Congenital malformations, congenital deformities, and congenital 7107 (0.27) 4668 (0.26) 2439 (0.28) –47.75 0.10
chromosomal anomalies (Q00-Q99)
a
ICD-10: International Statistical Classification of Diseases, tenth revision
https://www.jmir.org/2021/9/e29622 J Med Internet Res 2021 | vol. 23 | iss. 9 | e29622 | p. 8
(page number not for citation purposes)
XSL• FO
RenderXJOURNAL OF MEDICAL INTERNET RESEARCH Lopez Segui et al
Table 5. Top 5 in variation index of diagnostic use in non–face-to-face visits (aggregation level 1).
ICD-10a diagnostic code Total, n (%) 2019, n (%) 2020, n (%) Interannual Variation
variation, % index
Factors influencing health status and contact with health services 199,464 (15.68) 32,146 (11.20) 167,318 (16.99) 420.49 0.19
(Z00-Z99)
Signs, symptoms, and abnormal test results not elsewhere classi- 128,214 (10.08) 27,092 (9.44) 101,122 (10.27) 273.25 0.11
fied (R00-R99)
Diseases of the musculoskeletal system and connective tissue 127,293 (10.01) 27,328 (9.52) 99,965 (10.15) 265.80 0.10
(M00-M99)
Endocrine, nutritional, and metabolic diseases (E00-E89) 157,663 (12.40) 44,155 (15.38) 113,508 (11.53) 157.07 0.10
Certain infectious and parasitic diseases (A00-B99) 71,620 (5.63) 4670 (1.63) 167,318 (16.99) 1333.62 0.09
a
ICD-10: International Statistical Classification of Diseases, tenth revision
Finally, for children, adolescents, and adults, there were frequency that has not been counterbalanced by the increase in
decreases in consultations for respiratory infections; ear, nose telemedicine.
and throat pathologies; and skin problems. In adults and older
Opportunities abound for quantifying the impact of the
adults, there were overall decreases in visits for chronic
pandemic, in addition to analyses presented herein, on service
pathologies, especially those for arterial hypertension and
delivery and citizens’ health in order to anticipate and plan for
diabetes. Decreases in visits for some pathologies were
changes in demand for health services in the coming months or
counterbalanced by an increase in telemedicine visits—among
years. It would be necessary to study whether, due to the lack
adults, for back disorders, soft tissue disorders, upper respiratory
of testing (eg, routine analysis), prescriptions performed by
tract infections, and anxiety, and among older adults, different
clinicians have been more pharmacological; which visits that
types of neoplasms. By sex, no differences were observed in
were previously made in person are now conducted using
the frequency of diagnoses (Multimedia Appendices 1-3).
telemedicine; to what extent the reduced intensity of care for
chronic disease management has affected the health of citizens
Discussion [6]; and whether mental health (note that the amount of this
Principal Findings type of visit have been reduced less than the rest) will be the
next pandemic [20] in order to reprioritize a care model in
We analyzed the differences in distinctive characteristics of Catalonia which, in the opinion of the authors, was already
care before and after the outbreak of the COVID-19 pandemic suffering a lot of health care pressure before COVID-19.
in the context of primary care in Catalonia. As expected, the
increase in the frequency of visits with diagnostic codes related Despite the crisis caused by the pandemic, the changes that have
to contact with or suspected exposure to SARS-CoV-2 stands been made to address the crisis may improve future health
out, but those related to housing, employment and psychosocial systems. Big data analysis tools allow exhaustive, systematic,
factors (ICD-10 codes Z55-Z65) are also noteworthy. On the agile evaluation. Given the preeminence and role of primary
eve of a foreseeable economic crisis, this fact underlines the care as the gateway to the public health system in Catalonia,
importance of social determinants of health and population the information derived from primary care information registers
health management when planning reconstruction policy for is very appropriate for monitoring variations in the provision
the period after the pandemic, as it is well known that vulnerable of health services. This is demonstrated by the fact that the
population groups were the worst affected by the economic results of this study quantify reductions in the intensity of some
crisis [19]. The change in the pattern of visits is also visible in types of visits that are consistent with our expectations. Future
2 other aspects. First, the number of visits in the nursing service avenues of research are the sensitivity of information system
increased (10.54%), while those in general medicine visits records in predicting the severity of the situation.
decreased (–4.27%). Second, the increasing use of Limitations
non–face-to-face care tools since the start of the pandemic has
served a wider and more representative cross-section of the It is worth mentioning that the 2 samples that were compared
population (traditionally underrepresented groups, including were not perfectly symmetric, insofar as the start of the
low-income individuals and patients residing in the poorest COVID-19 outbreak did not coincide exactly with end and
areas of the country, ie, rural areas) [12]. For this reason, since beginning of calendar years. Thus, 2020 data reflect, in part,
the outbreak of COVID-19, and due to the role of primary care some weeks or months of normal health care, showing some
in the management of sick leave, there seems to have been a bias in favor of non–COVID-19 visits. In addition, we used
reduction in the clinical complexity of patients seen, while ICD-10 diagnostic codes as a proxy for the reason for visits;
patients with socioeconomic problems (eg, unemployment) though it is a useful variable due to its systematic collection, it
have increased. Visits associated with diagnostic codes for is not perfect. Moreover, while it is true that in hospitals there
chronic pathologies (mainly endocrine and cardiovascular is a fairly exhaustive control in the coding of these variables
diseases) have been the most affected, with a decrease in due to the implications for billing, this is not the case in primary
care, so these data may be less well coded. The circumstances
https://www.jmir.org/2021/9/e29622 J Med Internet Res 2021 | vol. 23 | iss. 9 | e29622 | p. 9
(page number not for citation purposes)
XSL• FO
RenderXJOURNAL OF MEDICAL INTERNET RESEARCH Lopez Segui et al
caused by the pandemic may also have affected the overall emphasizes the importance of social determinants of health in
quality of the data (eg, due to newly established teleworking a pandemic context.
tools among health professionals).
Big data analysis can help to inform health planners in their
Conclusions decision making to focus on the least treated diseases during
The disruption in the primary care model in Catalonia has led the pandemic. The availability of information enables
to an explosive increase in the number of non–face-to-face comprehensive and reliable monitoring of the health system to
visits. There has been a reduction in the number of visits for be undertaken. In extraordinary situations, such as those created
diagnoses related to chronic pathologies, obesity, bodily injuries, by the COVID-19 pandemic, and in view of the necessary
and respiratory infections, possibly as an indirect effect of emergency plan that will have to be carried out to compensate
COVID-19 prevention measures. Instead, diagnostic visits for for the onslaught of clinical activity caused by COVID-19, big
socioeconomic and housing problems have increased, which data analysis is even more relevant.
Conflicts of Interest
None declared.
Multimedia Appendix 1
HTML (graphs).
[TXT File , 0 KB-Multimedia Appendix 1]
Multimedia Appendix 2
EXE file with interactive plots.
[TXT File , 0 KB-Multimedia Appendix 2]
Multimedia Appendix 3
Variation Index formula.
[PNG File , 90 KB-Multimedia Appendix 3]
References
1. Wosik J, Fudim M, Cameron B, Gellad ZF, Cho A, Phinney D, et al. Telehealth transformation: COVID-19 and the rise
of virtual care. J Am Med Inform Assoc 2020 Apr 20:1 [FREE Full text] [doi: 10.1093/jamia/ocaa067] [Medline: 32311034]
2. Clarke G, Pariza P, Wolters A. How has COVID-19 affected service delivery in GP practices that offered remote consultations
before the pandemic? The Health Foundation. 2020. URL: https://www.health.org.uk/news-and-comment/
charts-and-infographics/how-has-covid-19-affected-service-delivery-in-gp-practices [accessed 2021-08-23]
3. Pérez Sust P, Solans O, Fajardo JC, Medina Peralta M, Rodenas P, Gabaldà J, et al. Turning the crisis into an opportunity:
digital health strategies deployed during the COVID-19 outbreak. JMIR Public Health Surveill 2020 May 4;6(2):e19106.
[doi: 10.2196/19106] [Medline: 32339998]
4. López Seguí F, Walsh S, Solans O, Adroher Mas C, Ferraro G, García-Altés A, et al. Teleconsultation between patients
and health care professionals in the Catalan primary care service: message annotation analysis in a retrospective cross-sectional
study. J Med Internet Res 2020 Sep 17;22(9):e19149 [FREE Full text] [doi: 10.2196/19149] [Medline: 32687477]
5. Pifarré i Arolas H, Vidal-Alaball J, Gil J, López F, Nicodemo C, Saez M. Missing Diagnoses during the COVID-19
Pandemic: A Year in Review. Int J Environ Res Public Health 2021 May 17;18(10):5335. [doi: 10.3390/ijerph18105335]
6. Coma E, Guiriguet C, Mora N, Marzo-Castillejo M, Benítez M, Méndez-Boo L, et al. Impact of the COVID-19 pandemic
and related control measures on cancer diagnosis in Catalonia: a time-series analysis of primary care electronic health
records covering about five million people. BMJ Open 2021 May 18;11(5):e047567 [FREE Full text] [doi:
10.1136/bmjopen-2020-047567] [Medline: 34006554]
7. Maringe C, Spicer J, Morris M, Purushotham A, Nolte E, Sullivan R, et al. The impact of the COVID-19 pandemic on
cancer deaths due to delays in diagnosis in England, UK: a national, population-based, modelling study. The Lancet Oncology
2020 Aug;21(8):1023-1034. [doi: 10.1016/s1470-2045(20)30388-0] [Medline: 32702310]
8. Dinmohamed AG, Cellamare M, Visser O, de Munck L, Elferink MAG, Westenend PJ, et al. The impact of the temporary
suspension of national cancer screening programmes due to the COVID-19 epidemic on the diagnosis of breast and colorectal
cancer in the Netherlands. J Hematol Oncol 2020 Nov 04;13(1):147 [FREE Full text] [doi: 10.1186/s13045-020-00984-1]
[Medline: 33148289]
9. Marijon E, Karam N, Jost D, Perrot D, Frattini B, Derkenne C, et al. Out-of-hospital cardiac arrest during the COVID-19
pandemic in Paris, France: a population-based, observational study. The Lancet Public Health 2020 Aug;5(8):e437-e443.
[doi: 10.1016/s2468-2667(20)30117-1]
https://www.jmir.org/2021/9/e29622 J Med Internet Res 2021 | vol. 23 | iss. 9 | e29622 | p. 10
(page number not for citation purposes)
XSL• FO
RenderXJOURNAL OF MEDICAL INTERNET RESEARCH Lopez Segui et al
10. Colivicchi F, Di Fusco SA, Magnanti M, Cipriani M, Imperoli G. The impact of the coronavirus disease-2019 pandemic
and Italian lockdown measures on clinical presentation and management of acute heart failure. J Card Fail 2020
Jun;26(6):464-465 [FREE Full text] [doi: 10.1016/j.cardfail.2020.05.007] [Medline: 32417376]
11. Eberly LA, Kallan MJ, Julien HM, Haynes N, Khatana SAM, Nathan AS, et al. Patient characteristics associated with
telemedicine access for primary and specialty ambulatory care during the COVID-19 pandemic. JAMA Netw Open 2020
Dec 01;3(12):e2031640 [FREE Full text] [doi: 10.1001/jamanetworkopen.2020.31640] [Medline: 33372974]
12. Solans O, Vidal-Alaball J, Roig Cabo P, Mora N, Coma E, Bonet Simó JM, et al. Characteristics of citizens and their use
of teleconsultations in primary care in the Catalan Public Health System before and during the COVID-19 pandemic:
retrospective descriptive cross-sectional study. J Med Internet Res 2021 May 27;23(5):e28629 [FREE Full text] [doi:
10.2196/28629] [Medline: 33970867]
13. Pifarré I Arolas H, Acosta E, López-Casasnovas G, Lo A, Nicodemo C, Riffe T, et al. Years of life lost to COVID-19 in
81 countries. Sci Rep 2021 Feb 18;11(1):3504 [FREE Full text] [doi: 10.1038/s41598-021-83040-3] [Medline: 33603008]
14. García-Basteiro A, Alvarez-Dardet C, Arenas A, Bengoa R, Borrell C, Del Val M, et al. The need for an independent
evaluation of the COVID-19 response in Spain. Lancet 2020 Aug 22;396(10250):529-530 [FREE Full text] [doi:
10.1016/S0140-6736(20)31713-X] [Medline: 32771082]
15. CRES-UPF. Por un Hispa-NICE: Ahora o Nunca (Manifesto). Universitat Pompeu Fabra Barcelona. URL: https://www.
upf.edu/es/web/cres/noticies/-/asset_publisher/R0ylBfnCHIIE/content/id/240892331/maximized#.YHaTzugzZPY [accessed
2021-04-14]
16. International classification of diseases, tenth revision, clinical modification (ICD-10-CM). Centers for Disease Control and
Prevention. 2019. URL: http://www.cdc.gov/nchs/icd/icd10cm.htm [accessed 2021-08-23]
17. Rajaraman A, Ullman JD. Data mining. In: Mining of Massive Datasets. Cambridge: Cambridge University Press; 2011:1-17.
18. Manning C. Scoring, term weighting, and the vector space model. In: Introduction to Information Retrieval. Cambridge:
Cambridge University Press; 2008.
19. Lopez-Valcarcel BG, Barber P. Economic crisis, austerity policies, health and fairness: lessons learned in Spain. Appl
Health Econ Health Policy 2017 Feb;15(1):13-21. [doi: 10.1007/s40258-016-0263-0] [Medline: 27461007]
20. Xiong J, Lipsitz O, Nasri F, Lui LM, Gill H, Phan L, et al. Impact of COVID-19 pandemic on mental health in the general
population: a systematic review. J Affect Disord 2020 Dec 01;277:55-64 [FREE Full text] [doi: 10.1016/j.jad.2020.08.001]
[Medline: 32799105]
Abbreviations
ICD-10: International Statistical Classification of Diseases, tenth revision
Edited by C Basch; submitted 14.04.21; peer-reviewed by A Roghani, W Kraaij, X Cheng, Z Reis; comments to author 11.05.21;
revised version received 18.05.21; accepted 12.06.21; published 14.09.21
Please cite as:
Lopez Segui F, Hernandez Guillamet G, Pifarré Arolas H, Marin-Gomez FX, Ruiz Comellas A, Ramirez Morros AM, Adroher Mas
C, Vidal-Alaball J
Characterization and Identification of Variations in Types of Primary Care Visits Before and During the COVID-19 Pandemic in
Catalonia: Big Data Analysis Study
J Med Internet Res 2021;23(9):e29622
URL: https://www.jmir.org/2021/9/e29622
doi: 10.2196/29622
PMID: 34313600
©Francesc Lopez Segui, Guillem Hernandez Guillamet, Héctor Pifarré Arolas, Francesc X Marin-Gomez, Anna Ruiz Comellas,
Anna Maria Ramirez Morros, Cristina Adroher Mas, Josep Vidal-Alaball. Originally published in the Journal of Medical Internet
Research (https://www.jmir.org), 14.09.2021. This is an open-access article distributed under the terms of the Creative Commons
Attribution License (https://creativecommons.org/licenses/by/4.0/), which permits unrestricted use, distribution, and reproduction
in any medium, provided the original work, first published in the Journal of Medical Internet Research, is properly cited. The
complete bibliographic information, a link to the original publication on https://www.jmir.org/, as well as this copyright and
license information must be included.
https://www.jmir.org/2021/9/e29622 J Med Internet Res 2021 | vol. 23 | iss. 9 | e29622 | p. 11
(page number not for citation purposes)
XSL• FO
RenderXYou can also read