CHARTING THE COURSE FOR CONTINUED CENTER STORE GROWTH - COVID-19 and Navigating the Path Ahead - IRI
←
→
Page content transcription
If your browser does not render page correctly, please read the page content below

COVID-19 and Navigating the Path Ahead

CHARTING THE COURSE
FOR CONTINUED CENTER
STORE GROWTH
June 16, 2020

Sally Lyons Wyatt, EVP, IRI Practice Leader

Thea Bourianne, Senior Solutions Consultant
and Registered Dietitian, Label Insight
Center Store Roles
Executive Summary                              • Center Store roles have progressed through COVID - from Holistic Health and Wellbeing to Treating
                                               • Increasing demand of functional benefits for ingredients, packaging and online search engines
As we all know, COVID has been                   require expedited innovation
devastating to many people and                 • Brands across categories have acquired new and reacquired lapsed buyers during the peak
                                                 periods presenting an opportunity to identify and communicate to drive long-term value
businesses, but has been a catalyst for
                                               Transformation of Retail
Center Store Food & Beverage growth. In
                                               • Given the pressures on supply chain and inventory, agility and open communications will be critical
this report, we focus on the evolved roles       moving forward from sourcing to consumption
Center Store plays, transformation of retail   • Retail Brands are realizing strong growth, a win/win focus from manufacturers and retailers on
and the shopper post COVID and                   growing the aisle with the right mix is the path to mutual success
innovation success model ideas. We will        Transformation of the Shopper
provide activation ideas for you to consider   • Consumers are shopping a repertoire of retailers to address different essential requirements, so
for Charting the Course for Continued            enhance channel strategies to attract and/or retain these shoppers
                                               • Consumers interests in Sustainability have increased, therefore it is important to share all
Center Store Growth.                             Sustainability practices including recyclable, humane and ethical
                                               • DEEPEN engagement with new and at risk consumers via targeted addressable media
                                               • Potential baby boom presents opportunities to expand presence in these homes
 Visit IRI’s COVID-19 Insights Portal and      Innovation Success Model
 COVID-19 Dashboard for more reports           • To win the race for meals, leverage test and learn approaches to evolve offerings and move from
 and updates.                                    essential to entertaining
                                               • With random switching behavior occurring in some categories, hone innovation and portfolio
                                                 assortment that maps to hierarchical attributes of the purchasing behavior
                                               • With reduced trips customers will look for value through multipacks and larger pack sizes, but
                                                 don’t forget about small households

                                                                                             © 2020 Information Resources Inc. (IRI). Confidential and Proprietary.   2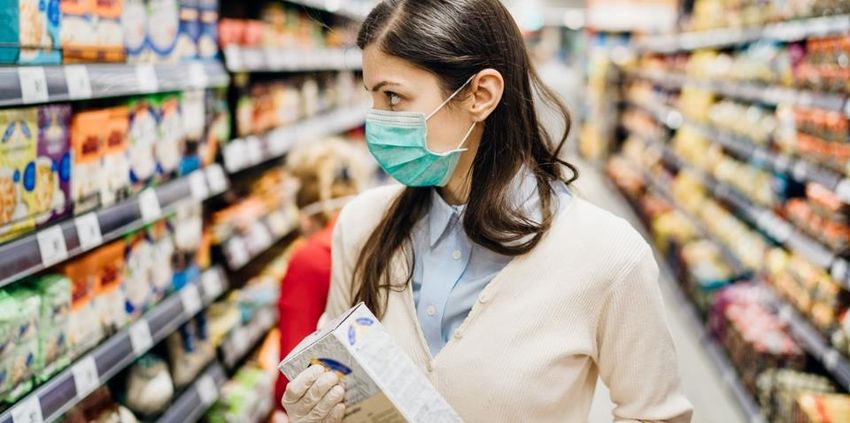
Executive Summary

               What Have            Center Store Roles       Transformation of
              We Learned?         During and Post-COVID      Retail Post-COVID

          Transformation of the        Innovation         Summary & Activation
          Shopper Post-COVID         Success Model              Ideas

                                                          © 2020 Information Resources Inc. (IRI). Confidential and Proprietary.   3
© 2020 Information Resources Inc. (IRI). Confidential and Proprietary. 4

COVID-19 Pandemic Has Impacted the World,
Including Changes to How We Eat & Drink

Mandated Restrictions of
“Shelter-in-Place” Resulted with
the Majority of Eating & Drinking
Occasions to Be at Home
                                Led to Unprecedented CPG Sales
                                Including Two Weeks of Cocoon-
                                Stocking Total Store
                                                       Accelerated Adoption
                                                       of Online F&B Sales

                                                                   Spring Holiday Celebrations
                                                                   Adopted More At-Home Activities,
                                                                   But Less “Traditional” Activities

                                                                                                     The Rest of 2020 is Poised to
                                                                                                     Have More At-Home Occasions
                                                                                                     Than Ever Before

                                                                               © 2020 Information Resources Inc. (IRI). Confidential and Proprietary.   5
All of the F&B Sales Increases Are Due to the Majority of Eating and
Drinking Occasions Occurring at Home Throughout COVID-19
Dollar Sales % Chg. vs YA                                                                                                                                                                            Total Store
  65                                    61%                          61%                                                                                                                             F&B
  60                                                                                                                                                                                                 Non-Food
  55
  50                                       56%
  45
                                                               51%
  40
  35
  30
  25
  20
  15
  10
   5
   0
  -5
       3/1/2020        3/8/2020      3/15/2020                     3/22/2020                  3/29/2020                       4/05/2020                   4/12/2020               4/19/2020                4/26/2020
 -10

                                                                                                                                                     Note: Data reflected does not include Costco or Total eComm
                     March 8th         March 15th
                  Reported cases       Americans
                    in 35 states   told to stay home

                                    Source: IRI TSV Model; Source: IRI TSV - MULOT+C; Source: IRI TSV eMarket Insights Model, Total Store is an aggregate of the 204 releasable eMarket Insights categories;
                                                                                F&B is an aggregate of the releasable Edible Categories; Total Core Snacking is an aggregate of releasable Snack Categories
                                                                                                                                         © 2020 Information Resources Inc. (IRI). Confidential and Proprietary.        6
Brands Across Categories Have Acquired New and
Reacquired Lapsed Buyers During the Peak Periods                                                                                                         Long-Term Value
                                                                                                                                                          of Retaining a
                                                                                                                                                         Fraction of New
                                                                                                                                                           Consumers
New Buyers Gained

     4MM       New Buyers Gained by National Frozen Entrée Brand
                                                                                                                                                                Hundreds of
   6.7MM       New Buyers Gained by Dominant Soup Brand                                                                                                          Millions of
                                                                                                                                                                 Dollars of
    20MM       New Buyers Acquired by Iconic Boxed Pasta Company
                                                                                                                                                                Revenue Per
                                                                                                                                                                    Year

                    *Based on IRI benchmarks, reaching new buyers through advertising within 4 weeks of their initial purchase results in an average of 12.6% of those trial buyers becoming repeaters
                                                                                                                   Source: IRI Loyalty database, IRI Consumer Panel. 12 weeks ending April 12, 2020
                                                                                                                                  © 2020 Information Resources Inc. (IRI). Confidential and Proprietary.   7
© 2020 Information Resources Inc. (IRI). Confidential and Proprietary. 8
COVID-19 has Been                       COVID-19
Devastating to Many
People and Businesses,               22 %
But Has Been a Catalyst
for Center Store Growth

               2019

               3%
               Will it have staying power?
                                  Source: IRI TSV– 52 Weeks Ending 12/29/19 vs YAGO & COVID Period 3/8-4/26/20
                                                © 2020 Information Resources Inc. (IRI). Confidential and Proprietary.   9
Center Store Has Several Roles for Consumers and They Have Progressed

   Holistic Health        Unite People in
                                                                    Community
    & Wellbeing          Special Occasions

      Pleasure                Tradition                                   Treating

                                              © 2020 Information Resources Inc. (IRI). Confidential and Proprietary.   10
Consumers are Cooking More from
Scratch vs. Pre-COVID-19; Most
Households Will Continue to Cook at
35% Home as Stay-At-Home Orders Ease
50% or Less
Creating more
meals from 40%
51-80%
scratch 81-100%
70%
73%
53% 38%
Will continue
to create meals 19%
from scratch 22%
11%
more than I did
before Category
Percent of Meals1for Category
Percent 2 for
of Meals
coronavirus.* All HH Members All HH Members
Prepared at Home Prepared at Home
before COVID-19 Currently
*Note: Those who said they are creating meals from scratch at home more due to coronavirus (477) – 5/1-5/3
Source: IRI Survey fielded 5/29-5/31 among National Consumer Panel representing Total U.S. Primary Grocery Shoppers
© 2020 Information Resources Inc. (IRI). Confidential and Proprietary. 11Center Store Occasions Have Positive Momentum as we Move to Less Restrictions
Across the U.S., However a Couple have Recently Realized Dollar Sales Softness
During COVID Path Ahead To-Date
Baking Dinner Focused Breakfast Snacking
60% 46% 41% 16% 41% 14% 12% 8%
Beverages Kid Focused Lunch Focused Baby
10% 9% 8% 4% 6% -4% 7% -4%
Source: IRI TSV– COVID Period 3/8-4/26/20 & Path Forward = 5/3-6/7/20; Focused based on select group of UPCs with occasion in name of product
© 2020 Information Resources Inc. (IRI). Confidential and Proprietary. 12Holistic Health & Wellbeing %
31 *
Focus more on my
35% of consumers health as a result of
this pandemic
proactively take care of
their PHYSICAL and
22%
EMOTIONAL health Change my eating
now vs. before habits to be healthier
as a result of this
COVID-19 pandemic
Source: IRI Weekly Surveys among IRI Consumer Network™ Panel representing Total U.S. Primary Grocery Shoppers - Average of waves 2-8 (3/20 – 5/3) & *Wave 8(5/1-5/3)
© 2020 Information Resources Inc. (IRI). Confidential and Proprietary. 13Chronic Illnesses Like High Blood Pressure,
Obesity, and Diabetes (Beyond age) are the Biggest
Risk Factors for Illness and Death From COVID
Center Store F&B Products that provide:
Diabetes Support Grew
9×
Obesity Support grew 11×
more in $ Sales
within the 8 Weeks vs. 2019, and went from
negative unit sales to positive
Hypertension Support COS F&B did
of 2019 Dollar Sales in 15% of the weeks
22%
Source: IRI TSV + Label Insight – 52 Weeks Ending 12/29/19 vs YAGO & COVID Period 3/8-4/26/20
© 2020 Information Resources Inc. (IRI). Confidential and Proprietary. 14Center Store F&B Products that provide:
Other nutrients a Good Source of Vitamin C sold
like Antioxidants, 20% of 2019 Dollar Sales
Vitamin D, and in 15% of the weeks and went
Gut Health all from negative to positive unit sales
contribute to a
healthy immune Vitamin D grew Dollars 11×
more within the 8 Weeks vs. 2019
system, and
products aligned
have benefited %
Antioxidants sold 18
of 2019 Dollar & Unit Sales
in 15% of the weeks
Source: IRI TSV + Label Insight – 52 Weeks Ending 12/29/19 vs YAGO & COVID Period 3/8-4/26/20
© 2020 Information Resources Inc. (IRI). Confidential and Proprietary. 15COVID-19 Brought on Higher Levels of Stress and
Anxiety and Turned to Center F&B for Help
Center Store F&B Products that provide
a Good Source of Magnesium grew 12×
in $ Sales within the 8 Weeks vs. 2019, and
went from negative unit sales to positive
We only have 26 F&B products making anxiety assistance
Big Opportunity claim and they are experiencing strong growth
Source: IRI TSV + Label Insight – 52 Weeks Ending 12/29/19 vs YAGO & COVID Period 3/8-4/26/20
© 2020 Information Resources Inc. (IRI). Confidential and Proprietary. 16We Have Seen an Expansion of CBD Products in Center Store and Consumers
Are Buying Predominantly to Treat Symptoms of a Medical Condition and/or Relax
To relax
To treat the symptoms of a medical condition
CBD Products Grew 8×
To improve the overall quality of my life More Dollar Sales Than
To make other activities more enjoyable in All of 2019 During the
To create a greater sense of well-being 8-Week COVID Period
To enhance my creativity
To enhance my concentration
To enhance personal growth
To enhance an appreciation for nature
To ease withdrawal symptoms
0 10 20 30 40 50 60 70 80
CBD Legal Marijuana
Motivations for Use IRI-MFour Cannabis Attitude and Usage Study, Feb. 2019 Source: IRI TSV– 52 Weeks Ending 12/29/19 vs YAGO & COVID Period 3/8-4/26/20
© 2020 Information Resources Inc. (IRI). Confidential and Proprietary. 17We Also Witnessed Consumers Wanting to Help Out Their Local
Restaurants by Purchasing Takeout Meals with the Majority at Dinner
%
24 Food Delivery Market Overall
Growth Year on Year in Revenues of the
(US, March 2020*)
Percent of adults who used restaurants for these off-premises
meal occasions during the previous week
70%
60%
50%
40%
30%
20%
10%
Feb 28 – Mar 1 Mar 6 – 8 Mar 13 - 15 Mar 20 - 22 Mar 27 - 29 Apr 3 - 5 Apr 10 - 12
Survey Fielding Period
Dinner meal Lunch meal Breakfast meal or beverage
Sources: https://www.restaurant.org/articles/news/consumers-are-still-seeking-off-premises-options#.Xs8ReYwWzpE.mailto *Second Measure
© 2020 Information Resources Inc. (IRI). Confidential and Proprietary. 18TV Viewing Increased and So Did Comfort Foods
During Coronavirus
18% of consumers have chosen Comfort foods
will likely stabilize,
more comfort foods for meals/sides with about the
same planning
to cut back as
15% admit to not following their those planning
diet/eating plan as closely to increase
Source: IRI Weekly Surveys among IRI Consumer Network™ Panel representing Total U.S. Primary Grocery Shoppers - Wave 10(5/15-5/17)
© 2020 Information Resources Inc. (IRI). Confidential and Proprietary. 19Easter, Passover and Other Spring Holidays
Had to Get Creative with At-Home F&B Celebrations
Confections Matzoh Crackers
Down in Sales Up 5% in $ Sales
During Easter vs. Passover ’19 Due to
Period Due to Individual Home vs. Larger
Fewer Out-of-Home Group Celebrations
Activities
© 2020 Information Resources Inc. (IRI). Confidential and Proprietary. 20Treating Their Family has Been on a
Steep Rise Since Early Weeks of COVID-19!
31%
I am treating myself and
my family more than I had 18%
in the past
Wave Two Wave Eight
Source: IRI Weekly Surveys among IRI Consumer Network™ Panel representing Total U.S. Primary Grocery Shoppers – Wave 2 = 3/20-3/22; Wave 8 = 5/1-5/3
© 2020 Information Resources Inc. (IRI). Confidential and Proprietary. 21Birthdays, Mother’s
Day, Graduations and
Many Other Special
Events Took on At-
Home F&B Celebrations
© 2020 Information Resources Inc. (IRI). Confidential and Proprietary. 22Adapting Center Store Products and Messaging Will Be a Growth Driver for the
Foreseeable Future – The Time is Right to Chart Your Course
We went from 70% of consumers rarely or
never worked from home before Coronavirus…
To… 40% Likely Work at Home
18%
6% 7%
4% 5%
5 or more 4 days per 3 days per 2 days per 1 day per
days per week week week week
week
Source: OH&S online (Occupational Health & Safety); Source: The Wall Street Journal – May 16-17,2020;
IRI Weekly Surveys among IRI Consumer Network™ Panel representing Total U.S. Primary Grocery Shoppers - Average of wave 8 (5/1-5/3)
© 2020 Information Resources Inc. (IRI). Confidential and Proprietary. 23© 2020 Information Resources Inc. (IRI). Confidential and Proprietary. 24
Transformation of Retail is
Underway with Action Ideas
                                                            There will
• Channel switching occurred, opened up                     be COVID
  opportunities, so vet your omnichannel strategy          long-lasting
• Online adoption accelerated, therefore comparing           in-store
  online share performance will become crucial
                                                              impact
• Online search needs to catch up with consumer
  demands, so collaboration is key
• Assortments need to align with shoppers varying            Plexiglass
  needs with multi-dimensionality as one answer
• With Retailer Brands increasing in sales, find a           Contactless
  win/win to grow the aisle with the right mix                Payments
• Some retailers are looking for alternative sources for   Curbside pickup
  hard to get products, so agility and communication
  are critical as we move forward

                                                                          © 2020 Information Resources Inc. (IRI). Confidential and Proprietary.   25
Grocery is Leading Traditional Channels in Dollar Sales Growth
Total Center Store - $ Sales % Change vs. Year Ago MULO+C
100 Grocery
92%
90 84%
Convenience
80 Mass
66% 68%
70
60 53% 64%
50
39%
40 36%
32%
29%
30 22%
9% 20% 19%
16% 18%
20 9% 14%
16%
9% 17% 6%
10 15%
4% -2% -2%
0
-12% -10%
-10 -15%
-21% -21% -19%
-20
-30
8-Mar 15-Mar 22-Mar 29-Mar 5-Apr 12-Apr 19-Apr 26-Apr
Overlap of
2019 Easter
Note: Mass = Walmart+Target+Kmart; Note: MULO+C includes Grocery, Drug, Mass, Club (excluding Costco), Dollar ,DeCA and Convenience retailers. Source: IRI TSV
© 2020 Information Resources Inc. (IRI). Confidential and Proprietary. 26For Our Assessment, We Have Taken Pre-COVID-19 Average and
Compared to the COVID-19 Period to Understand the Delta
The Delta Illustrates How Strong Purchasing Has Been At the Category Level Above The 2019 Growth Rates
During COVID-19
$ % Change
- Pre-COVID-19
$ % Change
=
Delta
March 8, 2020 to
Full Year 2019
April 26, 2020
© 2020 Information Resources Inc. (IRI). Confidential and Proprietary. 27Grocery, Dollar, Club and Online were Fan Favorites During COVID-19;
Military Had a Boost as Well
Total All Outlets Grocery Mass Drug Dollar
25.1% 17.6% 7.0%
22.7% 39.9% 16.3% 33.9%
19.1% 33.0% 32.5%
11.0%
3.7% 31.8%
31.0%
0.2%
Convenience Club Military Online Specialty
26.6% 49.7%
25.7% 24.3% 9.6%
21.5% 21.0%
-1.6%
15.0% 47.8%
-4.7% 47.5%
-12.1% -9.8%
-12.1%
Total Store F&B Center Store
Source: IRI Total All Outlet Panel/ Convenience POS – Dollar Delta
© 2020 Information Resources Inc. (IRI). Confidential and Proprietary. 28During COVID – Grocery Gained Center Store Share Predominantly from
Convenience – Dollar and Online Gained Shares as Well
FOOD MASS DRUG CONV. CLUB DOLLAR OTHER
2019 45.0% 22.9% 12.9% 9.6% 5.6%
2.1% 1.9%
+4.3
COVID 49.3% 21.8% 9.0% 9.6% 6.3%
1.7% 2.2%
Food Mass Drug Convenience Club Dollar All Other
Source: IRI Total All Outlet Panel/ Convenience POS
© 2020 Information Resources Inc. (IRI). Confidential and Proprietary. 29Convenience Retailers Provided Fill In Trips When Possible and
Have Several Actions Underway to Maximize Future Growth
SKU Rationalization Some evaluating Mid to smaller tier Retailers smaller
by some retailers looking pack sizes in chains found new than 1,500 locations
at the bottom 20% to comparison to changes sources for items like are struggling with
augment their offerings in in trip frequency toilet paper causing OOS center stores items so
certain areas and long wait times looking for ways to
succeed
Less Flying Increasing staycations and regional
More Driving vacationing presents opportunities for
C-Store to engage with more consumers
© 2020 Information Resources Inc. (IRI). Confidential and Proprietary. 30E-Commerce Trends Higher Than Brick & Mortar Across All the Time Periods, and
Sales Continued to Realize Strong Growth into June
Dollar % Change
120%
104.4%
98.8%
100% 90.2% 88.8%
85.2%
78.8% 80.7% 82.2%
73.2%
80% 67.3%
65.8%
63.2%
60% 50.7% 53.1%
43.1% 64.3%
40%
22.5% 19.2%
16.3%19.5% 19.2% 19.1% 15.9%
14.8% 13.3% 11.8%
20% 9.1%
6.4%
0%
In Store Online
Source: $ % Change - IRI TSV & eMarket Insights COS
© 2020 Information Resources Inc. (IRI). Confidential and Proprietary. 31However, Not All Experiences Online Were Positive for Consumers and
Retailers Were Battling Challenges to Keep Up with Demand
of consumers stated
62 % some items they wanted
were not available to
order online Plethora of Challenges for Click & Collect
GROCERY:
stated items ordered were • Staffing and Infrastructure - Prep space, staffing and training
48% not delivered due to
availability changes
expertise to collect groceries, efficiency in collection
• Delivery Windows - Managing and ensuring that there was
inventory and tackling out-of-stock situations
• Fulfillment – Some retailers pushed pickup dates to 3-5 days
to better manage fulfillment.
• Service Void - Several did not have Click and Collect and
21% couldn't get a delivery time
that was convenient
wished they did
MASS:
• Channel had online services already up and running, but they
still had to manage the high demand and incurred OOS
Source: IRI Weekly Surveys among IRI Consumer Network™ Panel representing Total U.S. Primary Grocery Shoppers – 4/24-26; IRI Analysis
© 2020 Information Resources Inc. (IRI). Confidential and Proprietary. 32Retailers Do Have Several Advancements in
Process or Planned to Handle Demand
• Click & Collect expansions and/or implementation accelerating for some
retailers
• Adjustments to capabilities and resources for processing online orders in
existing stores
• Enhanced partnerships with delivery companies
• Micro-warehouses within store; Some leveraged marginally performing
stores for fulfillment
• Drive-up areas being added or expanded
• Some are leveraging their FSP to gain visibility to localized store inventory in
real-time to digitally target customers
• Eventually new stores could allocate more space for online fulfillment,
especially in densely populated, affluent, urban areas
Source: IRI Analysis
© 2020 Information Resources Inc. (IRI). Confidential and Proprietary. 33Not All Center Store Categories Grew During COVID-19 for Various Reasons, but a Few
Because of Limited Availability
BREATH FRESHENERS
GUM ENERGY DRINKS DRIED MEAT SNACKS SIDE DISHES – RFG
NON-CHOCOLATE CANDY
CHOCOLATE CANDY No organized sports and Decline in convenience channel Declines driven by RFG
no gyms open foot traffic and people not eating Appetizers and RFG Salad/
Easter impacted with in-store meals or snacks while on-the-go Fruit/Coleslaw subcategories
down 4% and online up 65% which are primarily for
but could not offset large in- parties/ gatherings
store scale
TEA/COFFEE —
SNACK BARS/GRANOLA LUNCHES – RFG READY-TO-DRINK
OTHER SNACKS–AISLE PIES & CAKES
Consumers were preparing Declines due to limited CHEESECAKES – RFG
CANNED JUICES–SS lunches at home and therefore convenience traffic (+20% of Limited availability
All 3 were flat or increasing on minimized purchasing ‘kits’ sales), people making more
volume indicating a decline coffee and tea at home and
on price limited availability
© 2020 Information Resources Inc. (IRI). Confidential and Proprietary. 34When Shoppers Face Out of Stocks, There are a Variety of Actions They Take
Went to a different physical
% went
34 elsewhere 25% store and bought the item
I wanted
Went online to order the
14% item I wanted from an
online retailer
Went back to that same
18% retail location later to buy it
when it was back in stock
50 %
Bought a different brand or None of the above,
16% variety instead, from the didn’t buy it or wasn’t able
same retailer location to find it elsewhere
Source: IRI Survey 2020, among IRI Consumer Network™ Panel representing Total U.S. Primary Grocery Shoppers, IRI Covid-19 Survey May 15-17, 2020
© 2020 Information Resources Inc. (IRI). Confidential and Proprietary. 35All Channels Closely Monitoring
Inventory Management
Planning / forecasting currently is all hands-on deck
Holiday planning will be especially challenging, with fewer
gatherings especially if COVID springs up again in the fall
Transportation from warehouse to store is being reviewed
and enhanced when possible
Omnichannel fulfillment strategies are being refined
(e.g., online vs. in-store)
In-Store SKU Rationalization is occurring; however, tactics
will be different across retailers, from rankings to loyalty data
and shopper propensity to pre-COVID underperforming items
that spiked to see if repeat has occurred
Source: IRI Analysis
© 2020 Information Resources Inc. (IRI). Confidential and Proprietary. 36Center Store Products Had an Average of 6.5% Increase in Price Per Unit During COVID-19
and Shoppers Noticed, Felt it in Their Wallets and Some Migrated to Private Label
Q. Consumers who agree with statement: I have seen prices increase because of the coronavirus.
86%
82%
73% 74%
69% 70%
67% 66%
61%
51%
41%
Wave 1 Wave 2 Wave 3 Wave 4 Wave 5 Wave 6 Wave 7 Wave 8 Wave 9 Wave 10 Wave 11
Source: IRI Survey 2020, among IRI Consumer Network™ Panel representing Total U.S. Primary Grocery Shoppers. March 13-15 to May 22-24
© 2020 Information Resources Inc. (IRI). Confidential and Proprietary. 37Consumers Have Different Reasons for Purchasing Retailer Brands –
Some Prefer the Products While a Default Choice For Others
Sentiments Consistent from March to April; Percentages Who Agree Completely
19 % 24%
chose Private Label bought
in the past month Private Label
because the brand products in
they usually buy the past month
was unavailable to save money
Source: IRI Survey 2020, among IRI Consumer Network™ Panel representing Total U.S. Primary Grocery Shoppers, IRI Covid-19 Survey May 15-17, 2020
© 2020 Information Resources Inc. (IRI). Confidential and Proprietary. 38Saving Money or Preferred Brand Not Available Were the Primary Drivers for the
Significant Growth Across All Retailers' Brand Tiers During COVID-19
$ % Change
61%
40% 39%
26%
14%
11%
4% 2%
Premium Natural and Organic Mainstream Value
2019 COVID-8 Week
Note: Private Label Tiers based on the retailer’s positioning of their store brands: Premium Tier: ultra premium ingredients and flavors, Natural/Organic Tier: clean and/or organic
ingredients often with related certifications, Mainstream Tier: designed for the mass market and often carry the banner name, Value Tier: designed for the tightest family budgets.
Source: IRI TSV and IRI NCP – MULO – Total US - COVID Period – 3/8-4/26/20 vs Year Ago
© 2020 Information Resources Inc. (IRI). Confidential and Proprietary. 39Even in Recent Weeks, These Tiers have Continued to See Strong Dollar Growth
$ % Change
61%
43%
40% 39%
30% 28%
26%
19%
14%
11%
4% 2%
Premium Natural and Organic Mainstream Value
2019 COVID-8 Week 5 WE 5/31
Note: Private Label Tiers based on the retailer’s positioning of their store brands: Premium Tier: ultra premium ingredients and flavors, Natural/Organic Tier: clean and/or organic
ingredients often with related certifications, Mainstream Tier: designed for the mass market and often carry the banner name, Value Tier: designed for the tightest family budgets.
Source: IRI TSV and IRI NCP – MULO – Total US - COVID Period – 3/8-4/26/20 vs Year Ago
© 2020 Information Resources Inc. (IRI). Confidential and Proprietary. 40Although All Tiers Grew, There Was a Massive Switch from Natural & Organic
Driving Retailer Brands' Growth Contribution To Mainstream During COVID
81%
68%
Share of Growth
32% 2019
COVID
11%
6% 0% 0%
2%
Premium Natural and Organic Mainstream Value
Note: Private Label Tiers based on the retailer’s positioning of their store brands: Premium Tier: ultra premium ingredients and flavors, Natural/Organic Tier: clean and/or organic
ingredients often with related certifications, Mainstream Tier: designed for the mass market and often carry the banner name, Value Tier: designed for the tightest family budgets.
Source: IRI TSV and IRI NCP – COVID Period – 3/8-4/26/20 vs Year Ago
© 2020 Information Resources Inc. (IRI). Confidential and Proprietary. 41Grocery Retailers’ Brands were Losing in Value and Mainstream until COVID
Happened With Both Growing For Different Reasons
Mainstream’s Household Penetration is 95%,
Therefore This Trend is All About Everyone Buying More During the Pandemic
-1%
Food –
U.S. Total $ Mainstream 0%
Chg VS YA 29%
2018
2019
48%
Covid-8 week -2%
Value -5%
28% of Buyers Were NEW
to the Value Tier
-10% -5% 0% 5% 10% 15% 20% 25% 30% 35%
Note: Private Label Tiers based on the retailer’s positioning of their store brands: Premium Tier: ultra premium ingredients and flavors, Natural/Organic Tier: clean and/or organic
ingredients often with related certifications, Mainstream Tier: designed for the mass market and often carry the banner name, Value Tier: designed for the tightest family budgets.
Source: IRI TSV and IRI NCP – COVID Period – 3/8-4/26/20 vs Year Ago
© 2020 Information Resources Inc. (IRI). Confidential and Proprietary. 42Although Grocery is Still Seeing Strong Growth for Their Mainstream Private Label,
the Value Tier Trends have Slowed Mainly Due to Competition with Dollar Stores
-1%
Food – 0%
Mainstream
US Total $ 29%
Chg VS YA 23%
2018
2019
Covid-8 week -2%
5 WE 5/31 -5%
Value
28%
2%
-10% -5% 0% 5% 10% 15% 20% 25% 30% 35%
Note: Private Label Tiers based on the retailer’s positioning of their store brands: Premium Tier: ultra premium ingredients and flavors, Natural/Organic Tier: clean and/or organic
ingredients often with related certifications, Mainstream Tier: designed for the mass market and often carry the banner name, Value Tier: designed for the tightest family budgets.
Source: IRI TSV and IRI NCP – COVID Period – 3/8-4/26/20 vs Year Ago
© 2020 Information Resources Inc. (IRI). Confidential and Proprietary. 43Given the Nutrient Dense Nature of Natural and Organic Products,
Increasing Numbers of Consumers Became Engaged with Private
Label Options During COVID-19
48% 48%
penetration of the buyers
increased 10 are NEW
points vs. YA
Note: Private Label Tiers based on the retailer’s positioning of their store brands: Premium Tier: ultra premium ingredients and flavors, Natural/Organic Tier: clean and/or organic
ingredients often with related certifications, Mainstream Tier: designed for the mass market and often carry the banner name, Value Tier: designed for the tightest family budgets.
Source: IRI TSV and IRI NCP – COVID Period – 3/8-4/26/20 vs Year Ago
© 2020 Information Resources Inc. (IRI). Confidential and Proprietary. 44Overall Center Store Purchasing Behavior Has Remained Similar Across the U.S.
Even as States Begin to Loosen Restrictions and Open Restaurants
Washington
Maine
Montana North Dakota
Phased Reopening Scheduled
Minnesota New Hampshire Partial Reopening as of 4/27/20
Oregon
Vermont
Massachusetts
Idaho Wisconsin
South Dakota New York Rhode Island
Michigan Connecticut
Wyoming
New Jersey
Nevada
Iowa Pennsylvania
Delaware
$ Sales % Change vs. Year Ago
Nebraska
Ohio Maryland
Utah Illinois Latest 6wks
Indiana District of Columbia
West (5/3 to 6/7)
Colorado Virginia
California
Kansas Missouri
Kentucky
Virginia Total U.S. 16%
North California 17%
Carolina
Tennessee Texas 13%
Arizona Arkansas Florida
New Mexico
Oklahoma South 13%
Carolina
New York 15%
Georgia
Mississippi Alabama Pennsylvania 16%
Ohio 17%
Texas Georgia1 14%
Louisiana
Alaska North Carolina 19%
Florida Illinois 16%
Michigan 19%
Virginia 17%
Tennessee2 14%
Hawaii
Note: 1. Georgia opened restaurants to dine-in on 4/27/20 2. Tennessee opened restaurants to dine-in in all but 5 counties Source: IRI POS data, IRI & BCG Analysis
© 2020 Information Resources Inc. (IRI). Confidential and Proprietary. 45There Are Other Resources and Venues Shoppers Are Exploring, Engage and
Entice These Shoppers with an Experience that Matches or is Better Than These
Source: IRI Survey 2020, among IRI Consumer Network™ Panel representing Total U.S. Primary Grocery Shoppers. 5/15-5/17/20
© 2020 Information Resources Inc. (IRI). Confidential and Proprietary. 46© 2020 Information Resources Inc. (IRI). Confidential and Proprietary. 47
Shopper Dynamics Have Emphasized the Need to Align Channel Strategies with
Shopper Needs Which Can Be Based On Many Dimensions and Drive Trip Types

                                        • Holistic Health
      Income          Generations          & Wellbeing
                                                                                                Kids

               No Kids              SNAP                  Attitudes
                                                     (e.g., Sustainability)

                                                   © 2020 Information Resources Inc. (IRI). Confidential and Proprietary.   48
Center of Store Trips Were Important Trips and They Increased
Twice as Much as Total Store During the COVID-19 Period
Trips per Buyer Basket Size
10.7% 23.3%
22.1%
6.2%
5.2%
19.9%
% Change vs Year ago % Change vs Year Ago
Total Store Food & Bev Center of Store Total Store Food & Bev Center of Store
IRI NCP Panel 8 w.e. 4/26/20
© 2020 Information Resources Inc. (IRI). Confidential and Proprietary. 49With Widespread COVID-19 Outbreak, Pantry Stocking Trips Increased Share
Significantly at the Expense of Quick Trips
Total U.S. – All Outlet
COS Trips by Type COS Dollar Sales by Trip Type
4.9 15
Quick Trip 18 (19%)
43 11
Quick Trip 48 Special Purpose 13
18
Fill In 20
15
Special Purpose 15
19
Fill In 19 57 Spend in
Pantry Stocking 49 Pantry
Pantry Stocking trips
Pantry Stocking 18 23 Stocking grew +8 pts
trips gained vs. YA
5 pts vs. YA
Calendar 8 w.e. Calendar 8 w.e.
Year 2019 4/26/20 Year 2019 4/26/20
Source: IRI Panel All Outlets.
© 2020 Information Resources Inc. (IRI). Confidential and Proprietary. 50When Looking at Combined Attitudes and Income,
Over 4 in 10 Americans are now Cautious and Worried or
Downtrodden Which Impacts What They Buy and Where
9% 9% Downtrodden
23%
32% Cautious
and Worried
10%
13% 12% Start-Ups
8% Savvy Shoppers
30% 21% Optimistics
15% 18% Carefree
2019 2020
Source: IRI Panel All Outlets – Econolink Segmentation.
© 2020 Information Resources Inc. (IRI). Confidential and Proprietary. 51In Addition to Traditional Channels, Shoppers Went to a Variety of Others to Fulfill Their Center Store
F&B Needs More Than Usual, and Many Realized an Increased Number of Buyers During COVID-19
Low Income Middle Income Upper Income
SPECIALTY STORES SPECIALTY STORES HEALTH/VITAMIN
LIQUOR
MILITARY LIQUOR
MILITARY
OFFICE SUPPLY
Source: IRI Panel All Outlets.- COVID Period – 3/8-4/26/20 - Index vs Total Population Delta >1 for Non-Traditional or Online Channels
Lower Income: (=$70k 1P + $30k all others )
© 2020 Information Resources Inc. (IRI). Confidential and Proprietary. 52It Was the Similar Scenario Across Generations
Younger Older Generation X Boomers Seniors
Millennials Millennials & Retirees
INTERNET SPECIALTY STORES SPECIALTY STORES OFFICE SUPPLY LIQUOR
HARDWARE
SPECIALTY STORES MILITARY
LIQUOR
OFFICE SUPPLY
OFFICE SUPPLY
HARDWARE HARDWARE
Source: IRI Panel All Outlets.- COVID Period – 3/8-4/26/20 - Index vs Total Population Delta >1 for Non-Traditional or Online Channels
Millennials-Younger (Born 1990-1996): Millennials-Older (Born 1981-1989); Generation X (Born 1965-1980); Boomers (Born 1946-1964); and Seniors and Retirees (Born 1925-1945);
© 2020 Information Resources Inc. (IRI). Confidential and Proprietary. 53When Home From the Store, the Pandemic Brought Out the Inner Chef In Many
Households With Convenience, Breakfast and Flavorings Winning in the Basket
Convenience Meals with All Kid groups looking for Cooking and Eating with Flavor:
Sloppy Joes, Chili, & Breakfast options with Worcestershire, Tartar Sauce,
Breading/Coating Mixes, FZ Breakfast Entrees & Chili Sauce, Hot/Cajun Sauce
SS Prepared Dinners Rfg Breakfast Entrees
Source: IRI Panel All Outlets.- COVID Period – 3/8-4/26/20 - $ Share of Total Basket Delta (% Chg Covid vs % Chg 2019)
© 2020 Information Resources Inc. (IRI). Confidential and Proprietary. 54When Looking At Dollar Share of Baskets, Shoppers Are Purchasing to Please Kids
in the Home but Have Different Selections When No Children Are Present
Convenience categories with 0-5 Pizza showing up across all: HHs without kids rely more on
year olds with Ready-to-Serve younger kids with Pizza Shells, Microwave Entrees
Rice, Ramen, FZ Pierogis teens Rfg Pizza Kits and all
ages Frozen Pizza
Source: IRI Panel All Outlets.- COVID Period – 3/8-4/26/20 – Top Indexing Categories - $ Share of Total Basket
© 2020 Information Resources Inc. (IRI). Confidential and Proprietary. 55Given The Rise In Unemployment, There Has Been an Increase
In SNAP Households – Categories Gearing More Towards Kids,
Baking, Breakfast and Snacking Can Be Found In These Homes
Kids Beverages
Mac and Cheese Bottled Water
Fruit Rolls RFG Orange Juice
String Cheese Fruit Drink Mix
Marshmallows SS Juices
Tea
Key Breakfast Products Baking Snacks
FZ Breakfast Handhelds Chocolate Chips Salty Snacks
Muffins Pie Filling
Pancake Mix Spices
Source: IRI Panel All Outlets.- COVID Period – 3/8-4/26/20 – Based on Penetration Index and $ % Change
© 2020 Information Resources Inc. (IRI). Confidential and Proprietary. 56Shoppers are Increasingly Searching
for F&B Products Based on Their
Attributes or Benefits They Deliver
For Example, Families With Young Kids Care
About the Environment and Are Informed
• I make a conscious effort to recycle
• Packaging for products should be recycled
• Usually only snack on healthy foods
• Prefer foods w/out artificial additives
• Usually read info on label
Source: IRI ShopperSights - Index –HH’s with Young Kids; Numbers based on indices above 110
© 2020 Information Resources Inc. (IRI). Confidential and Proprietary. 5755%
of Shoppers Say • SHELLFISH FREE • DAIRY FREE
Food Allergies or • PEANUT FREE • MILK FREE
Intolerances Affect • FISH FREE • CASEIN FREE
the Way They Shop • TREE NUT FREE • SOY FREE
Top $ Rank Center • EGG FREE • GLUTEN FREE
Store “Free” From • LACTOSE FREE • WHEAT FREE
Products
Source: IRI TSV + Label Insight – 52 Weeks Ending 12/29/19 vs YAGO & COVID Period 3/8-4/26/20
© 2020 Information Resources Inc. (IRI). Confidential and Proprietary. 58Holistic 70%
of shoppers are looking
Health & for specific attributes
that are important to
Wellbeing them when choosing a
brand
Needs Amplified
During COVID-19
and the Quest is
Consumers are Purchasing Foods That Align With a Variety of Ailments and/or
ON to Minimize Consumer as a Preventative Measure With Top Selling Notables Below
and/or Prevent
Disease States
Source: IRI TSV + Label Insight – 52 Weeks Ending 12/29/19 vs YAGO & COVID Period 3/8-4/26/20 (IBM & NRF research study 2020)
© 2020 Information Resources Inc. (IRI). Confidential and Proprietary. 59Center Store Products That Align
Towards Top-Ranking Diets Did
Well During COVID
65%
of Shoppers
Adhere to a
Particular Diet or
Health-Related
Eating Program
Source: IRI TSV + Label Insight – 52 Weeks Ending 12/29/19 vs YAGO & COVID Period 3/8-4/26/20
© 2020 Information Resources Inc. (IRI). Confidential and Proprietary. 60Shoppers During COVID Have Demonstrated Increased Interest In
Finding Foods That Support Immunity and Mental Health Applications
Search…
From February to March
Searches related to
Vitamin C searches increased 74× immunity increased 7.5×
Magnesium searches increased 26×
Searches related to
Vitamin D searches increased 18× immunity increased 6.3×
In 2019, Center Store Products with Immunity Claims Grew 19% in Dollar sales
and Almost Doubled 2019 Growth During the 8-week COVID Period!
Source: IRI TSV + Label Insight – 52 Weeks Ending 12/29/19 vs YAGO & COVID Period 3/8-4/26/20
© 2020 Information Resources Inc. (IRI). Confidential and Proprietary. 61F&B Brands and Retailers are Missing a Large Opportunity to
Take Advantage of Shopper Shifts to Functional Foods and Beverages
51%
of food products fail to claim their EXAMPLE:
single most searched attribute Vegan is the 2nd most
searched for attribute in
the snack category but is
87% unclaimed by brands that
of food products fail to claim at least qualify 76% of the time.
one of their top 3 searched attributes
© 2020 Information Resources Inc. (IRI). Confidential and Proprietary. 62An Annual Earth Day Study From
Kearney Has Indicated That the COVID
Pandemic Has Increased Many
Consumers Concerns About the
Environment
48% of respondents said it had
made them more concerned about
the environment
55% said that as a result of
COVID-19 they were more likely
to purchase environmentally friendly
products
Source: https://www.kearney.com/consumer-retail/article/?/a/consumer-support-still-strong-as-earth-day-celebrates-its-50th-
birthday&utm_medium=email&utm_source=vuturethankyoupage&utm_campaign=2020AmericasEarthDay
© 2020 Information Resources Inc. (IRI). Confidential and Proprietary. 63We Have Seen an Uptick In Center Store Products That Tout Sustainability Practices,
but We Have Also Seen Consumers Beginning to Practice Self-Sustaining
Products That Touted Sustainable Messaging Grew More Dollar Sales versus all of 2019:
RECYCLABLE
7× the Growth
ETHICAL
12× the Growth
RECYCLED PACKAGING
22× the Growth
HUMANE
4× the Growth
Source: https://www.npr.org/2020/04/03/826925180/we-are-swamped-coronavirus-propels-interest-in-raising-backyard-chickens-for-egg;
https://www.pri.org/stories/2020-04-21/gardening-home-during-covid-19
Source: IRI TSV + Label Insight – 52 Weeks Ending 12/29/19 vs YAGO & COVID Period 3/8-4/26/20
© 2020 Information Resources Inc. (IRI). Confidential and Proprietary. 64Other Shopper Situations That Will Be
Part of the Transformation
• Urban leaving to rural will impact what and where these consumers will buy
• We are predicting a Great Lockdown Baby Boom late this year and
early 2021, therefore manufacturers and retailers should prepare!
– Pregnancy kits up over
11.7% 13.6%
9.3% 8.4% 7.0% 7.9% 8.4% 9.3% 8.0%
-4.6%
1/1/20 to 4/19/20 to 4/19/2020 4/26/2020 5/3/2020 5/10/2020 5/17/20 5/24/20 5/31/20 6/7/20
4/12 6/7
Source: $ % Change - IRI TSV
© 2020 Information Resources Inc. (IRI). Confidential and Proprietary. 65Now, More than Ever, It is Critical to
DEEPEN Connections With Consumers
For Success
• Demand/Roles/Needs-based
• Engage via targeting
• Educate and/or Inform
• Purchase Cycle
• Experiential
• New Product Alerts
Shift away from mass print media to
personalized, addressable marketing
© 2020 Information Resources Inc. (IRI). Confidential and Proprietary. 66© 2020 Information Resources Inc. (IRI). Confidential and Proprietary. 67
COVID-19 has Overturned Predictive Switching Behavior in Several COS
Categories Pointing Towards the Need for Innovative Messaging to Communicate
Benefits and/or Innovating Products with Clear Distinction

             Predictive consumer        Predictive consumer                       Once predictive, random
             switching behavior is   switching is still evident but                 switching behavior
                  maintained                   eroding                                   occurred

                                                             © 2020 Information Resources Inc. (IRI). Confidential and Proprietary.   68
Additional Ways are Visible For You to Chart Your Innovation Success to Drive Continued Growth
To win the race for meals, retailers and center store manufacturers should
leverage test and learn approaches, including AI, to evolve offerings,
communications, in store and online experience and move from essential
to entertaining
Bolster a fresher With reduced trips Innovation with
perception through customers will look for Wellbeing features
innovation –product, value through multipacks and benefits
packaging &/or messaging and larger pack sizes,
but don’t forget about
small households
Source: IRI Analysis
© 2020 Information Resources Inc. (IRI). Confidential and Proprietary. 69There are Many Areas for Functional Benefits –
Find Ones That Align with Your Brand and/or New Innovation
• Innovative messaging for current products with wellbeing features
and benefits like stress, sleep, anxiety and mood support
• New product innovation needs to include functional benefits and
note via claims and/or highlight nutrients and ingredients tied to
immunity support and mental health support
• Collaborate with retailers to syndicate these benefits to their e-
commerce product pages
• Retailers can create planogram sections or faceted search for
immunity support and mental health support
© 2020 Information Resources Inc. (IRI). Confidential and Proprietary. 70© 2020 Information Resources Inc. (IRI). Confidential and Proprietary. 71
Charting the Course for
Continued Center Store Growth
Role of Center Store
• Adapting Center Store products and messaging to the various roles will be a growth
  driver for the foreseeable future
• Identify and communicate with your new and reacquired lapsed buyers during COVID
  period to drive long-term value
• Holistic Health & Wellness is increasing demand of Functional benefits for ingredients,
  packaging and online search engines - advance and expedite to meet consumers needs
Transformation of Retail
• Agility and open communications will be critical moving forward from sourcing to
  consumption
• Balance assortments with multi-dimensionality
• Value will play an important role but value means different things to different people -know
  and address your target’s preferences
• Private Label is not a single brand, it is thousands of brands that support retailers’
  customer loyalty; a win/win focus on growing the aisle with the right mix is the path to
  mutual success

                                                                                          © 2020 Information Resources Inc. (IRI). Confidential and Proprietary.   72
Charting the Course for
Continued Center Store Growth
Transformation of the Shopper
• Consumers are shopping a repertoire of retailers to address different essential requirements, so
enhance channel strategies to attract and/or retain these shoppers
• Share all Sustainability practices including recyclable, humane and ethical
• DEEPEN engagement with new and at risk consumers via targeted addressable media
• Potential baby boom presents opportunities expand presence in these homes
Innovation Success Model
• To win the race for meals, leverage test and learn approaches to evolve offerings,
communications and in store and online experiences and move from essential to entertaining
• Center store has an opportunity to bolster a fresher perception through innovation – both
product and packaging
• Hone your innovation and portfolio assortment that maps to the hierarchical attributes of
the purchasing behavior
• With reduced trips customers will look for value through multipacks and larger pack sizes, but
don’t forget about small households
• Innovative messaging and/or innovation with Wellbeing features and benefits should be an
important part of your growth plan
© 2020 Information Resources Inc. (IRI). Confidential and Proprietary. 73Look for an Announcement of Our Center Store F&B Podcasts-to-Come
Holistic Health Retail & Shopper & Basket At Home
& Wellbeing Center Store Center Store Evolution Cooking
from Inspirations
Pregnancy
to Baby
Visit IRI’s COVID-19 Insights Portal & COVID-19 Dashboard for More Reports & Updates
© 2020 Information Resources Inc. (IRI). Confidential and Proprietary. 74THANK
YOU!
For More Information, Contact Us:
Sally Lyons Wyatt Thea Bourianne
Sally.LyonsWyatt@IRIworldwide.com tbourianne@labelinsight.com
© 2020 Information Resources Inc. (IRI). Confidential and Proprietary. 75IRI COVID-19 Thought Leadership
Helping You Stay Informed
IRI’s Online Insights Offers Real-Time
Updates and Weekly Reports of the Impact
of the Virus on CPG and Retail, as Well as
Consumer Survey Data from this Report
The IRI COVID-19 Info Portal
Includes COVID-19 impact analyses, dashboards
and the latest thought leadership on supply chain,
consumer behavior, channel shifts for the U.S.
AND international markets
The COVID-19 Dashboard
Accessible through the insights portal
and tracks the daily impact of COVID-19.
This includes the top categories across
countries, out-of-stocks and consumer
sentiment on social media.
© 2020 Information Resources Inc. (IRI). Confidential and Proprietary. 76© 2020 Information Resources Inc. (IRI). Confidential and Proprietary. 77
Attribute-based Insights for Manufacturers and Retailers

                                                                                                                                           Attributes
                                                                                                                                          That Matter

  Market & Shopper Data                                  Product Attribute Data
  A leading provider of big data, predictive analytics   A data refinery for granular product information that
                                                                                                                                The data you need to identify
  and forward-looking insights that help brands and      powers transparency between brands, retailers, and                      what matters most to your
  merchants grow their businesses. IRI is the largest    consumers. Provides the industry’s most complete
  repository of purchase, media, social, causal and      and thoroughly derived product attributes: high order
                                                                                                                                 consumers and shoppers.
  loyalty data.                                          attributes.

                                                                                                                 © 2020 Information Resources Inc. (IRI). Confidential and Proprietary.   78
The Label Insight partnership adds value across IRI products and solutions
Strategic Analytics Media and
POS Data Shopper Intelligence Innovation
and Consulting
CSIA Assortment Audiences
Market Advantage ShopperSights Price Elasticity Market Structures
Shopper Loyalty Trend Spotter CDTs
500+ Individual Product Attributes
15 Attribute Segments
Coding Across Edible & Non-Edible Categories
© 2020 Information Resources Inc. (IRI). Confidential and Proprietary. 79Stay on top of market trends with 500+ Attributes that Matter
ALLERGENS & FDA NUTRIENT
CLEAN LABEL CONSUMER AUDIENCE BOTANICALS & OILS
INTOLERANCES CONTENT CLAIMS
12 19 15 17 59
HEALTH BENEFITS & INGREDIENTS OF
FEATURES & BENEFITS HERBS & SPICES ISOLATED FIBER
SUPPORT CONCERN
53 59 32 21 60
PERSONAL CARE
LIFESTYLE & DIETS PLANT-BASED PROTEIN SUSTAINABILITY SWEETENERS
PRODUCT FORM
29 14 40 42 42
© 2020 Information Resources Inc. (IRI). Confidential and Proprietary. 80EconoLink Provides View of Americans’ Response to COVID-19 Through a
Human Economic Lens That Goes Beyond Income; Not All Respond Alike
SAVVY SHOPPERS DOWNTRODDEN
Their financial situations are improving vs. YAG but Their financial situations are markedly worse vs.
they still look for value – although that doesn’t always YAG, and their go-to response is deprivation; they try
mean the lowest price. They love to find coupons and to cut back on everything. Purchases highly
good deals on groceries. influenced by price, brand and/or prior experience/
Savvy Down- trust.
SKEWS: Younger Baby Boomers, Retirees | Mean Shoppers trodden
HHI $75,600 SKEWS: Older Millennials/Younger Boomers | Blue
8% 9%
Collar | Hispanic | Lower Income
CAREFREE Carefree
Their financial situations are in a stable place; no 18% CAUTIOUS & WORRIED
real financial concerns. They’re willing to splurge on Their financial situations are markedly worse vs.
premium products, and brand preference is a greater YAG, and they do not hold out a lot of hope for things
Cautious &
driver than price for their buying decisions. to get better.
Worried
SKEWS: Older Boomers & Retirees | Male | Live 32% SKEWS: Baby Boomers | Live Alone
Alone | Upper Income
Optimistics
OPTIMISTICS 21% START-UPS
Their financial situations are better vs. YAG, and they Their financial situations are largely the same as
are optimistic about their financial future. Price is on Start-Ups YAG but they’re still struggling. They, too, are
their radar but so are product experiences and brand 12% focused on cutting back but with positive
trust. expectations for future improvement in their financial
situations.
SKEWS: Gen Z, Millennials and Gen X | 4+ Member
HHs | African American | Mean HHI $72,000 SKEWS: Gen Z/Millennials | African American,
Asian | Blue Collar | Lower Income
Source: IRI EconoLink, IRI Survey fielded 3/20-3/22, 2020, among IRI Consumer Network™ Panel representing Total U.S. Primary Grocery Shoppers
© 2020 Information Resources Inc. (IRI). Confidential and Proprietary. 81You can also read