Child Welfare Key Indicators Monthly Report
←
→
Page content transcription
If your browser does not render page correctly, please read the page content below
Ily Support

                 Child Welfare Key
                     Indicators
                  Monthly Report
                                   October 2021
                      Including Updated Data through September 2021

                                                                        A review of the
                                                                         Child Welfare
                                                                      System through key
                                                                      outcomes, process,
                                                                          qualitative,
                                                                         workload and
                                                                      resource indicators

 A Results-Oriented Accountability Report
Table of Contents

Graph and Table Symbols ....................................................................................................................................................... 6
   Performance Glance ........................................................................................................................................................... 6
   List of Symbols .................................................................................................................................................................... 6
DCF Service Structure.............................................................................................................................................................. 7
   Regions, Circuits, Counties, and CBC Lead Agencies........................................................................................................... 7
System Overview..................................................................................................................................................................... 8
System of Care ........................................................................................................................................................................ 9
Federal Child Welfare Indicators .......................................................................................................................................... 10
CBC Scorecard Measures ...................................................................................................................................................... 11
   Workload Trends............................................................................................................................................................... 12
       Reporting Method Trends ............................................................................................................................................. 12
       Seasonality of Hotline Workload .................................................................................................................................. 12
   Screening Trends............................................................................................................................................................... 13
       Alleged Maltreatment Screening .................................................................................................................................. 13
       Special Conditions Screening ........................................................................................................................................ 13
   Timeliness Trends ............................................................................................................................................................. 14
           Average and Maximum Times to Answer or Abandon ............................................................................................. 14
           Percent of Calls Abandoned ...................................................................................................................................... 15
           Average Handling Time Trend Stratification ............................................................................................................. 15
   Hotline Counselor Workforce ........................................................................................................................................... 16
       Monthly Separations for Abuse Counselors ................................................................................................................. 16
Child Protective Investigators ............................................................................................................................................... 17
   Workload Trends............................................................................................................................................................... 17
       Investigative Workload: Incoming, Active, and Backlog Investigations........................................................................ 17
       Maltreatment Investigations and Special Conditions Referrals ................................................................................... 18
       Special Conditions: Stratified by Type and by County .................................................................................................. 18
       Statewide: More Than 20 Active Investigations ........................................................................................................... 19
       Stratification More Than 20 Active investigations by DCF Circuit and Sheriff’s Office................................................. 19
       Active Investigations by Cohort .................................................................................................................................... 20
   Timeliness Trends ............................................................................................................................................................. 21
           Statewide: Alleged Child Victims Seen Within 24 Hours........................................................................................... 21
       Stratification Alleged Victims Seen Within 24 Hours by DCF Circuit and Sheriff’s Office ............................................. 21

      Office of Child Welfare-Performance and Quality Improvement                                                                                                  2|Page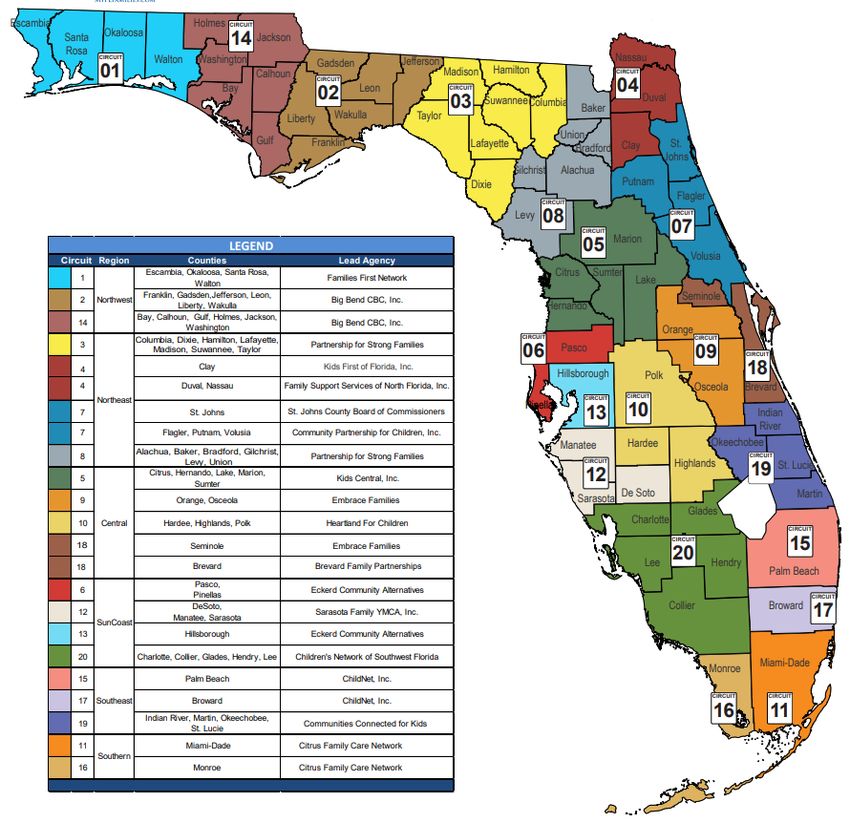
Statewide: Child Investigations Completed Within 60 Days ..................................................................................... 22
       Stratification Child Investigations Completed Within 60 Days by DCF Circuit and Sheriff’s Office .............................. 22
   Safety Determinations and Services Provided .................................................................................................................. 23
       Statewide: Children Determined Safe at Investigative Closure by Post Investigation Service ..................................... 23
       Stratification by CBC...................................................................................................................................................... 23
       Children Determined Unsafe at Investigative Closure by Post Investigation Service................................................... 24
       Stratification by CBC...................................................................................................................................................... 24
           Statewide Children with No Recurrence of Verified Maltreatment within 12 Months ............................................ 25
       CPI Workforce Monthly Separations............................................................................................................................. 26
       CPI Time in Classification .............................................................................................................................................. 26
Flow from CPI to CBC Lead Agencies .................................................................................................................................... 27
   Removals and Removal Rates ........................................................................................................................................... 27
       Statewide Trend ............................................................................................................................................................ 27
       ....................................................................................................................................................................................... 27
       Out-of-Home Care Entries Cumulative Count by SFY ................................................................................................... 27
       Quarterly Stratification by Circuit and Sheriff’s Office ................................................................................................. 28
       Quarterly Stratification by Circuit and CBC Lead Agency.............................................................................................. 28
Eligibility ................................................................................................................................................................................ 29
   Title IV-E Candidacy and Foster Care Eligibility ................................................................................................................. 29
       Percentage of Children in Living Arrangements who are Candidates .......................................................................... 29
       Percentage of Children that are Title IV-E Eligible ........................................................................................................ 29
Community-Based Care Lead Agencies................................................................................................................................. 30
   Caseload Indicators ........................................................................................................................................................... 30
       Statewide Trends in Case-Managed Services ............................................................................................................... 30
       Services Mix .................................................................................................................................................................. 30
       Entries and Discharges Compared to Out-of-Home Care Trend................................................................................... 31
       Placement Types Compared to Children in Out-of-Home Care Trend ......................................................................... 31
       Family Support Services “Prime” Counts ...................................................................................................................... 32
   Safety Indicators ............................................................................................................................................................... 33
           Child Safety Trends: Comparison of Two Indicators ................................................................................................. 33
       Child Safety After Termination of Case-Managed Services .......................................................................................... 33
       Child Safety After Termination of Family Support Services .......................................................................................... 34
           Child Safety in Out-of-Home Care ............................................................................................................................. 35
       Child Safety During Case-Managed In-Home Services .................................................................................................. 35
   Permanency Indicators ..................................................................................................................................................... 36
           Statewide Trend: Permanency Within 12 Months of Removal................................................................................. 36

      Office of Child Welfare-Performance and Quality Improvement                                                                                                         3|Page
Stratification by CBC Lead Agency ................................................................................................................................ 36
       Children Achieving Permanency Within 12 Months for Children in Care 12-23 Months ......................................... 37
   Stratification by CBC Lead Agency ................................................................................................................................ 37
   Stratification by CBC Lead Agency ................................................................................................................................ 38
   Percentage of Exits by Exit Type ................................................................................................................................... 39
   CBC Exit Counts and Average Length of Stay by All Exit Types ..................................................................................... 40
   CBC Exit Counts, Percentage of Exits, and Average Length of Stay by Reunification Exit Type ................................... 41
   CBC Exit Counts, Percentage of Exits, and Average Length of Stay by Guardianship Exit Type ................................... 42
   CBC Exit Counts, Percentage of Exits, and Average Length of Stay by Adoption Exit Type .......................................... 43
       Statewide Trend: Percent of Children Who Do Not Re-Enter Care within 12 Months of Achieving Permanency ... 44
   Stratification by CBC Lead Agency ................................................................................................................................ 44
Timeliness of Judicial Handling ......................................................................................................................................... 45
       Reunification Goal After 15 Months and No Termination of Parental Rights Activity.............................................. 45
   Timeliness of Termination of Parental Rights, from Petition to Order ......................................................................... 45
       Time from Removal Date to Disposition Order ......................................................................................................... 46
Maintaining Connections in Placement ............................................................................................................................ 47
       Statewide Trend: Placement Stability ....................................................................................................................... 47
   Stratification by CBC Lead Agency ................................................................................................................................ 47
       Statewide Trend: Placement of Sibling Groups Together ......................................................................................... 48
   Stratification by CBC Lead Agency ................................................................................................................................ 48
Proximity of Placement to Maintain Connections ............................................................................................................ 49
   Children Placed Outside Removal County .................................................................................................................... 49
   Children Placed Outside the Removal Circuit ............................................................................................................... 49
   Trends in Group and Residential Care by Age Report................................................................................................... 50
   Children in Group and Residential Care by Age Group: Ages 0-5 ................................................................................. 51
   Children in Group and Residential Care by Age Group: Ages 6-12 ............................................................................... 51
   Children in Group and Residential Care by Age Group: Ages 0-17 ............................................................................... 52
Prescribed Psychotropic Medications............................................................................................................................... 53
   Children in Out-of-Home Care with Prescribed Psychotropic Medications ................................................................. 53
   Children with Consent for Prescribed Psychotropic Medications ................................................................................ 53
Medical Services................................................................................................................................................................ 54
       Children Receiving Medical Services in Last Twelve Months .................................................................................... 54
Dental Services .................................................................................................................................................................. 54
       Children Receiving Dental Services in Last Seven Months ........................................................................................ 54
Education Program Enrollment......................................................................................................................................... 55
       Young Adults Aging Out Enrolled in Education Programs ......................................................................................... 55

   Office of Child Welfare-Performance and Quality Improvement                                                                                                 4|Page
Dually Served Youth .......................................................................................................................................................... 56
       Statewide Trend: Youths Served by CBC Lead Agencies and Juvenile Justice .............................................................. 56
       Stratification by CBC Lead Agency ................................................................................................................................ 56
   Missing Child ..................................................................................................................................................................... 57
       Average Number of Children Categorized as Missing from Care and Supervision ....................................................... 57
       Child Reports Entered in FSFN within One Working Day .............................................................................................. 57
       Resolution of reports within 3 days .............................................................................................................................. 58
   Human Trafficking ............................................................................................................................................................. 58
       Human Trafficking Intakes Trend .................................................................................................................................. 58
       Children with Indication of Human Trafficking by CBC Lead Agency ............................................................................ 59
   Florida CQI and CFSR ......................................................................................................................................................... 59
Child Care and Domestic Violence ........................................................................................................................................ 60
   Child Care Regulation ........................................................................................................................................................ 60
           Child Care Inspections per Month............................................................................................................................. 60
   Domestic Violence ............................................................................................................................................................ 60
           Percent Victims Leaving a Shelter with a Family Safety and Security Plan ............................................................... 60
Appendix ............................................................................................................................................................................... 61
       Percentage of Children in Living Arrangements who are Candidates .......................................................................... 63
       Percentage of Children that are Title IV-E Eligible ........................................................................................................ 63

      Office of Child Welfare-Performance and Quality Improvement                                                                                                    5|Page
Graph and Table Symbols
Performance Glance
Performance indicators have been added to the titles and table of contents to assist the reader in quickly determining
current performance in specific areas.

   Green dots before the titles indicate that either statewide/national targets are being met or for those measures
where a target is not applicable, the previous 3-month trend is either stable or moving in the right direction.

   Red dots before the titles indicate that either statewide/national targets are not being met or for those measures
where a target is not applicable, the previous 3-month trend is moving in the wrong direction.

List of Symbols

 M      Monthly
 Q      Quarterly
 A      Annually

        National Benchmark is included

     Office of Child Welfare-Performance and Quality Improvement                                          6|Page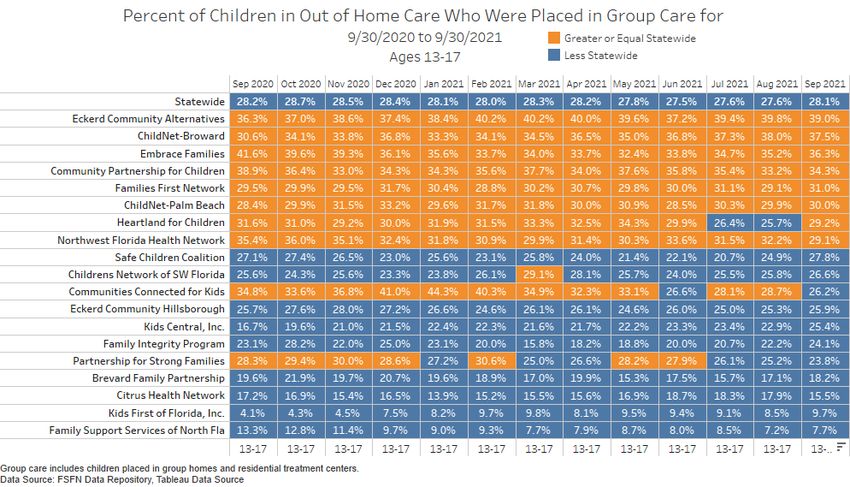
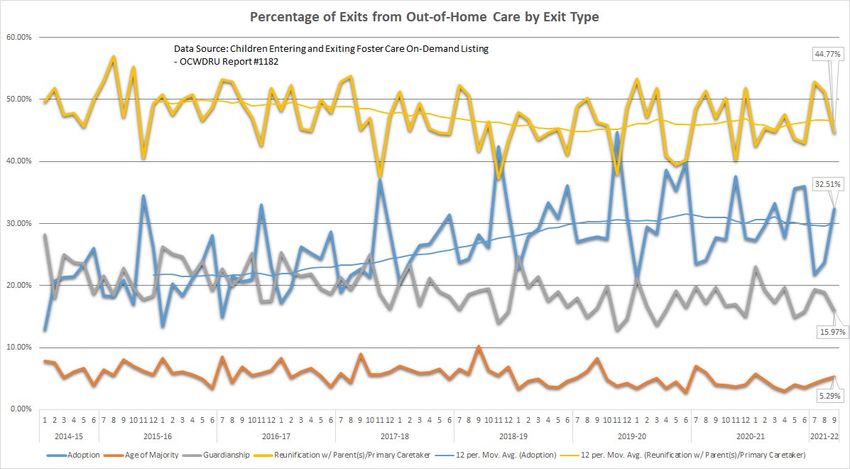
DCF Service Structure
Regions, Circuits, Counties, and CBC Lead Agencies

   Office of Child Welfare-Performance and Quality Improvement   7|Page
System Overview
Florida’s community-based child welfare system is comprised of a partnership between the Department of
Children and Families (DCF), other state agencies, the courts, law enforcement agencies, service providers,
and local communities.
There are over four million children in Florida of which most fortunately do not come to the attention of the
system. For those children who do enter the system, entry begins with reports of allegations of abuse or
neglect made to the Florida Abuse Hotline, operated by DCF. The Florida Abuse Hotline receives more than
320,000 child-related calls annually. Calls received are screened to determine if the criteria are met to initiate
a protective investigation.
If criteria are met, the report is referred to a local Child Protective Investigations (CPI). Statewide there are
over 200,000 protective investigations conducted annually. These investigations are conducted by DCF in 60
counties. In the remaining 7 counties, including Broward, Hillsborough, Manatee, Pasco, Pinellas, Seminole,
and Walton, county sheriff’s offices perform the investigations. Investigators determine the need for post-
investigation services, including protecting the child through removal and placement in out-of-home care or
through case-managed, in-home services (by court order or non-judicially), or through informal voluntary
family support services.
Florida statute requires that post-investigation services be provided through contracting with community-
based care lead agencies (CBCs). There are 17 Community-Based Care (CBC) lead agencies that each provide
coverage to specific geographic areas within the 20 Judicial Circuits in Florida. Several lead agencies cover
more than one geographic area and areas may include one or multiple counties. In two instances, the CBC lead
agency serves two geographic areas under separate contracts, lending to 19 lead agencies displayed within the
CBC tables of this report. Although services vary among CBC lead agencies, they have a shared role in
participating and ensuring safety, permanency, and well-being for all children in the state.
The monthly Child Welfare Key Indicators Report presents data for the Florida Abuse Hotline, Child Protective
Investigations, CBC lead agencies, as well as other key metrics describing the state of the Florida Child Welfare
System.

    Office of Child Welfare-Performance and Quality Improvement                                       8|Page
System of Care

Data Sources; Florida Abuse Hotline Summary Report and Children and Young Adults Receiving Services by CBC Lead Agency and Type of Service

   Office of Child Welfare-Performance and Quality Improvement                                                                               9|Page
Federal Child Welfare Indicators
                          Federal Child Welfare Indicators
                                     Statewide
                                      Quarter 4 SFY 2019-2020
                                             (4/1/20 to 6/30/20)
                                              through
                                      Quarter 1 SFY 2021-2022
                                              (7/1/21-9/30/21)

                                                 Source: Federal Child Welfare Indicator Dashboard
                                                 https://www.myflfamilies.com/programs/childwelfare/dashboard/overview.shtml

Florida Abuse Hotline

 Office of Child Welfare-Performance and Quality Improvement                                                    10 | P a g e
CBC Scorecard Measures
CBC Scorecard Indicators
Quarter 1 SFY 2021-2022
Some of the above CBC scorecard measures are calculated based on quarterly performance for trending purposes. The
performance in this chart may not align with performance displayed on the CBC Scorecard dashboard for all measures
due to the dashboard utilizing a 12-month rolling average on several measures. Measures pulled from the Dashboard
are indicated with an asterisk.
Office of Child Welfare-Performance and Quality Improvement 11 | P a g eWorkload Trends
Reporting Method Trends M
The Florida Abuse Hotline offers a variety of methods for citizens to report concerns about children and vulnerable
adults. A modification was made within the system, resulting in the tracking of webs and faxes together. Webs were
previously represented by the green line within the graph below, however beginning in March 2017, webs were
combined with faxes, now represented by the red line.
Seasonality of Hotline Workload M
There were 55,315 total contacts offered for the month of September. “Contacts Offered” include those abandoned by a
caller who called back, so both attempts and completed calls from the same individual may be counted.
Office of Child Welfare-Performance and Quality Improvement 12 | P a g eScreening Trends
M
Alleged Maltreatment Screening
Total child maltreatment contacts for September 2021 were 26,359. In September 2021, 62.5% of child maltreatment
allegations reported were screened-in.
M
Special Conditions Screening
There were 1,864 screened-in special conditions for September 2021 with an increase of 21% for all special conditions’
screenings. The screen-in percentage for special conditions is at 64.5%. The number of accepted intakes continues to
fluctuate according to the seasonal patterns.
Office of Child Welfare-Performance and Quality Improvement 13 | P a g eCrime Intelligence Unit
M
The chart below contains Crime Intelligence Unit counts for planned placements, emergency placements, additionals,
rechecks, and initials. The CIU average time to completion on all background check types are within compliance of DCF
standards.
Timeliness Trends
M
Average and Maximum Times to Answer or Abandon
The average wait time before answer is 22 minute 04 seconds. 33% of calls were answered in 10 minutes or less, which
meets the 98% state target.
Office of Child Welfare-Performance and Quality Improvement 14 | P a g eM
Percent of Calls Abandoned
The percent of calls to the Florida Abuse Hotline English Line that are abandoned before answer is 39.4% for September
2021, and the percent of Spanish Line abandoned calls is 34.7%.
M
Average Handling Time Trend Stratification
The Average Handling Time (AHT) for September is 33 mins 04 secs which meets the 34-37 min AHT Hotline target.
Automated Calls Distribution (ACD) remains in the 12-13 mins range and After-Call Work (ACW) remains around 19-22
mins.
Office of Child Welfare-Performance and Quality Improvement 15 | P a g eHotline Counselor Workforce M
Monthly Separations for Abuse Counselors
Abuse Registry Counselor separations were 3 for September.
Office of Child Welfare-Performance and Quality Improvement 16 | P a g eChild Protective Investigators
Workload Trends M
Investigative Workload: Incoming, Active, and Backlog Investigations
On the trend level, accepted child abuse intakes and open active investigation increased in September. On a year-over-
year basis, accepted child abuse intakes-all types and special conditions were down 337 (2.0%) from the prior
September. Total intakes for September 2021 (17,773) were down when compared with September 2019 (19,123).
Active investigations as of September 30, 2021 were up 2,104 (5.2%) from the prior September while September 30,
2021 (18,630) open investigations were lower than September 20, 2019 (18,975). Active Investigative caseload open
more than 60 days as of September 30, 2021 increased to 483 (2.6% of all active investigations).
M
Investigative Workload: Backlog Stratified by Region
After experiencing of a decline over the last several years the percentage of active investigations that were in backlog
has increased significantly.
Office of Child Welfare-Performance and Quality Improvement 17 | P a g eMaltreatment Investigations and Special Conditions Referrals M
On a year-over-year basis both Alleged Maltreatment Investigations were down 4.7% and Special Condition Referrals
were up 31.7.% when compared with September 2020.
Special Conditions: Stratified by Type and by County M
There continues to be fluctuation of Child-on-Child intakes for September 2021 while all other special conditions type
remain steady.
Office of Child Welfare-Performance and Quality Improvement 18 | P a g eStatewide: More Than 20 Active Investigations Q
The percentage of investigators, DCF and SO areas combined, that were carrying more than 20 active investigations as of
September 30, 2021 increased to 12.25% of the active child investigative workforce.
Stratification More Than 20 Active investigations by DCF Circuit and Sheriff’s Office Q
Four areas, Broward SO (53.25%), DCF-Circuit 20 (36.84%), Hillsborough SO (27.52%), and Pasco SO (24.14%) had over
20% of their active work force carrying 21+ active investigation as of September 30, 2021.
Office of Child Welfare-Performance and Quality Improvement 19 | P a g eActive Investigations by Cohort M
There has been shift towards higher active caseloads within the DCF investigative system over the past several months.
The percentage of DCF investigators carrying more than 21 active investigations as of the end of September 2021 was
105/1,246 (8.4%).
Office of Child Welfare-Performance and Quality Improvement 20 | P a g eTimeliness Trends
M
Statewide: Alleged Child Victims Seen Within 24 Hours
This metric appears to have stabilized at a point that is well above the DCF target of 90.0%
Stratification Alleged Victims Seen Within 24 Hours by DCF Circuit and Sheriff’s Office M
Only four investigative areas failed to reach the target for this measure in September.
Office of Child Welfare-Performance and Quality Improvement 21 | P a g eStatewide: Child Investigations Completed Within 60 Days M
The statewide average for closed investigations completed within 60 days was 97.96% for September.
Stratification Child Investigations Completed Within 60 Days by DCF Circuit and Sheriff’s Office M
Twelve of the twenty-six investigative areas met the 99.0% standard for completing investigations within 60-days. DCF
Circuit 1, DCF Circuit 2, DCF Circuit 4-Duval & Nassau, DCF Circuit 12-DeSoto & Sarasota, DCF Circuit 14, DCF, Circuit 20,
Seminole SO, and Hillsborough SO are the areas of the state that have consistently failed to meet the DCF target of 99%.
Office of Child Welfare-Performance and Quality Improvement 22 | P a g eSafety Determinations and Services Provided M
Statewide: Children Determined Safe at Investigative Closure by Post Investigation Service
This chart looks at all children with a safety determination of ‘safe’ in investigations closed during the month and shows
what post investigation service (if any) the child is receiving. Due to the overwhelming percentage of children closing
safe who do not receive post investigation services the “no services” percentage is displayed on a secondary (right) axis
as an area chart.
Data Source: Child Welfare Dashboard Post Investigation Services that Align with Safety Determination
Stratification by CBC M
There is great variation between CBCs for service provision for safe children, with some CBCs providing services to over
15% of the safe population in closed investigations, and others providing services to less than 10%.
Data Source: Child Welfare Dashboard Post Investigation Services that Align with Safety Determination
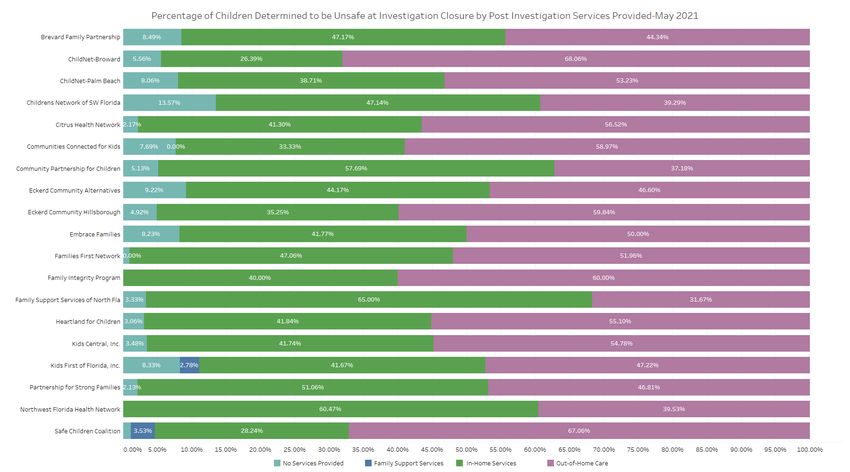
Office of Child Welfare-Performance and Quality Improvement 23 | P a g eChildren Determined Unsafe at Investigative Closure by Post Investigation Service M
This chart looks at all children with a safety determination of ‘unsafe’ in investigations closed during the month
and shows what post investigation service (if any) the child is receiving. In home services for children determined to be
unsafe at investigation closures have generally increased, while out-of-home services have generally decreased.
Data Source: Child Welfare Dashboard Post Investigation Services that Align with Safety Determination
Stratification by CBC M
There is great variation between CBCs for service provision for unsafe children. ChildNet- Broward and Safe
Children Coalition had the highest percentages of unsafe children entering out-of-home care in May 2021, while
Children’s Network of SW Florida provided no services to over 13% of their unsafe children.
Data Source: Child Welfare Dashboard Post Investigation Services that Align with Safety Determination
Office of Child Welfare-Performance and Quality Improvement 24 | P a g eM
Statewide Children with No Recurrence of Verified Maltreatment within 12 Months
Statewide performance for this measure has been at, or above, the federal standard of 90.9% since July 2016.
Stratification by DCF Circuit and Sheriff’s Office M
Only seven investigative areas failed to reach the 90.9% target in September. There generally is no discernable pattern
that indicates ongoing poor performance within any area of the state.
Office of Child Welfare-Performance and Quality Improvement 25 | P a g eM
CPI Workforce Monthly Separations
The number of Child Protective Investigators that separated from the department in September remained high.
CPI Time in Classification M
The percentage of CPI positions that are vacant or the CPI has been within their current position for less than six months
was 38.4%. This means that at a minimum, slightly less than one-third of CPIs are not currently available for full
rotation. Also note that 46.8% of CPI positions currently vacant or have under one year of experience.
Office of Child Welfare-Performance and Quality Improvement 26 | P a g eFlow from CPI to CBC Lead Agencies
Removals and Removal Rates
Statewide Trend M
The total count of children within closed investigations that were removed decreased in September while the removal
rate for victims within closed investigations decreased to 5.6.
M
Out-of-Home Care Entries Cumulative Count by SFY
The cumulative count of out-of-home care entries as of September of SFY 2021-22 were 3,247. This is the near lowest
observed out-of-home care entry total for the last five and ten SFYs.
Office of Child Welfare-Performance and Quality Improvement 27 | P a g eQuarterly Stratification by Circuit and Sheriff’s Office Q
There remains wide variation among circuits and sheriff’s offices on this indicator. Removal rates range from 1.87 to
14.22 per 100 alleged victims.
*Sep 2017 - Measure changed from per 100 children investigated to per 100 Alleged Victims.
Q
Quarterly Stratification by Circuit and CBC Lead Agency
*Sep 2017 - Measure changed from per 100 children investigated to per 100 Alleged Victims.
Office of Child Welfare-Performance and Quality Improvement 28 | P a g eEligibility
Title IV-E Candidacy and Foster Care Eligibility Q
Percentage of Children in Living Arrangements who are Candidates
All CBCs continue to do well in traditional candidacy.
Percentage of Children that are Title IV-E Eligible Q
IV-E Eligibility rates are updated monthly for every month being displayed.
Office of Child Welfare-Performance and Quality Improvement 29 | P a g eCommunity-Based Care Lead Agencies
Caseload Indicators M
Statewide Trends in Case-Managed Services
There were 22,554 children in out-of-home (OHC) care on September 30, 2021. This was consistent with the general
trend for OHC numbers, which has been in place since the fall of 2017. The trend for children receiving in-home services
remained relatively flat to declining at 10,149 children receiving in-home services on September 30, 2021.
Services Mix M
There continues to be variation among circuits regarding in-home and out-of-home care services, with the widest
variation occurring in the use of Family Support Services.
Office of Child Welfare-Performance and Quality Improvement 30 | P a g eM
Entries and Discharges Compared to Out-of-Home Care Trend
The number of out-of-home care entries was stable at 1,071 in September, while discharges decreased to 806.
Discharge data can lag in FSFN so the most recent numbers should be considered draft data for estimation purposes
only. The number of children in out-of-home care as of the last day of the month increased to 22,554.
Placement Types Compared to Children in Out-of-Home Care Trend M
As of September 30, 2021, there were 22,332 children in out-of-home care with 6,143 in relative care placement, 11,676
in a licensed family foster home, 2,126 in non-relative care, 1,522 in licensed group care, and 885 in other placements.
Office of Child Welfare-Performance and Quality Improvement 31 | P a g eM
Family Support Services “Prime” Counts
This measure shows the number of children in investigations closed during the quarter who met all “FSS Prime” criteria
of: 1) being deemed safe; 2) being high or very high risk, 3) having a Family Support Services module opened within 45
days of investigative closure, and 4) having an attempted or completed face-to-face contact within 45 days of
investigative closure. Data is lagged to allow note entry and Family Support Services module creation.
*NOTE: This measure was changed to count face-to-face contact with a child or a parent. The last 12 months of data are rerun each
month to allow for data entry.
Office of Child Welfare-Performance and Quality Improvement 32 | P a g eSafety Indicators
Q
Child Safety Trends: Comparison of Two Indicators
Children continue to be safer after termination of services:
• The percent of children with no verified maltreatment within six months after termination of case-managed
services was 96.11% for October to December 2020. The state continues to exceed the 95% target for this
measure.
• The percent of children with no verified maltreatment within six months of termination of Family Support
Services was 94.7% for those terminating October to December 2020. This measure does not have a set target.
Child Safety After Termination of Case-Managed Services Q
Statewide performance for services terminated in October to December 2020 decreased from 96.20% to 96.11% and all
but three of the lead agencies were above the 95% target.
Office of Child Welfare-Performance and Quality Improvement 33 | P a g eChild Safety After Termination of Family Support Services
Statewide performance for safety after termination of family support services performance in October to December
2020 increased to 94.7%. This measure does not have a specified target. Q
Office of Child Welfare-Performance and Quality Improvement 34 | P a g eChild Safety in Out-of-Home Care Q
This measure is generated by taking the total number of reports with at least one verified maltreatment and dividing it
by the total number of days in foster care for all children, with the result multiplied by 100,000 to calculate the rate of
victimization per 100,000 days in foster care. The data for this quarter shows only four lead agencies failed to meet the
standard. Statewide performance has continued to improve over the past four quarters exceeding the national standard
of 8.50 or less.
Child Safety During Case-Managed In-Home Services Q
This measure is generated by taking the total number of days the child received service and dividing by the number of
verified maltreatment reports during the report period. This is a rolling 12 months ending 3 months prior to the end of
the quarter. Statewide performance for the quarter ending September 2021 was 95.46%, and all but six lead agencies
met or exceeded the 95% target.
Note: The data in this table has been updated to match the Child Welfare Dashboards for this measure. Each quarter of data reflects a rolling
twelve (12) month period ending three (3) months prior to the end of the state fiscal quarter.
Office of Child Welfare-Performance and Quality Improvement 35 | P a g ePermanency Indicators
Q
Statewide Trend: Permanency Within 12 Months of Removal
Permanency within 12 Months of Removal is our primary indicator of timely permanency. Statewide performance
increased from 32.30% to 33.90 for July to September 2020 removals, which remains below the 40.5% national
standard.
Stratification by CBC Lead Agency Q
Only five of the lead agencies exceeded the national standard of 40.5%.
Office of Child Welfare-Performance and Quality Improvement 36 | P a g eChildren Achieving Permanency Within 12 Months for Children in Care 12-23 Months Q
With 47.50% of children achieving permanency within 12 months for children in foster care 12-23 months, Florida
continues to exceed the national standard of 43.6%.
Stratification by CBC Lead Agency
Statewide performance continues to exceed the national average with all but six CBCs exceeding standard. Q
Office of Child Welfare-Performance and Quality Improvement 37 | P a g eChildren Achieving Permanency Within 12 Months for Children in Care 24+ Months Q
With 41.77% of children achieving permanency within 12 months for children in foster care 24+ months, Florida
continues to exceed the national standard of 30.3%.
Stratification by CBC Lead Agency Q
Statewide performance is 41.77% and all but one CBC exceeded the 30.3% national standard.
Office of Child Welfare-Performance and Quality Improvement 38 | P a g eQ
Length of Stay for Children Exiting Care by Exit Type
Length of stay for children that exited out-of-home care has been steadily increasing and six months longer than it was
in January 2014. On average, time in care for children exiting care to reunification, guardianship, and adoption have all
increased since January 2014.
Percentage of Exits by Exit Type Q
The percentage of children exiting out-of-home care to reunification had been declining since January 2014 before
stabilizing SFY 2019-20. The proportion of children exiting to adoption had been increasing before stabilizing in SFY
2019-20.
Office of Child Welfare-Performance and Quality Improvement 39 | P a g eQ
CBC Exit Counts and Average Length of Stay by All Exit Types
The table below shows the number of exits from out-of-home care since SFY 2014-15. Note the uptick in time to exit in
SFY 2016-17.
Office of Child Welfare-Performance and Quality Improvement 40 | P a g eQ
CBC Exit Counts, Percentage of Exits, and Average Length of Stay by Reunification Exit Type
The table below shows that the proportion of exits from out-of-home care to reunification began to decline in SFY 2017-
18 while average duration for exits to reunification began to increase in SFY 2015-16. Time to exit to reunification has
been increasing over the last seven SFYs.
Office of Child Welfare-Performance and Quality Improvement 41 | P a g eQ
CBC Exit Counts, Percentage of Exits, and Average Length of Stay by Guardianship Exit Type
The table below shows that there has been an ongoing decline in the number of children exiting to guardianship over
the course of the last five SFYs. At the same time, average duration for exits to guardianship has been increasing.
Office of Child Welfare-Performance and Quality Improvement 42 | P a g eCBC Exit Counts, Percentage of Exits, and Average Length of Stay by Adoption Exit Type Q
The table below shows that exits from out-of-home care to adoption began to increase in total percentage and in
average duration in SFY 2016-17. Average time to exit by adoption was consistently in the 28-month range for SFY 2019-
20 and has increased to around 30.00 months for SFY 2020-21.
Office of Child Welfare-Performance and Quality Improvement 43 | P a g eStatewide Trend: Percent of Children Who Do Not Re-Enter Care within 12 Months of Q
Achieving Permanency
Statewide performance for the most recent available quarter increased from 88.67% to 89.23%, which is still below the
national standard of 91.7%.
Stratification by CBC Lead Agency Q
Only five of 19 CBCs met or exceeded the national standard of 91.7%.
Office of Child Welfare-Performance and Quality Improvement 44 | P a g eTimeliness of Judicial Handling M
These Children’s Legal Services indicators are directly related to the indicators of timely permanency.
Reunification Goal After 15 Months and No Termination of Parental Rights Activity
The statewide average for this metric as of September 2021 was 6.3%. Circuit goals are set for each period after review
of baseline information.
M
Timeliness of Termination of Parental Rights, from Petition to Order
The statewide average for this metric as of September 2021 was 181 days. Circuit goals are set for each period after
review of baseline information.
Office of Child Welfare-Performance and Quality Improvement 45 | P a g eTime from Removal Date to Disposition Order M
The statewide target of 90 days for the aggregate data for SFY 2021-22 was met by all but three circuits.
Office of Child Welfare-Performance and Quality Improvement 46 | P a g eMaintaining Connections in Placement
Q
Statewide Trend: Placement Stability
Statewide performance has drastically improved from the past years but recently trending upward to 4.45, falling below
the national standard of 4.12 moves.
Stratification by CBC Lead Agency Q
Statewide performance increased to 4.45 moves per 1,000 days in foster care, falling below the national standard of
4.12 moves. There is wide variation among the lead agencies, with all but eight meeting the standard.
Office of Child Welfare-Performance and Quality Improvement 47 | P a g eStatewide Trend: Placement of Sibling Groups Together Q
Statewide performance has been on a steady decline since 2016. Statewide performance has remained below target for
two state fiscal years with current performance at 64.70% for September 30, 2021.
Stratification by CBC Lead Agency Q
Statewide performance is at 64.70%, which is below the 65% statewide target, but has been trending upwards. Nine
lead agencies were above the target as of September 30, 2021.
Office of Child Welfare-Performance and Quality Improvement 48 | P a g eProximity of Placement to Maintain Connections
Children Placed Outside Removal County Q
As of September 30, 2021, 33.72% of children statewide are currently placed outside of their removal county, but there
is wide variation across CBCs. This measure does not have a specified target.
Children Placed Outside the Removal Circuit Q
As of September 30, 2021, 17.75% of children statewide were placed outside of their removal circuit. This measure does
not have a specified target.
Office of Child Welfare-Performance and Quality Improvement 49 | P a g ePlacement in Family Settings
M
Trends in Group and Residential Care by Age Report
The number of children placed in group homes and residential treatment facilities as of the last day of the month has
been declining since August 2017.
Good
Office of Child Welfare-Performance and Quality Improvement 50 | P a g eChildren in Group and Residential Care by Age Group: Ages 0-5 M
In the following four Tableau views, the percentages reflect the number of children in out of home care who were
placed in group care by CBC lead agency. For children age 0-5, the overall percentage of children placed in group and
residential care has declined during the 2021-2022 fiscal year.
Good
Children in Group and Residential Care by Age Group: Ages 6-12 M
For children age 6-12 in group and residential care the statewide percentage has been trending downward during the
2021-2022 fiscal year.
Good
Office of Child Welfare-Performance and Quality Improvement 51 | P a g eChildren in Group and Residential Care by Age Group: Ages 13-17 M
For children age 13-17 in group and residential care there are eight CBCs above the statewide percentage in September
2021.
Good
Children in Group and Residential Care by Age Group: Ages 0-17 M
For children ages 0-17, the statewide count of children in group care has gradually decreased during the 2021-2022 fiscal
year.
Good
Office of Child Welfare-Performance and Quality Improvement 52 | P a g ePrescribed Psychotropic Medications
Children in Out-of-Home Care with Prescribed Psychotropic Medications M
The statewide percentage of children in out-of-home care that are prescribed at least one psychotropic medication on
September 30, 2021 was 11.0%. This is consistent with past observations for this metric.
Children with Consent for Prescribed Psychotropic Medications M
In order to administer psychotropic medication to a foster child, parental consent or a court order must be obtained,
unless the child is receiving inpatient services, or a physician certifies that delay would be likely to harm the child. On
September 30, 2021, the statewide percentage of children with at least one prescribed psychotropic medication where
consent was obtained was 98.2% and eight CBCs were at 100%. This is consistent with past observations for this
measure.
Office of Child Welfare-Performance and Quality Improvement 53 | P a g eMedical Services
Q
Children Receiving Medical Services in Last Twelve Months
The statewide percentage of children receiving recent medical services has declined below the statewide standard to
93.45% as of September 30, 2021. All but ten CBCs met the standard.
Dental Services
Q
Children Receiving Dental Services in Last Seven Months
The statewide percentage of children receiving recent dental services decreased to 84.92% as of September 30, 2021,
still below the statewide standard. Only three of the CBCs met or exceeded the standard.
Office of Child Welfare-Performance and Quality Improvement 54 | P a g eEducation Program Enrollment
Q
Young Adults Aging Out Enrolled in Education Programs
This is one indicator of preparation for adulthood but does not control for any of the many variables that influence this
preparation, including time in care and the child’s educational level when entering care. Statewide performance in this
measure has been relatively stable and above the statewide target for the past 3 years. Youth are only included in this
measure if they age out at age 18, if a youth chooses to remain in Extended Foster Care, they are not included in either
the numerator or the denominator for this measure. Because of this change, the denominator of youth in this measure
has been steadily declining and several CBC Lead Agencies have no youth in the measure at all, as evidenced by the
blank cells. This has also impacted the statewide performance with the dwindling number of youths included in the
measure.
Office of Child Welfare-Performance and Quality Improvement 55 | P a g eDually Served Youth
M
Statewide Trend: Youths Served by CBC Lead Agencies and Juvenile Justice
The number of youths served by both the child welfare system and the juvenile justice system in September 2021 was
750. This measure does not have a specified target.
Stratification by CBC Lead Agency M
The number of youths served by both systems (DCF and DJJ) is variable among the lead agencies but is related to the
total number of youths served by each lead agency.
Office of Child Welfare-Performance and Quality Improvement 56 | P a g eMissing Child
M
Average Number of Children Categorized as Missing from Care and Supervision
In September 2021 the average number and percentage of children categorized as missing from the care or supervision
of the state declined.
Child Reports Entered in FSFN within One Working Day M
Statewide performance for this metric was 91.3% in September. This is constant for this metric.
Office of Child Welfare-Performance and Quality Improvement 57 | P a g eResolution of reports within 3 days M
The percentage of missing child entries that were resolved within 3 days was stable at 71.3% in September.
Human Trafficking
M
Human Trafficking Intakes Trend
The number of Human Trafficking Reports (Initial and Additional) accepted by the Hotline appear to have entered a
seasonal cycle while the percentage of human trafficking allegations that are closed as verified, not substantiated, or no
indicators have also stabilized.
Office of Child Welfare-Performance and Quality Improvement 58 | P a g eChildren with Indication of Human Trafficking by CBC Lead Agency M
The number of children in out-of-home care or receiving in-home services with at least one FSFN indicator of being a
victim of Human Trafficking remains concentrated within DCF Circuit 1 and Florida’s central and southern urban centers.
Q
Florida CQI and CFSR
The following table provides statewide and lead agency outcome ratings from FL CQI and CFSR data around Safety,
Permanency, and Well-being.
Office of Child Welfare-Performance and Quality Improvement 59 | P a g eChild Care and Domestic Violence
Child Care Regulation
Child Care Inspections per Month M
In May 2021, there were 100% of home inspections and 99.7% of facility inspections completed within 45 days.
Domestic Violence
Percent Victims Leaving a Shelter with a Family Safety and Security Plan M
The percent of adult victims leaving a shelter after 72 hours with a Family Safety and Security Plan in April 2020 was
100%, continuing to exceed the target of 97%.
Office of Child Welfare-Performance and Quality Improvement 60 | P a g eAppendix
Analytical
Business Page
Section Process Chart Source Algorithm
Owner No.
Owner
Florida Abuse
Hotline
System of Hans Florida Child Protection Summary report Total count annual of screened-in and screened-
9
Care Soder System Overview and Young out and child services counts
Adults Receiving
Services report
Federal
Child Robin Federal Child Welfare Child Welfare
10 Dashboard Data
Welfare Preston Indicators Statewide Dashboard
Indicators
Child Welfare
CBC
Robin Dashboard and
Scorecard Preston
CBC Scorecard Indicators 11 Dashboard Data and OCWDRU Quarterly Reports
Quarterly
Measures
Reports
English offered (Avaya) + Spanish offered (Avaya)
Director
Makisha Hotline Total Contacts and + fax (Avaya) + web (was CRM, but now should
Hotline Davis
of the 12 Avaya just be Avaya) = total contacts (at the top of the
Hotline Trends in Reporting Methods
summary data excel file)
Sum of [English offered (Avaya) + Spanish offered
Director
Makisha (Avaya) + fax (Avaya) + web (was CRM, but now
Hotline Davis
of the Seasonality 12 Avaya should just be Avaya) = total contacts (at the top
Hotline
of the summary data excel file)]
Child Maltreatment
Director Total count monthly of screened-in and screened-
Makisha Allegations: Total, Screened-
Hotline Davis
of the 13 FSFN out; Sum of both screened-in and screened-out
Hotline In, Screened-Out, and divided by individual count
Percentage Screened-In
Director Special Conditions: Total, Total count monthly of screened-in and screened-
Makisha
Hotline of the Screened-in, Screened-out, 13 FSFN out; Sum of both screened-in and screened-out
Davis
Hotline and Percentage Screened-In divided by individual count
Crime Intelligence Unit
Director Counts of planned Hotline Total count monthly of planned placements,
Makisha
Hotline Davis
of the placements, emergency 14 Summary emergency placements, additionals, rechecks, and
Hotline placements, additionals, Report initials
rechecks, and initials
Average Time to Answer or
Director
Makisha Abandon English Line Only, Calculate total number of calls over 10 minutes
Hotline Davis
of the 14 Avaya and calculate percentage
Hotline Percentage of Calls Answered
within 10 minutes
Director Percent of Calls Abandoned
Makisha
Hotline Davis
of the Before Answer: English and 15 Avaya Avaya report
Hotline Spanish
Average Handling Time
Director
Makisha Stratified by Average Talk
Hotline Davis
of the 15 Verint Verint Report
Hotline Time and Average After-Call
Work Time
Director
Hans
Hotline of the Hotline Separations 16 HR Data Count of total separations
Soder
Hotline
Child Welfare
Asst. Dashboard,
Sec. of SW Workload Trend: Child Welfare
Hans
CPI Soder
Operatio Incoming, Active and Backlog 16 Trend, Child Count Number of Incoming, Active, and Backlog
ns / (Active > 60 Days) Intakes
RMD Received and
OCWDRU #1279
Office of Child Welfare-Performance and Quality Improvement 61 | P a g eYou can also read