Climate Change Risks in Auckland - Knowledge Auckland
←
→
Page content transcription
If your browser does not render page correctly, please read the page content below
Climate
Change
Risks in
Auckland

                                                    BC5983

                                                1
AUCKLAND COUNCIL TECHNICAL REPORT, TR2019/019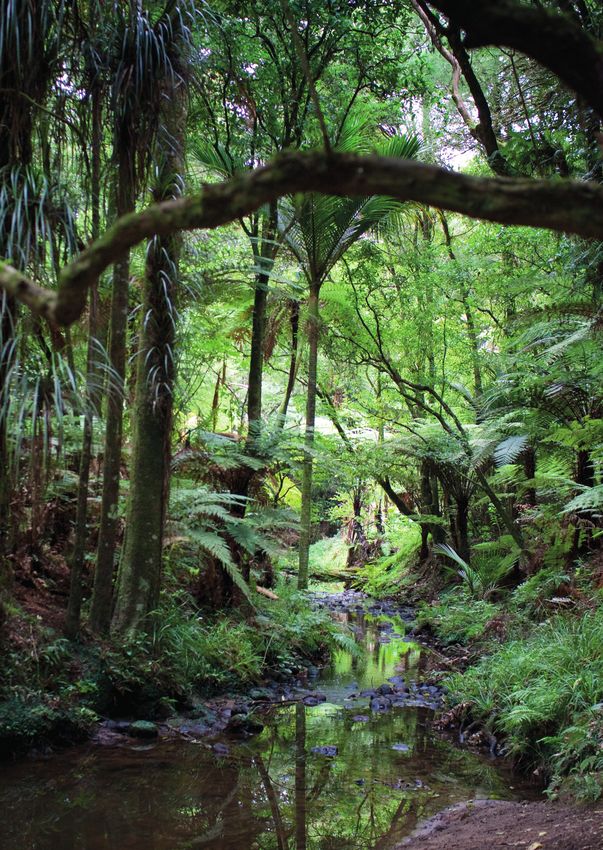
© 2019 Auckland Council

    Auckland Council technical report,
    TR2019/019

    ISSN 2230-4525 PRINT
    ISSN 2230-4533 ONLINE
    ISBN 978-1-98-858958-9 PRINT
    ISBN 978-1-98-858959-6 PDF
2   Prepared for Auckland Council by Arup.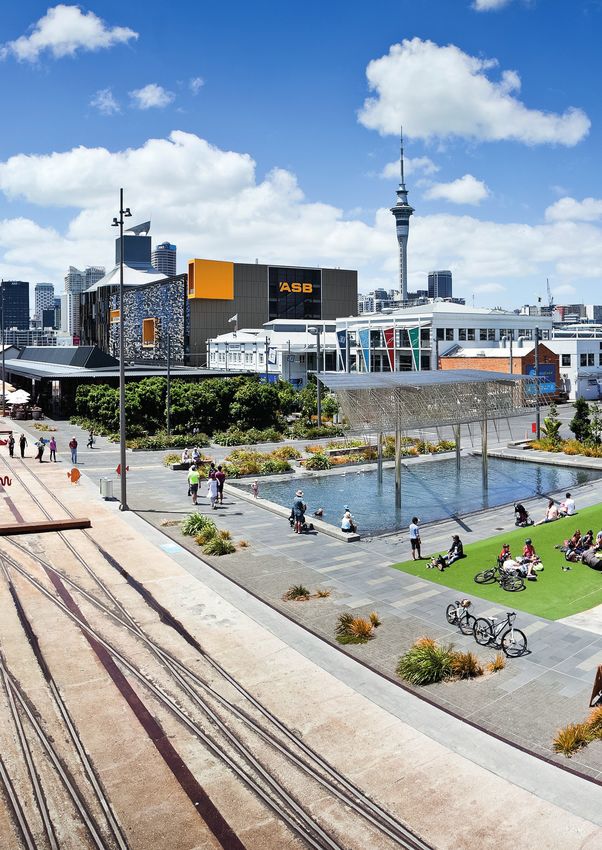
Executive
Summary

Auckland is being      In response to the threat of         Climate change in Auckland
                       climate change, Auckland Council     The National Institute of Water
impacted by            has committed to facilitating        and Atmospheric Research climate
climate change and     the development of Auckland’s        projections (Pearce et al., 2018)
projections indicate   Climate Action Plan. It will steer   provide Auckland with the most
                       the region on a path toward          robust, localised information on
that impacts will      rapidly reducing greenhouse gas      the anticipated changes in climate
intensify over the     emissions and to prepare the city    for the region and is available
                       for the impacts of a changing
next century.          climate. This is in line with the
                                                            on Knowledge Auckland. The
                                                            anticipated changes in the climate
Action is required     2015 Paris Agreement to limit        in Auckland are changes in sea
to anticipate the      global warming to 1.5°C.             level rise, temperature, rainfall,
effects and adapt to   As part of developing the
                                                            storm events, wind and humidity.

a changing climate.    evidence-base for the action plan,   Climate Change Risk
                       Auckland Council’s Research and      Assessment
                       Evaluation Unit has produced a
                                                            The Climate Change Risk
                       Climate Change Risk Assessment
                                                            Assessment technical report
                       technical report series. This
                                                            series were undertaken using
                       assessment aims to provide
                                                            the Intergovernmental Panel on
                       information about the risks the
                                                            Climate Change methodology
                       Auckland Region may face and its
                                                            (IPCC, 2014) to assess impacts
                       impacts on people, society and
                                                            on people, the environment
                       the environment. This research
                                                            and infrastructure. The purpose
                       is underpinned by the Auckland
                                                            was to identify which parts of
                       Region climate change projections
                                                            Auckland are the most susceptible
                       and impacts research undertaken
                                                            to impacts of climate change and
                       by the National Institute of
                                                            also the social and environmental
                       Water and Atmospheric Research
                                                            vulnerability. This is understood
                       (Pearce et al., 2018).
                                                            by evaluating the adaptive
                       This document summarises             capacity of areas to impacts of
                       the research, key findings and       climate change.
                       considerations from the risk
                       assessment to contribute to
                       the development of Auckland’s
                       Climate Action Plan.
                                                                                                 3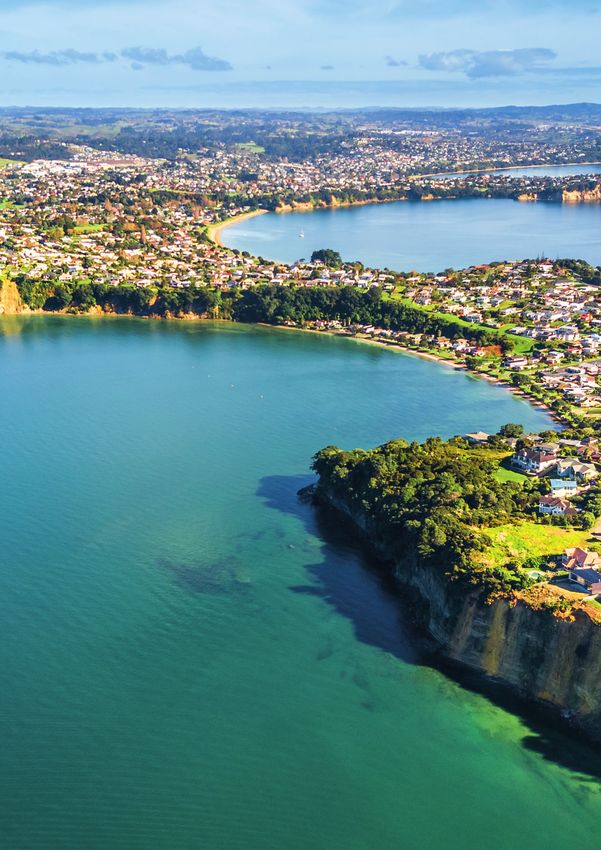
E X EC U T I V E S U M M A RY

         Key findings                                The ability of people and households
                                                     to adapt and respond to the effects of
         Combining the impacts                       climate change is dependent on many factors.
         of climate change with                      • Where people live, their socio-economic
                                                       circumstance, their support networks, their
         relative vulnerability across                 occupations and their ability to have options can
         Auckland suggests that:                       impact their vulnerability.
                                                     • Children and older people will be more vulnerable
                                                       than others to some effects, especially related to
                                                       poor air quality.
                                                     • There is some evidence that Māori and Pacific
                                                       peoples may be more affected than others to some
                                                       effects, due to their generally younger age structures
                                                       as well as other factors.

                         Sea level rise could
         put infrastructure and ecosystems
         at risk while flooding poses
         direct and indirect risks to people,                   The changing climate will create
         infrastructure and services.                           an environment that allows water
                                                                and vector-borne diseases to thrive,
                                                                which will affect people
                                                                and ecosystems.

         Terrestrial, marine and freshwater ecosystems
         are at risk and face a combination of stressors.
         The most vulnerable species are those
         that have limited capacity to migrate                  Changes to these ecosystems are likely
         and those that will experience a                       to impact on human wellbeing and the
         ‘coastal squeeze’.                                     economy.

4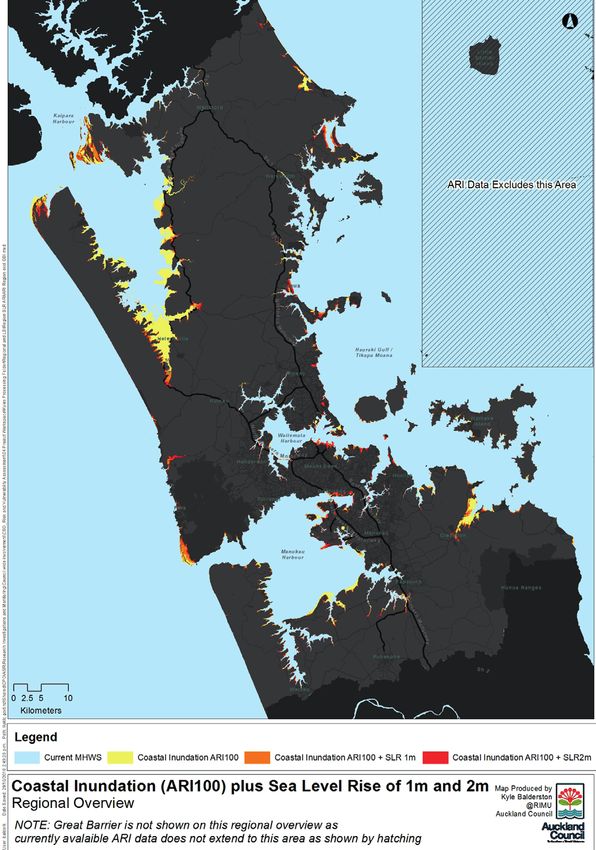
Informing Auckland’s                  It is worth remembering that          vary. Risks will continue to emerge
Climate Action Plan                   climate change is not happening in    due to the multiple stressors.
The Climate Change Risk               isolation and not just in Auckland.   Continual re-evaluation will need
Assessment identifies areas,          Rapid population growth, land         to be undertaken as more data
sectors and communities at            use changes, pollution and human      become available.
greatest risk from climate impacts.   induced stressors will compound
                                                                            Implementing precautionary and
This provides an evidence base        the effects of climate change for
                                                                            adaptive measures into decision-
to support the development of         people and the environment.
                                                                            making at every level will allow
Auckland’s Climate Action Plan.
                                      There is inherent uncertainty in      for better response to reduce risks
                                      the projections and the magnitude     and will help prepare Auckland for
                                      and extent of the effects could       climate change.

Contents                              01/ Introduction                                                        7
                                      02/ Auckland’s Changing Climate                                        11
                                      03/ Climate Change Risk Assessment                                    14
                                      04/ Technical Report Series                                           23
                                           4.1 Health effects of extreme heat                               23
                                           4.2 Connecting climate change to reduced air quality             26
                                           4.3 Creating conditions for disease vectors                      29
                                           4.4 Social vulnerability to climate change impacts               30
                                           4.5 Flooding risk in the built environment                       33
                                           4.6 Auckland’s exposure to sea level rise                        35
                                           4.7 Climate change impacts and risks for terrestrial ecosystems 38
                                           4.8 Climate change risks for marine and freshwater ecosystems 40
                                      05/ Additional and Emerging risks                                     44
                                      06/ Bibliography                                                      46    5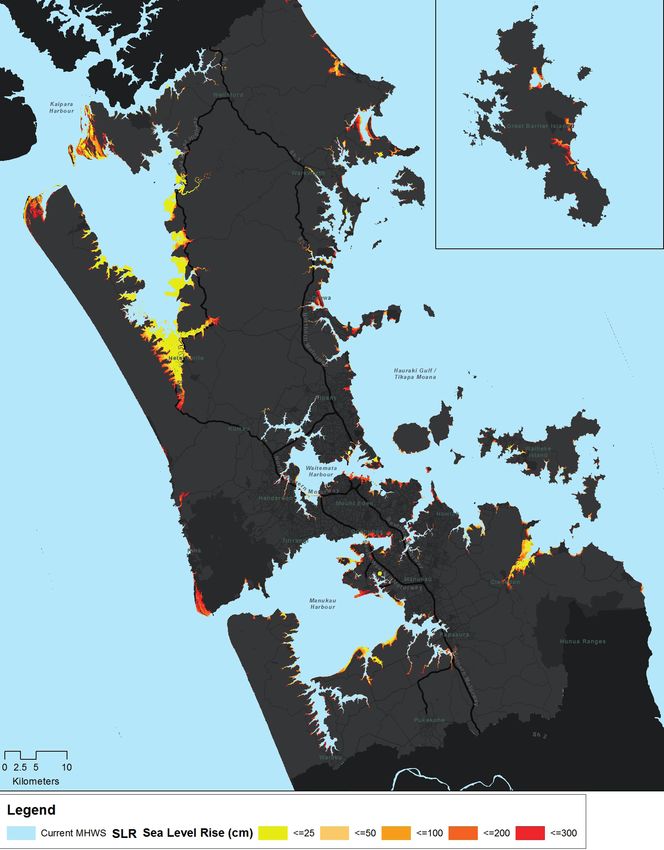
6

Wynyard Quarter © Auckland Council
01/   Introduction

      Auckland’s Climate                    Auckland’s Climate Action Plan       Specifically, the research covers:
                                            will set a path to rapidly reduce
      Action Plan will                      greenhouse gas emissions in line
                                                                                 • Health effects of extreme heat.
      set a path to                         with the 2015 Paris Agreement to     • Climate change, air quality
                                                                                   and health impacts.
      rapidly reduce                        keep warming within 1.5 degrees.
                                            It will ensure that Auckland is      • Creating conditions for
      greenhouse gas                        prepared for the impacts of            disease vectors.
      emissions to keep                     climate change. The plan is          • Social vulnerability.
                                            being developed in collaboration
      within 1.5 degrees                    with businesses, organisations,
                                                                                 • Flooding risk in the
      of warming while                      mana whenua, communities
                                                                                   built environment.
                                                                                 • Climate change impacts and
      ensuring Auckland                     and individuals as well as across
                                                                                   risks for terrestrial ecosystems.
                                            all levels of government.
      is prepared for                                                            • Climate change impacts
      the impacts of                        In developing the evidence             and risks for marine and
                                            base for Auckland’s Climate
      climate change.                       Action Plan, Auckland Council’s
                                                                                   freshwater ecosystems.
                                                                                 • Effects of sea level
                                            Research and Evaluation Unit
      Auckland Council is committed to                                             rise on Auckland.
                                            has developed a Climate Change
      reducing emissions and ensuring                                            Understanding the climate
                                            Risk Assessment technical report
      resilience for Auckland. In 2016,                                          change risks and impacts on
                                            series, using Auckland’s Climate
      Auckland Council joined the                                                vulnerability for Auckland is
                                            Change Projections (Pearce et al.,
      C40 Cities Climate Leadership                                              imperative to both mitigate and
                                            2018) as a basis. This research
      Group, a global network of over                                            adapt to climate change and to
                                            aims to provide information about
      90 cities committed to tackling                                            inform planning and decision
                                            the risks and vulnerabilities that
      climate change. In renewing C40                                            making. This research will help
                                            the Auckland region may face
      membership in November 2018,                                               Aucklanders to understand the
                                            under the changing climate.
      Auckland Council committed to                                              impacts of climate change on
      leading the development of a          This document summarises risks       their health, the health of our
      climate action plan for the region.   identified within the technical      ecosystems and the impact on the
                                            report series to understand          natural and built environment.
                                            how the Auckland region will be
                                                                                 The technical report series will be
                                            affected by climate change.
                                                                                 expanded and built on as data and
                                                                                 other resources become available.

                                                                                                                       7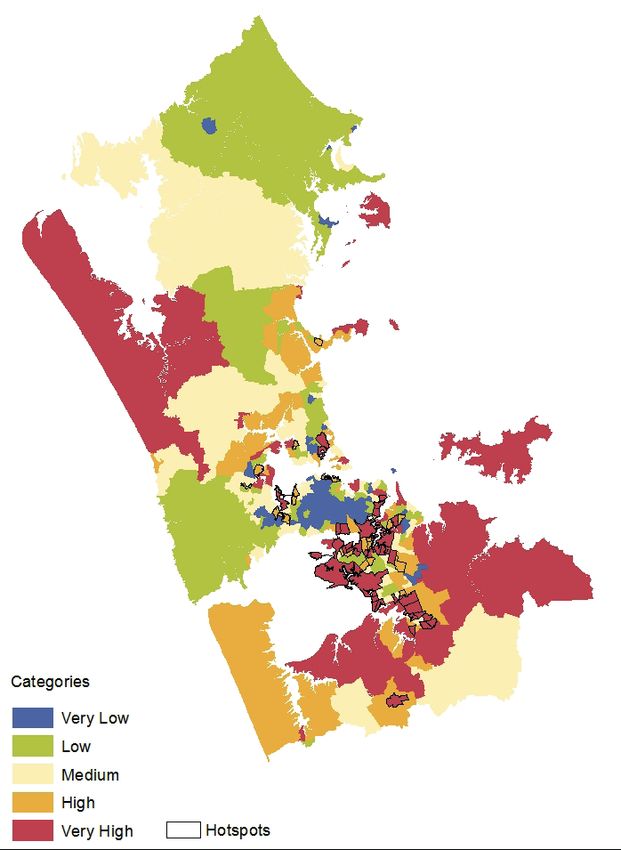
01/ I N T RO D U C T I O N

    Collaborating with Māori
    Auckland Council             By working with the Mana              Future research aims to:
                                 Whenua Kaitiaki Forum, kaumatua
    is working to                and Māori experts, the plan seeks     Develop a more comprehensive
    interface Te Ao              to weave the mātauranga of those      understanding of the specific
                                                                       impacts of climate change
    Māori perspectives,          who have come before us and
                                                                       on Māori communities,
                                 the voices of mana whenua into
    values and ancient           solutions around specific climate     assets and economy across
    ancestral knowledge          challenges for Tāmaki Makaurau.       Tāmaki Makaurau.
                                 It is crucial that these meet the
    (Mātauranga Māori)           specific needs and interests of our
                                                                       Provide clarity around how
    into current and             Māori communities, give a voice
                                                                       Auckland Council and Council
                                                                       Controlled Organisations
    future decision              to our future generations through
                                                                       can enable and honour our
                                 the work we do today, and
    making around                give agency to the non-human
                                                                       commitment of active protection
    climate change.              elements around us who make up
                                                                       in relation to climate change
                                                                       under the Treaty of Waitangi.
                                 the world that we are a part of.

                                 Research across New Zealand
                                 highlights that Māori
                                 communities, assets and economy
                                 are vulnerable to the impacts of
                                 our changing climate.

8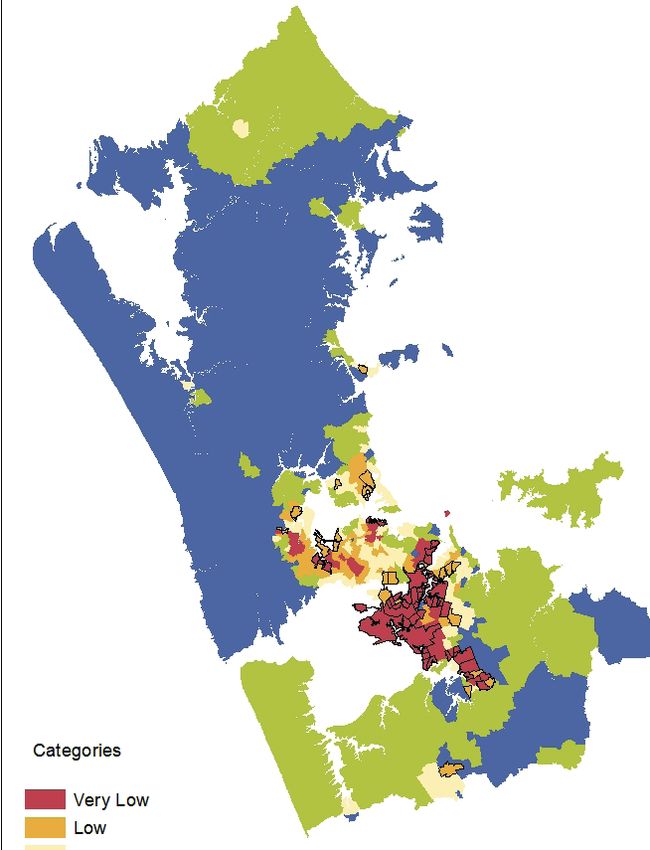
Climate Change Risk Assessment document map

  Auckland Region Climate Change Projections and Impacts
                      NIWA, 2018

    RIMU Risks and Vulnerabilities Research Programme

        An assessment of                              Air quality and societal
     vulnerability to climate                         impacts from predicted
       change in Auckland                          climate change in Auckland

      Development of the
                                                         Creating conditions
        Auckland Heat
                                                         for disease vectors
      Vulnerability Index

          Sea Level Rise                                 Flooding risk in the
           in Auckland                                   built environment

     Climate change impacts                          Climate change impacts
     and risks for marine and                              and risks for
     freshwater ecosystems                            terrestrial ecosystems

               Climate Change Risks in Auckland
                      THIS DOCUMENT

                 Auckland’s Climate Action Plan
                    TO BE RELEASED 2019

                                                                                 9
                                Figure 2: Document map
10 Manurewa native forest remnants © Auckland Council
02/   Auckland’s
      Changing
      Climate

      The climate                          This research has been used to                           Future climate scenarios
                                           underpin the Climate Change                              were considered using four
      in Auckland is                       Risk Assessment.                                         Representative Concentration
      changing, with                                                                                Pathways, 2.6, 4.5, 6.0 and
                                           The report
      extreme weather                      The National Institute of Water
                                                                                                    8.5 for 2040, 2090 and 2110.
                                                                                                    These indicated the projected
      events becoming                      and Atmospheric Research                                 greenhouse gas concentrations
      more common and                      reviewed climate change                                  based on forecast emission
                                           projections in Auckland and                              trends and were used as inputs
      more severe.                         modelled expected changes for                            to the model to represent
                                           21 different climate variables                           different scenarios. The graph
      The National Institute of Water      out to 2120. The future changes                          below demonstrates the
      and Atmospheric Research has         were assessed by incorporating                           different pathways:
      undertaken an important research     knowledge of natural variations
      piece – Auckland region climate      in the climate and changes
      change projections and impacts       that may result from human
      (Pearce et al., 2018) – which        induced increases in greenhouse
      provides Auckland with the most      gas concentrations.
      robust information on the climate
      projections for the region.
                                                                                       historical
                                                                       12
                                                                                       RCP2.6
                                          Radiactive forcing (W m-2)

                                                                                       RCP4.5
                                                                       9
                                                                                       RCP6.0
                                                                                       RCP8.5
                                                                       6

                                                                       3

                                                                       0

                                           Year                            1850 1900   1950 2000 2050 2100   2150 2200 2250 2300

                                           Figure 3: Representative Concentration Pathways

                                                                                                                                     11
02/ AUCKL A N D’ S CH A NG I NG CLI M AT E
Application to the Climate
Change Risk Assessment The future climate is uncertain
The climate change projections
Climate change projections are a snapshot in time and are
have been used as the basis for
projections based on current models. There is inherent
assessing impact and risk in
uncertainty in climate change projections and the future
the Auckland Council Research
changes that will occur as a result. Uncertainty is due to:
and Evaluation Unit Climate
Change Risk Assessment • The cumulative impacts of climate change.
technical report series for
Auckland. The forecasts for • Conflicting impacts of climate change and what this
Representative Concentration means for the natural and built environment.
Pathway 8.5 have been
Evidence demonstrates that the climate is changing
used as these are most
more rapidly than anticipated by climate scientists.
representative of current
Therefore, projections for the next century could very
emission trends and allow a
well be accelerated into the latter part of this century.
precautionary approach.
12Climate
projections
Increasing annual average
temperatures and extreme
TEMPER ATURE temperatures, and significantly
more hot days each year.
Plant growing days also increase.
Rising sea level puts coastal
communities and infrastructure at
SEA LEVEL risk from inundation and erosion.
Under RCP 8.5 1m sea level rise is
projected by the end of this century.
Uptake of atmospheric CO2 is leading
OCEAN to ocean acidification. Changes in the
ACIDIFICATION oceans will adversely impact health of
marine life and cause nutrient decline.
Annual relative humidity is projected
HUMIDIT Y to slightly decrease while absolute
humidity is expected to increase.
Seasonal distribution of rainfall is
projected to change with wetter
R AINFALL autumns and drier springs. More extreme
rainfall events are expected to increase
while the number of rain days and soil
moisture deficit are set to decline.
Average wind speed and number
WIND of windy days are decreasing and
this is projected to continue, while
intensity of tropical cyclones
is expected to increase.
1314 Auckland skyline © Istock
03/   Climate
      Change Risk
      Assessment

      Purpose               Definitions

      This Climate Change   This research utilises the Intergovernmental Panel on Climate
                            Change definitions (IPCC, 2014):
      Risk Assessment
      technical report        RISK
      series provides a       The Intergovernmental Panel on Climate Change defines risk as
      technical,              the likelihood of an event occurring combined with the impacts.
                              Specifically, for climate change, risk is comprised of three
      evidence-driven         components (seen in Figure 4):
      foundation to           • The hazard.
      guide actions for       • Exposure of people, infrastructure, economy
      Auckland’s Climate        and natural environment to the hazards.
      Action Plan.            • Vulnerability to the hazards.

                              VULNERABILITY
                              The vulnerability of people, a species or habitat, infrastructure,
                              economy or the natural environment is a component of risk.
                              Vulnerability includes the following:
                              • Exposure to the hazard.
                              • Sensitivity.
                              • Adaptive capacity.
                              Vulnerability includes the physical, geographic and socio-economic
                              contexts that determine an individual’s or group’s ability to adapt
                              to change. For species, their ability to migrate would influence their
                              adaptive capacity.

                            Understanding the most vulnerable areas of Auckland is important to
                            understand how to build resilience and develop targeted actions to
                            prepare Auckland in response to a changing climate.

                                                                                                       15
03/ CLI M AT E CH A NG E RISK A SSESSM ENT
Risk and vulnerabilities relationships
IMPACTS
PHYSICAL IMPACTS OF VULNERABILITY
SOCIOECONOMIC
CLIMATE CHANGE PROCESSES
CLIMATE
Natural RISK Socioeconomic
Variability Pathways
HAZARDS Emergent
Anthropogenic Trends & Events Adaptation &
Key
Climate Change Mitigation Actions
Governance
EXPOSURE
EMISSIONS
& Land-use Changes
Figure 4: Relationship between vulnerability, risk, exposure and hazards (IPCC, 2014)
16Methodology
The Intergovernmental Panel on 3. Identification of quantifiable 4. Indices: indicators for each
Climate Change methodology indicator variables that cover spatial unit were scored
was undertaken for the Climate exposure, sensitivity and and weighted to develop
Change Risk Assessment technical adaptive capacity: index values.
report series. This methodology
Exposure indicators are variables 5. Identification of vulnerability
was applied to people,
that measure the region’s hotspots: these were identified
ecosystems, societal systems,
exposure to climate change. based on spatial units with high
built infrastructure and green and
blue infrastructure to understand Sensitivity indicators illustrate sensitivity, high exposure and
risks and vulnerabilities. reactiveness to changes in low adaptive capacity.
The methodology included: the climate. For people this
6. Assessment and discussion:
includes employment status,
1. Understanding stressors identifying the vulnerability
age, accessibility and underlying
on the people, society and hotspots in Auckland enabled
health conditions. For species it
environment as a result of an analysis of the most at
includes ability to migrate and
climate change. risk areas, groups, species,
distance from coastal regions.
habitats infrastructure.
2. Definition of the spatial scale Adaptive capacity covers the
being assessed – in most ability to react to the changes.
‘people specific’ cases this was a For people this includes factors
census area unit – for habitats it such as socio-economic standing
was a specific species. and accessibility to greenspace.
Climate Change risk assessment methodology
identify map
define
understand indicators: develop & identify assessment
spatial
stressors exposure, sensitivity indices vulnerability & discussion
scale & adaptive
capacity hotspots
Figure 5: Climate Change risk assessment methodology
1703/ CLI M AT E C H A NGE
RISK A SSESSM ENT
Key Messages
A few of the key findings from the Auckland’s climate change
Climate change research undertaken include:
will impact people, Climate change is happening, and effects can already be seen
societal structures, Climate change is linked to deteriorating air quality which
the natural and will further impact the health of the population.
built environment, Weather patterns will change. Spring rainfall is
species and habitats. projected to decline and autumn rainfall is projected
to increase across the Auckland Region.
Climate change will increase extreme heat events (hot days)
which will likely impact the health of Auckland’s communities
and environments. There may be further unknown consequences
that cannot be projected at this stage, such as the risks
associated with the establishment of new disease and disease
vector populations such as mosquitos and parasites.
Storm surge and sea level rise are already affecting
Auckland’s people and infrastructure.
Ocean acidification is already threatening Auckland’s
marine ecosystems, including culturally, economically
and ecologically significant species.
Terrestrial, marine and freshwater ecosystems will change due
to the compounding effects and multiple stressors of climate
change and other environmental stressors such as pollution.
The current projections may accelerate at an unknown rate,
so that effects projected for the next century – such as sea
level rise – may take place over a much shorter time frame.
18The Climate Change Risk
Assessment takes into consideration The ability of people and households
scientific projections, our current to adapt and respond to the effects of
understanding of climate change climate change is dependent on many factors.
effects and Auckland’s current • Where people live, their socio-economic circumstance,
environment, in order to better their support networks, their occupations and their
ability to have options can impact their vulnerability.
understand the key risks and
vulnerabilities of Auckland. • Children and older people will be more vulnerable than
others to some effects, especially related to poor air
Some of the key findings include:
quality.
• There is some evidence that Māori and Pacific peoples
may be more affected than others to some effects,
due to their generally younger age structures as well as
other factors.
Sea level rise will
put infrastructure and ecosystems
at risk while flooding poses
direct and indirect risks to people, The changing climate will create
infrastructure and services. an environment that allows water
and vector-borne diseases to
thrive, which will affect people and
ecosystems.
Terrestrial, marine and freshwater ecosystems
are at risk and face a combination of stressors.
The most vulnerable species are those
Changes to these ecosystems are likely
that have limited capacity to migrate
to impact on human wellbeing and the
and those that will experience a
economy.
‘coastal squeeze’.
The Climate Change Risk Assessment technical report series identifies some evidence-based, targeted
considerations for those areas, sectors and communities at greatest risk from climate impacts.
These considerations will tie into Auckland’s Climate Change Action Plan. The considerations from these
risk assessments are not comprehensive and actions identified in Auckland’s Climate Change Action Plan
will encompass these considerations and more.
The following sections summarise the technical report series and further detail Auckland’s climate change
impacts and the risks for people, society and the environment.
19CLI M AT E CH A NGE I N AUCKL A N D
Causes and effects
INCREASED
FOREST FIRE RISK
INCREASED
FOREST FIRE RISK
COASTAL
INUNDATION
COASTAL
INUNDATION
WATER-BORNE
DISEASE INCREASE
WATER-BORNE
DISEASE INCREASE
FLOOD
FLOOD
INSECT BORNE
DISEASE INCREASE INSECT BORNE
DISEASE INCREASE
TERRESTRIAL INCREASED INCREASED
TERRESTRIAL ALLERGENS
ECOSYSTEM DECLINE ECOSYSTEM DECLINE ALLERGENS
CLI M AT E
CH A NGE I N
AUCKL A N D
Causes
TEMPERATURE OCEAN ABSOLUTE HUMIDITY
INCREASE ACIDIFICATION INCREASE
20
TEMPERATURE OCEAN ABSOLUTE HUMIDITY
ACIDIFICATION INCREASE STORM INTEN
INCREASESOIL & MOISTURE
DECLINE
SOIL & MOISTURE
DECLINE
MARINE ECOSYSTEM
DECLINE
REDUCED FOOD
MARINE ECOSYSTEM
DECLINE
SECURITY
REDUCED FOOD
SECURITY
POLLUTION
ACCUMULATION
POLLUTION
ACCUMULATION FRESH WATER
ECOSYSTEM
FRESH WATER DECLINE
ECOSYSTEM DECLINE
D
S
DECREASED VARIABLE
STORM INTENSITY INCREASE SEA LEVEL RISE
RAINFALL DAYS WIND SPEED
21
DECREASED VARIABLE
NSITY INCREASE SEA LEVEL RISE
RAINFALL DAYS WIND SPEEDThe following section summarises the Technical
Report series developed by Auckland Council’s
Research and Evaluation Unit.
22
Whangaparoa Peninsula © IstockTechnical
04/
Report Series
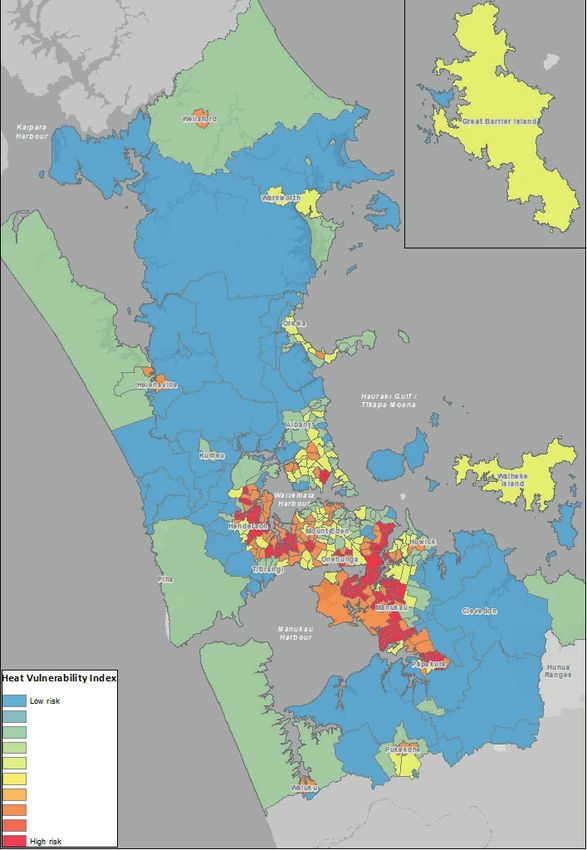
4.1 Health effects of extreme heat
Based on: Joynt, J. L. R. and
Golubiewski, N. E. (2019).
and those with pre-existing mental Increasing access
and chronic health conditions.
Development of the Auckland According to the index the most to social and green
Heat Vulnerability Index.
Auckland Council technical report,
vulnerable populations are in infrastructure,
TR2019/013 South and West Auckland. The
like community
cause of the vulnerability in each
The Auckland Heat Vulnerability area varies but includes limited cool spaces, can
Index identifies the areas and adaptive capacity because of help reduce heat
populations more sensitive to high socio-economic deprivation,
the effects of extreme heat. tenure type and limited transport
stress for those
Vulnerability to extreme heat is access, as well as increased most vulnerable.
influenced by socio-economic, sensitivity to extreme heat due to
health and environmental the prevalence in the population
factors. Ten representative of either old or young, underlying
indicators derived from census health conditions, single occupant
and land cover data for Auckland households as well as the
are combined and mapped effects of limited greenspace.
(overleaf) to indicate areas of
greater sensitivity and reduced Social infrastructure, such
adaptive capacity to hot days. as community centres, can
increase social cohesion
Vulnerability to extreme heat is and reduce isolation and
not the same across Auckland vulnerability to extreme heat.
– heat related impacts are Although not factored into the
closely related to both social Heat Vulnerability Index, the
vulnerability and the local considerable community cohesion
environment. Evidence from evident in many parts of South and
the literature indicates that West Auckland enabled through
heat related mortality and existing social infrastructure is
morbidity is more common in likely, in part, to mitigate the risk
certain groups, including: female for some communities. Measuring
householders, the socially isolated, and including social infrastructure
the elderly and the young, in the Heat Vulnerability Index
those with language barriers, represents a future research
ethnic minorities, low income development opportunity. 23
households, renter households,04/ T ECH N IC A L REPORT SERI ES
People working in heat sensitive Reducing the effects of extreme heat
occupations including construction Examples of effective heat mitigation actions include:
and labour activities may be
subject to negative outcomes. • Heat management plans and warning systems.
There is evidence to suggest
this may affect some groups • Inventories of social infrastructure.
such as Māori and Pacific
• Establishment of ‘buddy systems’ to check on isolated and high risk
peoples more than others.
community members.
Natural and built environment investment and intervention can have a
significant effect on reducing the severity of heat events, for example:
• Cooling can be achieved through increasing green-infrastructure
Social design, such as increased tree canopy and green space and green
infrastructure can warrants of fitness on buildings. Many of the areas identified as
high risk in the Heat Vulnerability Index have proportionally less
increase social green space.
cohesion and
• Further, the provision of improved social infrastructure can create
reduce isolation greater community cohesion, which reduces social isolation, as well
and vulnerability as provide for community ‘cool spaces’, particularly in low socio-
to extreme heat. economic communities for the population to evacuate to during
extreme heat days.
• The Heat Vulnerability Index highlights the importance of green
space, and addressing underlying depreivation and health issues in the
community.
24Figure 6: Heat vulnerability index for Auckland 25
04/ T EC H N IC A L REPORT SERI ES

     4.2 Connecting climate change to reduced air quality
     Based on: Talbot, N. (2019).        Increased air temperature results       Drought could also result in
     Air quality and societal impacts    in a longer growing season for          plant stress. Through a complex
     from predicted climate change       plants, increasing pollen in the        process, plant stress could result
     in Auckland. Auckland Council
                                         atmosphere. Once mixed with             in increased ozone and nitrogen
     technical report, TR2019/012
                                         airborne pollutants, the allergenic     dioxide with organic compounds
     The impact of climate change        properties can be enhanced – if         released by plants mixing with
     has strong implications on air      inhaled, it can trigger asthma          vehicle exhaust and sunlight.
     quality across Auckland.            attacks and other acute
                                                                                       WIND
                                         respiratory disease symptoms.
     Health implications from
                                                                                       Changes in wind speed
     climate forecasts                         HUMIDITY                          and direction will alter how
     Air quality is highly susceptible          Humidity can make pollen         pollutants are carried to and
     to other changes that result        more problematic by causing             dispersed around the city. The
     from climate change, such as        spores to split and allowing them       wind speed and direction regulate
     increased temperature, decreased    to infiltrate further into the lungs.   aerosol loading as well as brown
     humidity and rainfall and changes   Humidity levels also change the         haze events. Changing wind
     in wind speed and direction.        nature of particulate matter in         directions may also increase
                                         the atmosphere. Low and high            contribution of shipping emissions
           TEMPERATURE
                                         humidity favour transmission and        over Auckland from the Port.
            Heat stress makes people     survival of influenza virus and
     more susceptible to acute health                                            Impact on community
                                         increased humidity can impact
     problems. High temperatures         indoor air quality, potentially         There are poor health outcomes
     also tend to occur during periods   increasing mould growth.                from reduced air quality due
     of reduced airflow, resulting                                               to a number of factors. Health
     in a ‘pooling’ of air, increasing          RAINFALL                         conditions such as respiratory
     pollutant concentrations through            Fewer rainy days will lower     illness and asthma are exacerbated
     chemical processes. This is         the efficiency of the removal of        by worsened air quality.
     most likely to occur in densely     atmospheric pollutants and may
     populated urban street canyons                                              The built-up city centre could
                                         allow accumulation of pollutants
     surrounded by tall buildings and                                            be an area of high exposure due
                                         on road surfaces which could
     along heavily-trafficked roads.                                             to the condensed architecture
                                         remain suspended within road
                                                                                 of tall buildings and high
                                         dust. Drier conditions increase the
                                                                                 vehicle traffic volumes.
                                         chance of wildfires, for example, in
                                         the Waitakere Ranges, which
26                                       would reduce air quality.
Dispersion of particulate matter • Communities with low income Air quality will
is reduced at ground level which and employment are less
affects those who live and work in likely to have capacity to be negatively
built-up urban centres. protect themselves against impacted by climate
Research identified that
air pollution impacts.
change. We must
certain communities are focus efforts to
disproportionately vulnerable
to health impacts from
increase resilience
air pollutants in Auckland. for those that are
Vulnerable populations are: most vulnerable
• Communities with elderly to the changes.
or young populations as
relatively small increases in air
pollutants disproportionately How Auckland can adapt
impact them. Several considerations are recommended to improve air quality and limit
the impact on populations:
• Māori and Pacific peoples
may be disproportionately Air quality can be improved by reducing the wood-burning emissions
affected by adverse social from domestic heating and industrial emissions across Auckland.
and economic circumstances, Green infrastructure can improve air quality as natural vegetation can act
as well as higher rates of as a filter to remove or divert air pollutants from the atmosphere.
diseases and chronic illness,
making them more vulnerable Target areas of high density living near busy roads for air quality
to reduced air quality. improvement measures. This would build on the Fossil Fuel Free Streets
initiative and include procuring zero-emission public transport.
Technology can be developed to target specific vulnerable populations
such as those with pre-existing health conditions to provide alerts and
advice in real-time. This could include pollen or particulate matter
warnings and encourage people to stay inside or limit exposure during
periods of poor air quality.
This research will enable Auckland Council to better mitigate and adapt
to climate change and to focus efforts on specific key vulnerable groups. 2704/ T EC H N IC A L REPORT SERI ES
CLIMATE AIR QUALIT Y POSSIBLE HEALTH COMMUNIT Y
FORECAST IMPACTS IMPLICATIONS LEVEL RISKS
Lower wind speed Less dispersal of Increases in urban Old and young
pollutants heat stress most susceptible
Increased temperature
Photo-oxidation = Increased hospital Increased social
Changes in rainfall Increase in O3 / NO2 admissions from inequality
patterns respiratory disorders
Increase in an-allergens Increase in mental
Increasing humidity Increase susceptibility health stress
Lower emissions to flu / allergens
Changes in rainfall from wood burning Absence from
pattern Increase in viruses work / school
Longer lifetime carried by airborne
Changes in for pollutants aerosol Lower income less
climatic cycles able to adapt
Increased plant stress = Environmental
Release of VOC’s = > O3 degradation
Increase runoff of
pollutants (metals)
More lightning, NO2 / O3
Changes in atmospheric
flow- cycle / SO2
Figure 7: Connceting climate change, air quality and its
impacts
284.3 Creating conditions for disease vectors
By: Joynt, J. L. R New Zealand. The Malarial parasite
is carried by the anopheline
The changing
Auckland is at risk of being
exposed to new diseases as
mosquito which is endemic in climate could create
a result of climate change.
Australia and South East Asia and an environment
has been previously intercepted
Increased temperature, humidity at New Zealand’s borders. that allows water
and rainfall can all facilitate
Other vector-borne diseases
and vector borne
the spread of disease and
allow conditions for disease
that could become established diseases to thrive
to thrive and establish in the
in New Zealand include Murray as well as the
Valley Encephalitis, Japanese
community. Water and vector-
Encephalitis and dengue fever, introduction of
borne diseases – those carried
by mosquitoes and parasites
which has already had previous new diseases to the
outbreaks in New Zealand
– are of particular concern.
with Pacific Island origin.
Auckland Region.
As Auckland’s climate becomes
Climate change and disease
more tropical, conditions
grow more favourable for the Climate change will make supply and waterways in flooding
establishment of mosquito and conditions more favourable for a events from sewage overflow.
other vector species populations. population to become established Parasites such as giardia and the
and highlights a significant threat Escherichia coli (E.coli) bacteria can
Mosquito borne diseases to public health. Flooding events cause illness when contaminated
New Zealand has 16 species of can create breeding grounds, waterways are used for recreation
mosquito, and several others have particularly in increasingly warm such as swimming and fishing.
been intercepted at its borders. conditions and lead to increased Cyanobacteria and avian botulism
For disease to establish in the vector establishment. Waterborne in reservoirs also pose a risk as dry
community, both the vector and disease outbreaks are closely conditions with low water levels
the disease need to be present. correlated with extreme weather can result in their establishment
events which are projected to in drinking water reservoirs.
To date there has never been increase in intensity and frequency
a confirmed case of a human in Auckland with climate change. How Auckland can adapt
acquiring a mosquito-borne Regular surveillance and
disease in New Zealand. However, monitoring of disease outbreaks,
there are established species Other health risks as well as disease vectors, will
already which are capable of help assess and forecast changes.
Other health risks include
being vectors for diseases such as
contamination of drinking water 29
West Nile Virus, if it were to enter04/ T EC H N IC A L REPORT SERI ES
4.4 Social vulnerability to climate change impacts
Based on: Fernandez, M. A. and
Golubiewski, N. E. (2019). An
that characterise vulnerable Exposure to climate
hotspots are: a low share of
assessment of vulnerability to green space such as cropland, change effects
climate change in Auckland.
Auckland Council technical report,
grassland or tree cover, high rates combined with
TR2019/011 of single-person households,
socio-economic
low average household income,
Vulnerability has been assessed high housing stress, low levels vulnerability
across the census area units of of house ownership and high results improves
Auckland based on the degree deprivation levels. Some of
to which geophysical, biological, these stressors correspond to
our understanding
and socio-economic systems are the physical and geographical of who climate
susceptible to, and unable to cope
with, adverse impacts of climate
environment, while others are change will impact
characterised by socio-economic
change. The assessment combines context and social preferences.
the most severely.
multiple factors in order to
stress test areas of Auckland and How Auckland can adapt
identify which will be the most This assessment improves the
vulnerable to climate change. understanding of what drives
vulnerability in Auckland
Vulnerability is characterised by
and informs development
the potential impact (comprising
of adaptation options and
exposure and sensitivity) and
priorities for intervention.
adaptive capacity of each census
area unit. Indicators used for
characterisation are shown in
Table 1. Vulnerable areas are those
that suffer potentially high impact
(high exposure and sensitivity)
and have a low adaptive capacity.
Assessment results show the
impact and adaptive capacity
across the Auckland region, with
hotspots located in southern and
western areas of Auckland. Factors
30Figure 8: Vulnerability assessment and hotspots: Impact (sensitivity and exposure) Figure 9: Vulnerability assessment and hotspots: Adaptive capacity 31
04/ T EC H N IC A L REPORT SERI ES
TABLE 1 INDICATORS USED TO MEASURE VULNERABILITY COMPONENTS
INDEX INDIC ATORS FUNCTIONAL REL ATIONSHIP
Exposure Coastal inundation Vulnerability as indicator
– 50 years return 1 metre sea level rise
Dry days < 1 mm Vulnerability as indicator
Total precipitation percentage change Vulnerability as indicator
Heavy rainfall days > 25 mm Vulnerability as indicator
Hot days > 25 Vulnerability as indicator
Mean temperature Vulnerability as indicator
Mean wind speed Vulnerability as indicator
Relative humidity Vulnerability as indicator
Sensitivity Deprivation Index Vulnerability as deprivation index
Unemployment rate* Vulnerability as unemployment
Ratio of population under Vulnerability as rate of dependency
15 and over 65 to 19 – 64 *
Percentage of populated area Vulnerability as % populated area
relative to CAU area
Percentage of single-headed households* Vulnerability as % of single-headed households
Road density (ratio of km of road Vulnerability as ratio
per km2 of populated area)
Adaptive Capacity Average household income* Vulnerability as income
Housing stress (ratio of rent Vulnerability as housing stress
payments to household income)*
Percentage of population that are Vulnerability as % owning house
owner-occupiers of house*
Percentage of area in cropland** Vulnerability as % on crops production
Percentage of area in grassland** Vulnerability as % on grass production
Percentage of area in forest** Vulnerability as % of forest cover
NOTE
* Data at census area unit level, extracted from Census 2013.
32 ** Data extracted from LUCAS NZ land use map 2012. Climatic (exposure) data extracted from Pearce et al. (2017)4.5 Flooding risk in the built environment
Based on: Joynt, J.L.R, Golubiewski,
N.E. and Balderston, K.
Almost one quarter (23%) of
Improving green
Aucklands buildings are exposed
(Forthcoming). Flooding risk in the to flood hazards. It is estimated infrastructure and
built environment. Auckland Council
technical report, TR2019/016
that that 16,000 buildings having less paved
are at risk of floor flooding
Flooding is the most common in a 100 year flood event.
surfaces can help
natural hazard in Auckland. absorb some of
With its many harbours, inland Impacts
watercourses and tributaries, Flood events damage property
the impacts of
there is no part of the region and endanger the population flooding and protect
that is not close to and directly through debris fields, infrastructure.
intimately related with water. high velocities and increased risk
of drowning. Secondary effects
Auckland’s sub-tropical climate include but are not limited to
means that high humidity increased risks of vector and
and heavy rainfall events are water-borne diseases following
not uncommon year-round. flood events and contamination
Further, there is a risk of tropical from wastewater overflows.
storms from the Pacific.
Infrastructure failure,
Climate change will increase displacement, disruption and
the severity and frequency insurance costs all have further
of flooding across the city, impact on society and have long
particularly in winter and autumn. lasting impacts. Increased risk of
Auckland's urban area has Post-Traumatic Stress Disorder
large amounts of impervious can result from extreme natural
surfaces. These surfaces can disasters such asHAZARDS
TABLE 2 FLOOD flooding.
alter the volume, speed and
FLOOD NUMBER OF PERCENTAGE OF
path of rainfall runoff.
HA Z ARD BUILDINGS* TOTAL BUILDINGS 6
Floodplain (FP) 64,064 12%
Flood prone area (FPA) 22,798 4%
Overland 80,244 15%
Total 127,593 23%
33
NOTE
* Buildings are defined as structures greater than or equal to 60m2 in area, many small structures such as garden sheds would not be included
in this estimate.04/ T EC H N IC A L REPORT SERI ES
Vulnerability How Auckland can adapt
Current and future flooding Responding to climate change Reduce the effect of impervious
exposure and risk is core council requires fundamental changes surfaces in new developments,
information. How exposure in how we think about and plan utilising green infrastructure
translates into vulnerability is for the future of our catchments, to decrease runoff.
necessary to understand the coastlines and communities. Some
hard decisions will be required Locating new development
impact of flood events on different
about the acceptability and appropriately, outside floodplains.
communities.
affordability of sustaining human Work across Council to create
As with all climate related risks, habitation and infrastructure in future focussed policy, planning,
the effects of flooding will be some areas. We need to change development and asset
influenced by a range of factors. how we use land and waterways, management that is informed
These factors can include things and design, construct, and manage by the long-term consolidated
such as household income, buildings and infrastructure risk to human life, property and
housing tenure or personal to reduce the risk. We need to infrastructure from all natural
mobility. More information is consider the whole of life risks and hazards and future climate change.
needed to understand the level of costs of future investments in land
flood vulnerability that Auckland and infrastructure development,
communities in different locations and engage the community in
experience now and may in the open and honest conversations.
future.
Flooding is the
most common
natural hazard
in Auckland.
344.6 Auckland’s exposure to sea level rise
Based on: Golubiewski, N. E., Scenarios Coastal inundation
Balderston, K; Hu, C. and Boyle, J. The following scenarios were
(2019) Auckland’s exposure to sea
assessed for sea level rise,
and sea level rise are
level rise: part 1 – regional inventory.
Auckland Council technical report,
and for coastal inundation already affecting
TR2019/017 to understand Auckland’s Aucklanders.
exposure impacts over time.
And Boyle, J. Golubiewski, N. E., We need to prepare
Balderston and K; Hu, C. (2019).
Auckland’s exposure to sea level
SEA LEVEL RISE
our infrastructure
• 0.25 metre sea level rise
rise: part 2 – local inventory.
Auckland Council technical report,
now and understand
TR2019/018 (forthcoming)
• 0.5 metre sea level rise
limitations to areas
Auckland will experience sea- • 1 metre sea level rise available for future
level rise and coastal inundation,
• 2 metre sea level rise infrastructure.
with significant impacts on
people, the environment, land,
COASTAL INUNDATION
buildings and infrastructure.
• 1 in 100-year average
Over this century approximately return interval (ARI)
1.5-2.5% of Auckland’s land area
could be exposed to sea level • 1 in 100-year ARI + 1
rise. This encompasses 0.3% metre sea level rise
of buildings, 80% of coastal
• 1 in 100-year ARI + 2
ecosystems and 6% of dairy land.
metre sea level rise
Outside of these potentially
exposed areas, there are
other areas across Auckland
that are predicted to become
exposed to coastal inundation
in extreme weather events.
3504/ T EC H N IC A L REPORT SERI ES
Exposure How Auckland can adapt
• A substantial proportion of • Many parks lie along shores and Understanding the specific
coastal ecosystems would coastal margins, with between areas that are exposed to sea
be exposed with projected 1% and 7.5% of Council-owned level rise and coastal inundation
sea level rise. Some coastal green space exposed to sea will enable a targeted focus
and scrub forests exposed level rise, including sports to assist building capacity and
to sea level rise and fields, parks and cemeteries. preparation. These specific areas
inundation, with mangroves identified will inform additional
• Utilities and transport have
and saltwater wetlands actions for Auckland’s Climate
high proportional exposure
being the most exposed*. Action Plan to build resilience,
as they are more likely to be
planning and regulations and to
• Some unitary plan zones are below sea level and may be
mitigate the impacts of climate
exposed in long-term sea level exposed to salt intrusion, as
change as much as possible.
rise scenarios, particularly well as utility assets on the
coastal zones, port zone and coast being more directly
the central business district. exposed, due to their location.
• Buildings have been • Livestock farms including sheep,
constructed in zones that are beef and dairy comprise most
now known to be exposed to of the agricultural production
sea level rise, although planning land in the Auckland region
regulations require habitable and have the greatest area of
floors to be above the 100 land exposed to sea level rise.
year storm inundation level
• Further industries that
including 1 metre sea level rise.
• Some residential land is
will be affected include:
fisheries, hatcheries and 1.5-2.5%
exposed (the most exposed other marine aquaculture. of Auckland's
being Rural and Coastal land area could
Settlement zones), and less
than 1% of the future urban
be exposed to
zone is exposed across sea level sea level rise
rise scenarios investigated here. this century.
NOTE
36 * Vulnerability is not known e.g. there may be room for these to move/adapt with SLR.Figure 10: Exposure of Auckland to possible sea level rise scenarios Figure 11: Exposure of Auckland to coastal inundation coupled with sea level rise 37
04/ T EC H N IC A L REPORT SERI ES

     4.7 Climate change impacts and risks for terrestrial ecosystems
     Based on: Bishop, C. D. and Landers,   Additionally many ecosystems           Most of Auckland’s indigenous
     T. J. (2019). Climate change risk      have restricted spatial distribution   ecosystems are already under
     assessment for terrestrial species     that make them more vulnerable         threat from introduced animal
     and ecosystems in the Auckland
                                            to regional extinction from            or plant pests, and clearance
     region. Auckland Council technical
     report, TR2019/015                     changed environmental conditions       and fragmentation as a result
                                            or extreme events.                     of development and agriculture.
     Auckland’s current climate is                                                 Climate change has the potential
     classified as sub-tropical with                                               to exacerbate these effects.
     warm humid summers, mild
     winters and plentiful rainfall.                Ecosystem assessment           There are several ecosystems
                                             Ten regional ecosystems are           that have highly localised or
     Climate change will result in                                                 restricted distributions and so
                                             classified as having severely
     changed weather patterns and                                                  are more vulnerable to regional
                                             restricted spatial distribution,
     conditions, with accumulating                                                 extinction or severe reduction
                                             six of which are critically
     impacts, as well as increased                                                 of their range from a random
                                             endangered. These are mostly
     risk of extreme events that                                                   physical disturbance event. With
                                             coastal and therefore are most
     damage ecosystems.                                                            the increasing frequency and
                                             vulnerable to severe weather
     Rainfall is projected to increase       events, flooding, erosion and         severity of extreme weather
     in intensity and decrease overall       changed weather patterns.             events due to climate change,
     which will have a direct effect                                               events such as landslides,
                                             Native ecosystem maps were            flooding or erosion can severely
     on ecosystems that will be
                                             overlain with projected sea           impact the health of ecosystems.
     subject to drought and flood
                                             level rise and inundation             In the worst-case scenarios,
     conditions more frequently.
                                             scenarios to understand the           ecosystems can be completely
     The varied ecosystems across            effects on these habitats.            inundated or destroyed.
     Auckland will be affected               Ten ecosystems were identified
     differently, for example taraire        as being at risk; where more          Coastal areas are particularly
     and rimu forests are more               than 10% of their area is             prone to the effects of climate
     susceptible to drought stress.          vulnerable to a storm surge           change due to their exposure
     Changes in the pattern of drought       event. Of those, nine are             to storm events, salt deposition
     conditions have the potential to        native ecosystems that are            and rising sea levels.
     alter Auckland’s ecosystems.            classified as endangered
                                             or critically endangered.

38
Species most at risk include The compounding
bats, reptiles and amphibians,
invertebrates, birds and plants cumulative effects
with restricted or exclusively of climate change
coastal distributions. Many
will affect our
already vulnerable or endangered
species will experience greater native ecosystems.
stresses from climate change.
Seabirds are particularly at risk
as they are most affected by
sea level rise, storm events and
destruction of their habitats
and nesting colonies.
How Auckland can adapt Auckland is a
Further research is recommended seabird hotspot
to understand different with 24 species
ecosystems. Currently there is
breeding in
a lack of detailed knowledge on
how different ecosystems and the region.
their species components react
to climate change and so future
Seabirds are at
predictions cannot be accurately risk as they are
made, particularly as accumulating most affected by
impacts of climate change will
sea level rise.
impact species uniquely.
3904/ T EC H N IC A L REPORT SERI ES
4.8 Climate change risks for marine and freshwater ecosystems
Based on: Foley, M.M. and Carbines, Understanding the interplay • Ocean acidification affects
M. (2019). Climate change risk between climate change the condition and survival of
and vulnerability assessment for impacts and other human- marine species, particularly
marine and freshwater ecosystems.
induced stressors is paramount those that have hard, carbonate
Auckland Council technical report,
TR2019/014 to protecting culturally, structures, such as shellfish,
economically, and ecologically urchins (kina), marine snails
Aquatic ecosystems are highly important species. and plankton, all of which are
susceptible to the projected important components of
effects of climate change. Assessment undertaken
Auckland’s marine ecosystems,
Increases in air temperature The sensitivity of specific aquatic and a food source for many as
and water temperature, ocean species and habitats in the well as important aquaculture
acidification, sea level rise and Auckland region to potential species like mussels.
changes in circulation and storm climate change stressors was
• Lower nutrient concentrations
intensity can all affect marine and assessed and results indicate:
could result in fewer
freshwater ecosystems.
STRESSORS ON primary producers, such
Whilst the National Institute of MARINE ECOSYSTEMS as phytoplankton and
Water and Atmospheric Research macroalgae which form the
• Increasing water and air
projections illustrate individual base of the marine food web
temperatures in freshwater
variables, it is difficult to model and underpin the stability
streams and marine habitats
how changes in multiple variables of marine ecosystems.
affect reproduction and growth
will cumulatively affect aquatic rates. This can also result in a • Increasing sea level rise reduces
ecosystems. In addition, the shift in species distributions the viability of some marine
projected climate-related changes and create conditions that habitats, particularly intertidal
are occurring within the broader allow for invasive species to habitats and coastal vegetation
context of environmental change establish new populations that are at the edge of the
and human-induced stressors, in New Zealand. Intertidal coastal margin and those
including sedimentation, pollution, mud flats and rocky reefs species that rely on exposure to
disturbance, and harvesting. are highly sensitive to both air throughout the tidal cycle.
water and air temperature. • Changes to rainfall and
storm patterns may cause
declines in water quality due
to increased sediment and
other contaminant runoff.
40Aquatic ecosystems • Reduced wind speed will affect
mixing dynamics in the surface
are affected by of lakes, altering the physical
the accumulating and chemical conditions of
impacts of climate the water column. Less ability
for freshwater species to Rising
change. The health migrate also increases their temperatures
of these aquatic vulnerability if their habitat
will increasingly
degrades or is damaged.
ecosystems is stress marine
fundamental to The results of the assessment and freshwater
human wellbeing. can be seen in Table 3 overleaf. ecoystems.
These changes also need to be
STRESSORS ON considered with natural variability
FRESHWATER ECOSYSTEMS including long term climate cycles.
• Increases in air temperature Intact aquatic ecosystems provide
may result in increased stream a range of ecosystem services
temperature, particularly in that Auckland relies on every
places where there is little day, including oxygen production,
riparian vegetation for shade climate regulation, and food and
and in shallow streams clean water provision. Changing
characteristic of Auckland ecosystems will impact our
• Decreased rainfall will result ability to adapt. The health of
in decreased stream flow, these aquatic ecosystems is
reducing the amount of in- fundamental to human wellbeing.
water stream habitat available
for fish and macroinvertebrates.
• Heavy rain events can result in
increased sediment runoff from
the land, stream bank erosion,
and stream habitat scouring.
4104/ T EC H N IC A L REPORT SERI ES
TABLE 3 CLIMATE CHANGE SENSITIVITY MATRIX
FOR KEY AQUATIC SPECIES AND HABITATS
HABITAT/SPECIES WATER EXTREME NUTRIENTS OCEAN SEA LEVEL WATER
TEMPERATURE RAINFALL ACIDIFICATION RISE CIRCULATION
Intertidal mud flats High High Low Moderate High Moderate
Intertidal rocky reef High High Moderate High High Moderate
Mangroves Low Low Low Low High Low
Kelp forests High Moderate Moderate Moderate Moderate High
Seagrass Moderate Moderate Low Low Moderate High
Subtidal rocky reef High Moderate Moderate High Low Moderate
Subtidal soft bottom Moderate High Low Low Low Low
Freshwater hard bottom Low High Moderate
Freshwater soft bottom Low High Moderate
Marine shellfish Moderate High Low High Moderate Low
Marine fish Moderate Low Low Moderate Low Low
Freshwater fish High Low Low
Freshwater invertebrates Moderate High Low
How Auckland can adapt
Understanding the impacts of climate change and interactions with other
multiple stressors on the aquatic ecosystems is imperative to planning for
a more resilient Auckland.
Taking action to manage other ecosystem stresses such as habitat loss,
sedimentation and pollution that will be exacerbated by climate change
effects and reduce ecosystem resilience
Restoration of natural ecosystems to increase resilience
Undertaking ongoing New Zealand based studies to assess ecosystem risk.
4243 Devonport © Istock
05/   Additional and
           emerging risks

           In addition to                       A rapidly growing population puts pressure on the environment
                                                through sprawl and urbanisation that inevitably encroaches
           the risks already                    on the environment. Climate migrants are likely to come to
           identified, there                    New Zealand from the Pacific Islands due to rising sea levels.
                                                This will place further pressure on the country’s resources.
           are other factors
           – known and                          Food security is a broader issue than merely considering
                                                available land allocated to agriculture. A changing climate will
           emerging – that                      alter crop production and increase the risk of drought or flood, as
                                                well as increasing the risk of new disease. New Zealand’s economy
           may compound                         is heavily dependent upon agriculture, which may be affected by
           with the effects                     the exacerbated effects of climate change on the land.

           of climate change                    The magnitude of health consequences from climate change is
           and potentially                      unknown. There is increased risk of extreme weather events that
                                                could cause injury or damage to key infrastructure. New diseases
           exacerbate them.                     and vectors may become established in New Zealand and events
                                                such as extreme heat may cause acute health problems and
           These could include land use         exacerbate chronic illness, particularly in vulnerable populations.
           change, increasing population
                                                Saltwater intrusion will increase with rising sea levels and affect
           and climate migrants, food and       a greater area surrounding Auckland. This can pose risks to buried
           energy security, pollution, global   infrastructure such as utilities and transport tunnels, as well as
           economy, and human induced           agricultural land. It can also pose risk to artesian water supplies.
           stressors. There is uncertainty as
           to how exactly these effects may
           compound or interact.
                                                The cumulative effect of multiple stressors will also
                                                pose emerging risks. While National Institute of Water
                                                and Atmospheric Research predictions provide an idea
                                                of the effects of individual variables, it is unclear what
                                                the effect of multiple variables will be on the ecosystem
                                                and Auckland. In the absence of this information, it
                                                is critical that precautionary and adaptive measures
                                                be taken in decision-making at every level.

                                                It is imperative to keep researching, monitoring and
                                                reviewing the impacts of climate change to continue filling
                                                in the gaps and prepare. Collaboration is the way forward
44                                              for Auckland to create resilience amongst our communities.
You can also read