Estimating Cyclone Vulnerability and Its Linkages With Child Mortality Trajectories Along the Bay of Bengal Coast in India: a Geospatial Approach
←
→
Page content transcription
If your browser does not render page correctly, please read the page content below
Estimating Cyclone Vulnerability and Its Linkages With
Child Mortality Trajectories Along the Bay of Bengal
Coast in India: a Geospatial Approach
Arup Jana
International Institute for Population Sciences https://orcid.org/0000-0001-5377-4614
Subhojit Shaw
International Institute for Population Sciences
Aparajita Chattopadhyay ( aparajita@iipsindia.ac.in )
International Institute for Population Sciences (IIPS) https://orcid.org/0000-0002-1722-4268
Research
Keywords: BoB, Neonatal and under-5 mortality, Cyclone, Vulnerability, India, East Coast
Posted Date: August 31st, 2021
DOI: https://doi.org/10.21203/rs.3.rs-840847/v1
License: This work is licensed under a Creative Commons Attribution 4.0 International License. Read Full
License
Page 1/19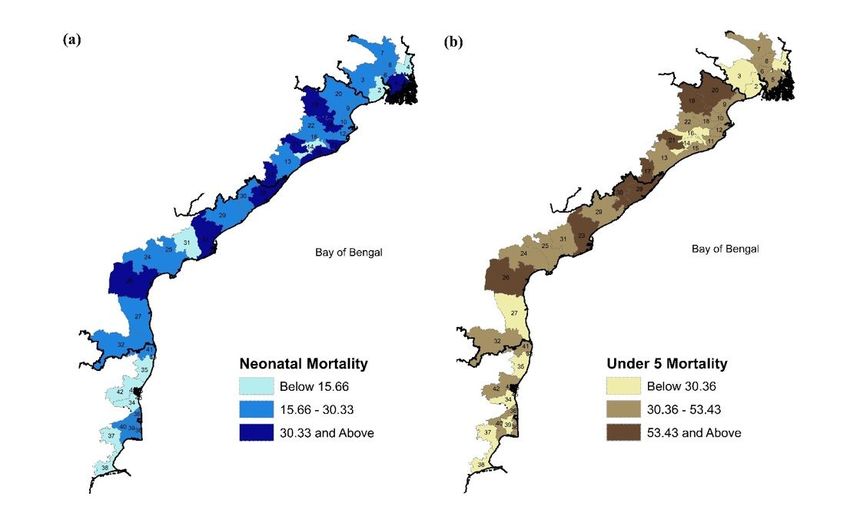
Abstract
Background

The coastal population of Indian subcontinent experience variety of coastal hazards of which cyclone is the
most destructive one. Most recently, on 20th May 2020, the super cyclone Amphan lashed with 155 km/h, as tall
as a two-story building on the Eastern coast and state of West Bengal in India. In the following year 2021,
another cyclonic storm, named Yaas, intensified in the Bay of Bengal in May, and it has ravaged many parts of
the apex of the BoB coast. Over the decades, the devastating tropical cyclones of the Bay of Bengal (BoB) have
thrashed thousands of lives and properties.

Methods

An empirical study to assess the coastal population's vulnerability and mortality along the east coastal districts
of India is the need of the hour. Using a set of data the paper estimates the hazard exposure, sensitivity, and
adaptability. Further, to understand the association between vulnerability and neonatal and under-5 mortality,
regressions are applied.

Results

A very high coastal vulnerability risk for poor socio-economic status and lack of infrastructure was observed in
certain districts of the BoB coast. Women, children, elderly and agrarian population are more sensitive to the
cyclone; while lack of accessibility and infrastructure and poor health care system impact the population's
adaptive capacity. A strong association of child mortality with coastal vulnerability is observed in the study area.
Other factors that also play marked role in child mortality are prevalence of diarrhoea, lack of improved water
and sanitation.

Conclusion

The study, first of its kind in India, has identified vulnerable districts of the east coast to help policymakers take
measures for disaster planning and improving the basic facilities for a resilient society.

1. Introduction
The global sea surface temperature (SST) has increased throughout the past half-century due to the global
greenhouse gas emission, leading to the intensification of cyclones over time [1]. Globally, 40% of the world
population resides within 60 km from the coast, a driver for the coastal vulnerability [2]. The Intergovernmental
Panel on Climate Change (IPCC) has identified several hotspots of climate change sensitive region where
livelihood depends on subsistence agriculture, fishing, aquaculture [3]. Vulnerable places experience damage of
property, lives, and displacements. Aside from the direct losses, insecurity of food, lacking opportunity of
employment, and health impairments are exacerbated by coastal hazards. Additional socio-economic impact is
mainly accrued by developing nations due to low challenges to adaptation and high mitigations strategies [4].
Over the decades, South Asia has experienced recurrent hazards related to tropical cyclones. The area is
identified as a hotspot characterized by high population density, poverty, low development level, and exclusion
[5]. In the north Indian Ocean region, Bay of Bengal (BoB) alone accounts for 7% of all global cyclones of the
world [6]. Historically, coastal zones of India have attracted people due to port facilities, prosperity in agriculture,
                                                       Page 2/19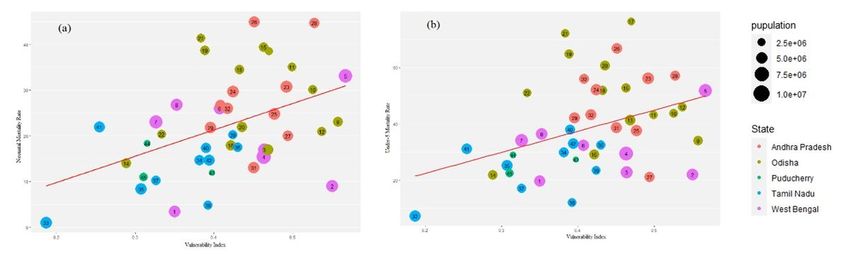
tourism, industries, trades, transport benefits, and habitable ecology [7, 8]. However, these regions are vulnerable
zones due to the coincidence of low elevation, storm surges, floods, saline intrusion, coastal erosion [9], and
other environmental challenges leading to infectious diseases and mortality [10, 11].

The coastal population of Indian subcontinent experience variety of coastal hazards of which cyclone is the
most destructive one. With nearly 137 million populations [12] residing along with the BoB coastal districts and
higher frequencies of depression-cyclonic storms, the coast is quite vulnerable as compared to the Arabian Sea
coast in India due to higher frequency of cyclone (4:1 ratio of cyclones in Bay of Bengal than the Arabian Sea
cyclone), low flat coastal terrain, high population density, poor knowledge of community, inadequate response
and preparedness and absence of any hedging mechanism [13]. Most recently, on 20th May 2020, the super
cyclone Amphan lashed with 155 km/h, as tall as a two-story building on the Eastern coast and state of West
Bengal in India [14]. The devastation was amplified with strong winds, tidal waves, and heavy rains that caused
flooding across the deltaic regions, with an estimated economic loss of US$13.5 billion [15]. In the following year
2021, another cyclonic storm, named Yaas, intensified in the Bay of Bengal in May, and it has ravaged many
parts of the apex of the BoB coast. India has witnessed severe to very severe cyclones: Laila, Helen, Phailin,
Hudhud, Vardah, Ockhi, Titli, Gaja, Amphan and Yaas from 2010–2021 [16] As a result of cyclone hazard
proneness, the Indian Coastal Zone (CRZ) has demarcated 500 m from the shoreline as coastal vulnerability
zones. However, a buffer of 100 km perpendicular from the shoreline is measured for coastal vulnerability
assessments considering the coastal geomorphology [17]. Literature suggests that, to escape from subsistence
livelihood and poverty, aquaculture and industrialization have been introduced in these coastal regions, which
had been the prime loop to coastal vulnerability [18].

Natural hazard vulnerability has a detrimental impact on human health, especially at conception and ending at
the start of the third postnatal year (first 1000 days of life) [19–23]. Progressively, with the availability of satellite
images and radar data, coastal hazard vulnerability assessments have soared [9, 17, 24–27]. However, a handful
of scientists has conducted vulnerability assessment as a function of geomorphological, socio-economic,
infrastructures, and other vectors [28, 29] The use of convoluted indices to understand the vulnerability has been
adopted by many scholars like Cutter et al., 2006, who measured Social Vulnerability Index (SVI) using socio-
economic and infrastructural indicators. Kim and Gim (2020) measured flood vulnerability and adaption along
the Java coast, integrating the spatial regression model [31]. In India, Mazumdar and Paul (2016) and Sharma
and Patwardhan (2008) measured the SVI due to cyclone with the principal component method. Scientists have
studied the extreme effect of climate variability on health and mortality trajectories [34, 35]. Maternal exposure to
cyclone increases the risk of having preterm [36–38] birth and consequently plays critical role in neonatal
mortality [39, 40]. Past study observed that tropical strom increases the risk of illness, injuries and health needs
[41].The risk of disease transmission tends to heighten in developing countries due to population density,
inadequate sanitation, and poor health facilities. The outbreak of gastroenteritis and diarrhoeal disease has been
documented in the parts of West Bengal, India, after Cyclone Aila, 2008 [42, 43]. Other morbidities like acute
respiratory diseases, leptospirosis have been reported following a cyclone in Orissa, India, in 1991 [44]. The
extreme weather events have a significant impact on the health of a child [45, 46]. Female infant mortality was
15.1 times higher than males in a natural disaster as observed in Philippines [47]. Furthermore, a cross-country
analysis of 12 developing countries indicated an increase in infant mortality due to the cyclone's long-term effect
[48]. As cyclones have the potential to cause infant and under 5 mortality, empirical studies suggest that natural
hazard-induced child mortality positively responds to higher fertility rates [49, 50].

                                                        Page 3/19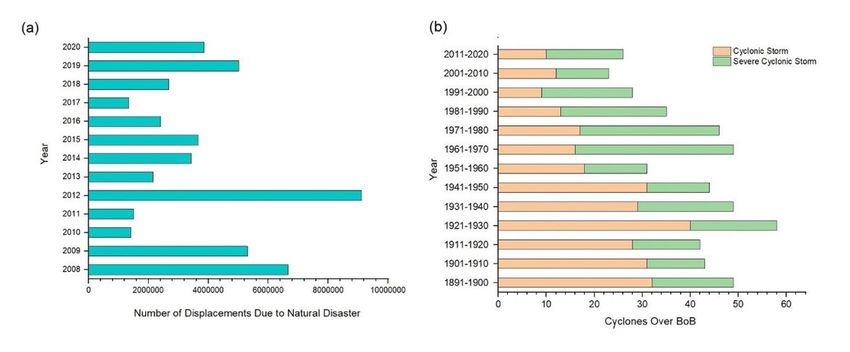
The rich body of literature in this field mainly focused on different natural hazard vulnerability assessments or
aftermath of extreme events. Studies in India are rare in this field, especially highlighting aggregate
measurement of vulnerability based on public data and revealing the associations of vulnerability and child
health. The present study, unique in its approach, aims to estimate vulnerability at coastal districts of the Bay of
Bengal, consisting of 45 districts within a 100 km buffer zone along the coastline. We made progress on
integrating the vulnerability and its effects on health by considering two crucial health indicators, i.e. neonatal
and under-5 mortality. The study adds to the literature by providing additional evidence of socio-economic
vulnerability as a function of exposure, adaptation, and sensitivity due to cyclones and its linkages to child
mortality in India.

2. Methods
2.1 Study area

Districts less than 100 km from the coast line were considered coastal districts according to the definition of MDI
[51]. A total of 45 districts were selected for this study (Fig. 1). The temperature of the study area exceeds 30º C
and the region experience a high level of humidity. Annual rainfall ranges from 1,000 to 3,000 mm. Most of the
cyclones here are developed either in the month of April to May (pre-monsoon season in the apex of BoB coast)
or October to November (pre-winter season in the southern part of BoB coast.

2.2 Operational definition and analysis

Vulnerability is defined as "A function of the character, magnitude, and rate of climate variation to which a
system is exposed, its sensitivity, and its adaptive capacity" [52]. Total cyclone frequency, severe cyclone
frequency, wind speed and shoreline length were considered in the calculation of cyclone exposure. Additionally,
we included three components: sensitivity, demographics, agriculture and health. The components that help to
adjust with different shocks like economic capacity and skills & infrastructure were considered to calculate the
adaptive capacity as better-off households are able to recover the damages of the cyclones in a short period of
time [53, 54] (Table 1). The vulnerability index was calculated using the universal normalization technique-

                                                      (Xij − M inXij )
                                          Xij = [                              ]
                                                    M axXij − M inXij

Where Xij refers to the normalized index value of the indicator, i represents indicators, j is the coastal district
and M inXij and M inXij indicates the maximum and minimum value of the ith indicator among all the
coastal districts. The value of the index varies from 0 to 1. Then, the composite vulnerability index was
calculated using the equal weighting approach [55]. After normalizing all the indicators, the vulnerability index
was derived as:
                                                          n
                                                       ∑        IndexXij
                                                          i=1
                                             Mj = [                        ]
                                                                 n

Where Mj is the vulnerability index Xij is the index value of the ith indicator for district j, and n is the number of
indicators considered to represent the index.

                                                        Page 4/19
Table 1
Description and data source to measure cyclone hazard exposure, sensitivity, adaptive capacity and vulnerability.
Determinants Components Indicators Data source
of vulnerability
Hazard and Characteristics Frequency of total cyclone IMD report of cyclone by
Exposure of cyclone Government of India
Frequency of severe cyclone
Wind speed in Knots
Coast length Coastal length in (km) Measured by authors using GIS
Sensitivity Demographic Share of district population to Census of India, 2011
sensitivity total population of the state
Growth rate of the population
during 2001–2011
Population density
Percentage of rural population
Percentage of female population
Percentage of children (less than
6 years)
Percentage of old people (above
60 years)
Agricultural Percentage of cultivator Census of India, 2011
sensitivity
Percentage of labourer
Percentage of gross sown area Land use statistics
Health Crude death rate Districtsofindia.com
sensitivity
Percentage of stunting children National Family Health Survey
(NFHS), round 4
Adaptive Economic Economic development Index Mohanty, S. K., Dash, A., Mishra, R.
capacity capacity S., & Dehury, B. (2019)
Skils & Hospital available per 100000 Data.gov.in
Infrastructure population
Road density Brief Industrial Profile of different
districts, Ministry of MSME
Average number of bank per
100000 population
Total number of small scale
industries in each district
Electricity Census of India, 2011
Pucca house
Compiled by Authors
Page 5/19Determinants Components Indicators Data source
of vulnerability
Literacy rate
Female literacy rate
Compiled by Authors
The fourth round of the National Family Health Survey (NFHS-4), the landmark Demographic Health Survey
(DHS) in India, was used to estimate neonatal and under-5 mortality at the district level, considering the
information of 69,971children in the study area [56]. The mortality rate was calculated using the information of
the date of birth of the child, their survival status and age at death of the deceased child. The synthetic cohort
probability approach was applied to estimate the neonatal mortality rate (NMR) and under-5 mortality rate
(U5MR) for the ten years preceding the survey using the full birth history information of women aged 15–49. The
total population of the districts were taken from the Census of India, 2011.
Scatter plots were used to establish the association between coastal vulnerability and neonatal and under-5
mortality in coastal districts of BoB. Finally, linear regressions, Spatial Lag Model (SLM) and Spatial Error Model
(SEM) were used to find out the empirical association between coastal vulnerability and neonatal and under-5
mortality. SLM and SEM helped to adjust the spatial endogeneity and provide a refined measure.
3. Results
3.1 Vulnerability
In India, the number of cyclones, especially severe cyclones, increased considerably over the last decade (Fig.
2b). Meanwhile, a large number of people were displaced as a result of these disasters, notably in 2012 (Fig. 2a),
when more than 9 million people were displaced. More than 5 million people in India were displaced by natural
catastrophes in 2019, accounting for the highest number of new internal movements in the world [57].
The districts located in the apex part of BoB were more prone to coastal cyclone vulnerability than the southern
part (Table 2). The highest degree of exposure was observed in districts of West Bengal. A very high degree of
sensitivity was noted in Kendrapara, followed by Gajapati, Thiruvarur and Baleswar because of the higher degree
of demographic, agricultural and health sensitivity. Adaptability was higher in the districts of Chennai and
Calcutta. This study demonstrated a high vulnerability index in South 24 Parganas district, followed by Baleswar,
Purba Medinipur, Kendrapara, Srikakulam and Bhadrak. Chennai had the lowest vulnerability index due to its
higher adaptive capacity.
Table 2. Vulnerability, exposure, sensitivity and adaptive capacity in Costal area of Bay of Bengal: District level
summary
Page 6/19Source: Based on Author’s calculation
3.2 Neonatal and under-5 mortality
Figure 3 depicts the spatial distribution of neonatal and under-5 mortality rate (per 1000 live births) across 45
coastal districts of BoB. It is worth mentioning that a similar heterogeneity pattern remains in the case of both
NMR and U5MR. The spatial pattern of NMR shows very high occurrence in most districts of Odisha, much
higher than the national level, i.e. NMR and U5MR for India were 30 and 50 deaths per live births in India. On the
contrary, a lower NMR was observed in Chennai and Kolkata, the megacities of the study area. However, in the
Page 7/19districts of Gajapati, Nayagarh, Prakasam, Kendujhar, Srikakulam, East Godavari, Puri, Jajapur and South 24
Parganas, NMR and U5MR surpassed India's average.
3.3 Association of NMR and U5MR with vulnerability
Figure 4 depicts the result of the scatter plot between the coastal vulnerability with neonatal and under-5
mortality rates. The radius of the circles represents the volume of total population of the district. Districts with
higher levels of coastal vulnerability had higher rates of neonatal mortality and under-five mortality. The study
found a positive association though the relationship was weaker in the NMR relative to U5MR.
OLS regression was applied to examine the effects of coastal vulnerability on child survival after adjusting other
socio-economic components (Table 3). The coefficient of under-5 mortality was higher with coastal vulnerability
index (β = 67.58, p value = 0.00) as compared to neonatal mortality (β = 52.3, p value = 0.00). Among the
covariates, the prevalence of diarrhoea among children was significantly associated with neonatal and under-5
mortality across coastal districts of BoB. In addition, the proportion of using unimproved sanitation facility (β =
0.26, p value = 0.04) and unimproved sources of drinking water (β = 0.36, p value = 0.03) showed a significant
positive association with district-level under-5 mortality rate.
Table 3. Estimated Effect of Coastal vulnerability and child mortality in BoB coastal districts, India: regression
models
Page 8/19Neonatal mortality Under-5 mortality
OLS SLM SEM OLS SLM SEM
Predictors
Coastal 46.98** 43.54*** 44.86*** 57.84** 51.77** 52.34**
vulnerability (17.52) (15.98) (17.33) (22.52) (20.77) (22.03)
Unimproved 0.15(0.12) 0.14(0.11) 0.09(0.13) 0.30(0.16) 0.28**(0.14) 0.31(0.16)
drinking
water
Prevalence 0.52(0.39) 0.61(0.34) 1.05*** 0.93(0.50) 1.03**(0.44) 1.41***
of diarrhoea (0.30) (0.41)
Unimproved 0.20*(0.10) 0.21**(0.09) 0.25*** 0.22(0.13) 0.24**(0.11) 0.30**(0.12)
sanitation (0.09)
Proportion -0.22(0.16) -0.24(0.14) -0.24(0.13) -0.29(0.21) -0.34(0.19) -0.35(0.17)
of Hindu
Proportion 0.06(0.13) 0.03(0.12) 0.02(0.12) 0.32(0.17) 0.27(0.15) 0.26(0.15)
of ST
Proportion -0.08(0.14) -0.06(0.12) 0.07(0.11) -0.18(0.18) -0.14(0.16) -0.05(0.15)
of full ANC
Proportion -0.24(0.13) -0.26**(0.12) -0.32*** -0.31(0.17) -0.32**(0.15) -0.32**(0.13)
of no (0.10)
vaccination
Constant 16.28(20.19) 13.63(17.87) 2.84(16.29) 33.72(25.94) 30.67(22.88) 24.25(21.74)
Ρ 0.15 0.15
Λ 0.48 0.37
AIC 331.53 332.81 327.22 354.11 355.15 351.07
R2 0.47 0.47 0.56 0.60 0.61 0.64
OLS-Ordinary Least Square Model, SLM-Spatial Lag Model, SEM-Spatial Error Model; Standard errors in
parentheses, *** p < 0.01, ** p < 0.05
The result of SEM showed a spatial association between coastal vulnerability and NMR - U5MR. Of the two
spatially estimated models, the study found a lower AIC value for the SEM model. With respect to neonatal
mortality, the coefficient was largest for coastal vulnerability (β = 44.86, p value = 0.00). Further, the coastal
vulnerability was significantly associated with under-5 mortality (β = 52.34, p value = 0.01). In the spatial lag
model, a 10-point increase in unimproved sources of drinking water across the districts was associated with a 3-
point increase in U5MR. In addition, diarrhoea among children was significantly associated with NMR (β = 1.05, p
value = 0.03) and U5MR (β = 1.41, p value = 0.00). Also, unimproved sanitation facilities (β = 0.28, p value = 0.04)
was a strong predictor of NMR (β = 0.25, p value = 0.00) and U5MR (β = 0.35, p value = 0.00) in these spatial
models. Similarly, a 10-point increase in coverage of child vaccination was associated with a 3-point decrease in
Page 9/19NMR and U5MR. We observed that the U5MR model showed a greater AIC value with a pseudo R square value of
0.64 than the NMR model across 45 coastal districts of BoB.
4. Discussions And Conclusion
IPCC has declared that climate change has a very high confidence in disease's global burden [58]. Further
climate change, sea level rise to one meter in the present century has intensified cyclone affecting the socio-
economic and culture cohesion through displacement of coastal communities [59]. A large proportion of rural
population in India lives near the coastline, depends on agriculture, fishery and forestry. Almost every year,
moderate to severe cyclone hits the coastal districts of BoB, leading to significant cause of economic and
human loss. In this context, our estimates highlight several important issues related to coastal vulnerability and
its linkages with neonatal- child mortality in BoB coast of India.
The paper analyses the vulnerability level of the east coastal districts or BoB coast of India stretching for 1400
km and supporting large number of rural populations as well as some important cities and state capitals.
Findings reveal that northern districts located close to the apex of BoB are more prone to exposure of
vulnerability of coastal cyclones as compared to the southern part. The reasons are varying; first, the topography
of the northern part of BoB bordering West Bengal and Odisha are flatter than the southern part where eastern
hills stand along the coastline; second, the funnel shape apex of the BoB exactly collides with the northern coast
(along with Bangladesh), that helps intensification of wind speed [9]; third, the urban proportion of southern
districts are more and thus it has better adaptive capacity, as revealed in the estimate. Poor adaptive capacity
attributed to the high degree of vulnerability in selected districts is mostly rural, agrarian, and generally located in
West Bengal, Odisha, and parts of Andhra Pradesh.
The study establishes that the districts with a higher degree of coastal vulnerability experience a higher neonatal
and under-5 mortality rate. Further, under-5 mortality is more strongly associated with the coastal vulnerability
index in the districts of BoB as compared to neonatal mortality rate. Exposure to climate shocks like cyclones is
harmful to young children as the shocks lead to reduced food intake and increased infectious diseases. In
addition to economic hardship, medical access and utilization are also compromised during such catastrophize
affecting the children disproportionately [60–63]. Therefore, it is essential to understand whether climate change
poses a threat to children's health, and if so, where support is most needed. In the coastal districts, water and
waste disposal quality in terms of drinking water and sanitation facility are the major determinants of child's
survival. The drinking water and sanitation help to improve people's overall health and quality of life [64–66].
The risk of communicable diseases among vulnerable communities is due to the water and unimproved
sanitation facilities [67]. The evidence from Amphan, 2020 affected areas of Bangladesh has reported an
increase in the number of diarrhoea and skin disorders due to the usage of polluted pond water as their primary
source of water for varying use. In addition, people also suffered from dysentery, jaundice, and eye irritation after
the said cyclone [68]. Few studies undertaken in India reveals that excessive precipitation is associated with an
increased risk of contracting water borne diseases such as diarrhoea among children under five [69].
Furthermore, Bhattacharjee et al 2010 has reported an increase of Vibrio fluvialis (diarrhoea) along the cyclone
affected areas after Aila, 2009 cyclone [70]. Indeed, the present study substantiates the findings of Dimitrova
and Bora (2020) by revealing that in these coastal districts of India, the quality of water and waste disposal in
terms of drinking water and sanitation facility are the major determinants of child's survival [69]. So, it is evident
that due to coastal cyclones, the water- sanitation facilities are not up to the mark that leads to higher mortality.
Page 10/19WHO and UNICEF recommends measles vaccination and Vitamin-A supplements for children during an
emergency [71]. In India, after any major disasters, the government organized mass vaccination campaigns to
limit the spread of infection and fatality [72]. However, Mallik et al (2011) identified major geographical,
infrastructural constraints for mass measles vaccination campaigns in the Aila cyclone-affected areas [73]. In
general, India's healthcare infrastructure, manpower and accessibility are inadequate, especially in remote areas
[74] and this could promote child mortality in vulnerable districts.
The present study has adopted an innovative approach to estimate vulnerability index. The most common
weakness of the pre-existing studies of vulnerabilities in India is the use of satellite data. Here, we used existing
credible secondary data from well established sources to compute the index. Through this measure, considering
sensitivity, exposure and adaptive capacity, we identified the problem, quantified it, and assessed the index value
in formulating development strategies to reduce the risk and vulnerabilities. In the context of increasing
frequency and severity of coastal cyclone, the need of the hour to have better planning and protection strategies
for Indian coast to safeguard coastal environment, human health, and livelihoods.
The policies related to climate change and coastal vulnerability in India are lacking in implementation. A recent
research on climate change strategies, covering 136 coastal cities in 68 countries, observed the lack of effective
climate change adaptation policies with no signs of implementation in nearly half the cases. Six major Indian
coastal cities were included in the analysis of which three are from the BoB coast, i.e. Chennai, Visakhapatnam
and Kolkata. For six Indian cities, only eight policies were identified by the team, which explicit inclusion of plans
to prepare for the impacts of climate change; a plan at the national level, six at state and only one at local level
(for Gujarat in the West Coast of India). This exhibits the lack of concrete measures at the city government stage
[75].
Overall, current policies in India are not adequate to deal with the challenges of coastal vulnerabilities. The issue
of displacement is addressed mostly as a post-disaster response, while there is a serious need for more
comprehensive national and state polices on forestall managed adaptation for at-risk coastal populations. Early
response mechanism and safeguarding households especially those with small children in terms of water
sanitation, immunization, safety during such climate catastrophe are essential in areas where cyclone
vulnerability is high in India.
Declarations
Acknowledgement
We are thankful to the Editor and reviewers for their encouraging comments that helped us to revise the
manuscript. The authors would like to thank International Institute for Population Sciences (IIPS), Office of the
Registrar General & Census Commissioner and India Meteorological Department (IMD) for providing publicly
accessible data.
Contribution statement
Arup Jana: conceptualization, mapmaking, analysis, writing.
Subhojit Shaw: writing and analysis
Page 11/19Aparajita Chattopadhyay: conceptualization, writing, editing.
Ethical approval and Consent to participate
The analysis is based on secondary data available in the public domain for research; thus, no approval was
required from any institutional review board (IRB).
Competing of interests
The authors declare that they have no conflict of interests.
Funding
This research received no specific grant from any funding agency in the public, commercial, or not-for-profit
sectors.
Availability of data and materials
The datasets used in the study area available at the following links:
NFHS: http://rchiips.org/nfhs/factsheet_nfhs-4.shtml, Census data: https://censusindia.gov.in/
IMD data: https://mausam.imd.gov.in/imd_latest/contents/cyclone.php and MSME report: https://msme.gov.in/.
References
1. Deo AA, Ganer DW. Tropical cyclone activity over the Indian Ocean in the warmer climate. InMonitoring and
prediction of tropical cyclones in the indian ocean and climate change. 2014 (pp. 72-80). Springer,
Dordrecht.
2. United Nations Environment Programme (UNEP) With a Foreword by Kofi Annan, UN Secretary‐General.
Global Environment Outlook 3: past, present and future perspectives. Environmental Management and
Health. 2002 Dec 1;13(5):560-1.
3. UCS. Impacts of global warming: people, health. Climate Hot Map: Global warming effects around the world.
Union of Concerned Scientists, United States of America.2011
4. Wiek A, Ries R, Thabrew L, Brundiers K, Wickramasinghe A. Challenges of sustainable recovery processes in
tsunami affected communities. Disaster Prevention and Management: An International Journal. 2010 Aug
31.
5. Khadria B. Migration in South and South-West Asia. :23.
6. Sahoo B, Bhaskaran PK. Assessment on historical cyclone tracks in the Bay of Bengal, east coast of India.
International Journal of Climatology. 2016 Jan;36(1):95-109.
7. Rani M, Rehman S, Sajjad H, Chaudhary BS, Sharma J, Bhardwaj S, Kumar P. Assessing coastal landscape
vulnerability using geospatial techniques along Vizianagaram–Srikakulam coast of Andhra Pradesh, India.
Natural Hazards. 2018 Nov;94(2):711-25.
8. Harley CD, Randall Hughes A, Hultgren KM, Miner BG, Sorte CJ, Thornber CS, Rodriguez LF, Tomanek L,
Williams SL. The impacts of climate change in coastal marine systems. Ecology letters. 2006 Feb;9(2):228-
Page 12/1941.
9. Nicholls RJ, Wong PP, Burkett V, Codignotto J, Hay J, McLean R, Ragoonaden S, Woodroffe CD, Abuodha PA,
Arblaster J, Brown B. Coastal systems and low-lying areas.2007.
10. Dasgupta S, Huq M, Wheeler D. Drinking water salinity and infant mortality in coastal Bangladesh. Water
Economics and Policy. 2016 Mar 11;2(01):1650003.
11. Ramasamy R, Surendran SN. Possible impact of rising sea levels on vector-borne infectious diseases. BMC
infectious diseases. 2011 Dec;11(1):1-6.
12. Registrar General, I. Census of India 2011: provisional population totals-India data sheet. Office of the
Registrar General Census
Commissioner.2011 https://censusindia.gov.in/2011census/population_enumeration.html. Accessed 6 Jul
2021.
13. Rangachari, R., Kanija, V.K., Gupta, AC. And Baweja.Water resources development scenario in India. CWC,
MoWR, GoI.2011.http://cwc.gov.in/water-info. Accessed 6 Jul 2021.
14. Ahammed KB, Pandey AC. Characterization and impact assessment of super cyclonic storm AMPHAN in the
Indian subcontinent through space borne observations. Ocean & Coastal Management. 2021 May
1;205:105532.
15. Baidya DK, Maitra S, Bhattacharjee S. Facing post-cyclone disaster in times of COVID-19 Pandemic in India:
possible testing strategy to reduce further spread of disease. Asia Pacific Journal of Public Health. 2020
Sep;32(6-7):376.
16. Giribabu D, Muvva VR, Joshi NK, Rao SS. Assessment of epidemiological implications due to serial tropical
cyclones in India: introspecting the recent sanitation interventions. Disaster medicine and public health
preparedness. 2021 Apr;15(2):181-90.
17. Kantamaneni K, Sudha Rani NN, Rice L, Sur K, Thayaparan M, Kulatunga U, Rege R, Yenneti K, Campos LC. A
systematic review of coastal vulnerability assessment studies along Andhra Pradesh, India: A critical
evaluation of data gathering, risk levels and mitigation strategies. Water. 2019 Feb;11(2):393.
18. Kumaran M, Ghoshal TK, De D, Biswas G, Raja RA, Anand PS, Panigrahi A, Vijayan KK. Aquaculture-based
production systems for the livelihood security of coastal farm families in the risk-prone agro-ecosystem of
India: an appraisal. Aquaculture International. 2020 Apr;28(2):805-14.
19. Nowak‐Szczepanska N, Gomula A, Chakraborty R, Koziel S. Nutritional and weight status of Indian mother‐
child dyads experienced by a natural disaster. Maternal & Child Nutrition. 2021 Jul;17(3):e13164.
20. Shaw J, Taylor RB, Forbes DL, Ruz MH, Solomon S. Sensitivity of the coasts of Canada to sea-level rise.
Ottawa: Geological Survey of Canada; 1998 Dec 31.
21. Klein RJ, Nicholls RJ. Assessment of coastal vulnerability to climate change. Ambio. 1999 Mar 1:182-7.
22. Hennecke WG, Greve CA, Cowell PJ, Thom BG. GIS-based coastal behavior modeling and simulation of
potential land and property loss: implications of sea-level rise at Collaroy/Narrabeen Beach, Sydney
(Australia). Coastal Management. 2004 Oct 1;32(4):449-70.
23. Abuodha PA, Woodroffe CD. Assessing vulnerability to sea-level rise using a coastal sensitivity index: a case
study from southeast Australia. Journal of coastal conservation. 2010 Sep;14(3):189-205.
24. Marghany M, editor. Applied Studies of Coastal and Marine Environments. BoD–Books on Demand; 2016
Sep 14.
Page 13/1925. Cazenave A, Llovel W. Contemporary sea level rise. Annual review of marine science. 2010 Jan 15;2:145-73.
26. Jiang L, Huang X, Wang F, Liu Y, An P. Method for evaluating ecological vulnerability under climate change
based on remote sensing: A case study. Ecological Indicators. 2018 Feb 1;85:479-86.
27. Rani M, Rehman S, Sajjad H, Chaudhary BS, Sharma J, Bhardwaj S, Kumar P. Assessing coastal landscape
vulnerability using geospatial techniques along Vizianagaram–Srikakulam coast of Andhra Pradesh, India.
Natural Hazards. 2018 Nov;94(2):711-25.
28. Brown JM, Morrissey K, Knight P, Prime TD, Almeida LP, Masselink G, Bird CO, Dodds D, Plater AJ. A coastal
vulnerability assessment for planning climate resilient infrastructure. Ocean & Coastal Management. 2018
Sep 1;163:101-12.
29. Ružić I, Dugonjić Jovančević S, Benac Č, Krvavica N. Assessment of the Coastal Vulnerability Index in an
area of complex geological conditions on the Krk Island, Northeast Adriatic Sea. Geosciences. 2019
May;9(5):219.
30. Cutter SL, Boruff BJ, Shirley WL. Social vulnerability to environmental hazards. Social science quarterly.
2003 Jun;84(2):242-61.
31. Kim J, Gim TH. Assessment of social vulnerability to floods on Java, Indonesia. Natural Hazards. 2020
May;102(1):101-14.
32. Mazumdar J, Paul SK. Socioeconomic and infrastructural vulnerability indices for cyclones in the eastern
coastal states of India. Natural Hazards. 2016 Jul;82(3):1621-43.
33. Sharma U, Patwardhan A. Methodology for identifying vulnerability hotspots to tropical cyclone hazard in
India. Mitigation and adaptation strategies for global change. 2008 Aug;13(7):703-17.
34. Grace K, Davenport F, Hanson H, Funk C, Shukla S. Linking climate change and health outcomes: Examining
the relationship between temperature, precipitation and birth weight in Africa. Global Environmental Change.
2015 Nov 1;35:125-37.
35. De Waal A, Taffesse A, Carruth L. Child survival during the 2002–2003 drought in Ethiopia. Global public
health. 2006 Jun 1;1(2):125-32.
36. Xiong XU, Harville EW, Buekens P, Mattison DR, Elkind-Hirsch K, Pridjian G. Exposure to Hurricane Katrina,
post-traumatic stress disorder and birth outcomes. The American journal of the medical sciences. 2008 Aug
1;336(2):111-5.
37. Sun S, Weinberger KR, Yan M, Anderson GB, Wellenius GA. Tropical cyclones and risk of preterm birth: a
retrospective analysis of 20 million births across 378 US counties. Environment International. 2020 Jul
1;140:105825.
38. Grabich SC, Robinson WR, Engel SM, Konrad CE, Richardson DB, Horney JA. Hurricane Charley exposure and
hazard of preterm delivery, Florida 2004. Maternal and child health journal. 2016 Dec;20(12):2474-82.
39. Simmons LE, Rubens CE, Darmstadt GL, Gravett MG. Preventing preterm birth and neonatal mortality:
exploring the epidemiology, causes, and interventions. InSeminars in perinatology 2010 Dec 1 (Vol. 34, No. 6,
pp. 408-415). WB Saunders.
40. Baqui AH, Rosen HE, Lee AC, Applegate JA, El Arifeen S, Rahman SM, Begum N, Shah R, Darmstadt GL,
Black RE. Preterm birth and neonatal mortality in a rural Bangladeshi cohort: implications for health
programs. Journal of Perinatology. 2013 Dec;33(12):977-81.
Page 14/1941. Waring S, Zakos-Feliberti A, Wood R, Stone M, Padgett P, Arafat R. The utility of geographic information
systems (GIS) in rapid epidemiological assessments following weather-related disasters: Methodological
issues based on the Tropical Storm Allison experience. International Journal of Hygiene and Environmental
Health. 2005;208:109–16.
42. Bhunia R, Ghosh S. Waterborne cholera outbreak following Cyclone Aila in Sundarban area of West Bengal,
India, 2009. Transactions of The Royal Society of Tropical Medicine and Hygiene. 2011;105:214–9.
43. Panda S, Pati KK, Bhattacharya MK, Koley H, Pahari S, Nair GB. Rapid situation & response assessment of
diarrhoea outbreak in a coastal district following tropical cyclone AILA in India. The Indian journal of
medical research. 2011 Apr;133(4):395.
44. Sehgal SC, Sugunan AP, Vijayachari P. Outbreak of leptospirosis after the cyclone in Orissa. National
Medical Journal of India. 2002 Feb;15(1):22-3.
45. Loftus C, Afsharinejad Z, Sampson P, Vedal S, Torres E, Arias G, Tchong-French M, Karr C. Estimated time-
varying exposures to air emissions from animal feeding operations and childhood asthma. International
journal of hygiene and environmental health. 2020 Jan 1;223(1):187-98.
46. Evans RW, Hu Y, Zhao Z. The fertility effect of catastrophe: US hurricane births. Journal of Population
Economics. 2010 Jan;23(1):1-36.
47. Anttila-Hughes J, Hsiang S. Destruction, disinvestment, and death: Economic and human losses following
environmental disaster. Available at SSRN 2220501. 2013 Feb 18.
48. Miranda I. The Long-run Effects of Tropical Cyclones on Infant Mortality.2019. Master's Theses. 1187.
49. Finlay J. Fertility response to natural disasters: the case of three high mortality earthquakes. World Bank
Policy Research Working Paper. 2009 Mar 1(4883).
50. Nobles J, Frankenberg E, Thomas D. The effects of mortality on fertility: population dynamics after a natural
disaster. Demography. 2015 Feb 1;52(1):15-38.
51. India Meteorological Department. Electronic Atlas of Tracks of Cyclones and Depressions in the Bay of
Bengal and the Arabian Sea, Version 1.0/2008” CD Rom, India Meteorological Department, Chennai. 2008.
52. Brooks N. Vulnerability, risk and adaptation: A conceptual framework. Tyndall Centre for climate change
research working paper. 2003 Sep;38(38):1-6.
53. Abdullah AN, Zander KK, Myers B, Stacey N, Garnett ST. A short-term decrease in household income
inequality in the Sundarbans, Bangladesh, following Cyclone Aila. Natural Hazards. 2016 Sep;83(2):1103-
23.
54. Burslem DF, Whitmore TC, Brown GC. Short‐term effects of cyclone impact and long‐term recovery of
tropical rain forest on Kolombangara, Solomon Islands. Journal of Ecology. 2000 Dec;88(6):1063-78.
55. Soares MB, Gagnon AS, Doherty RM. Conceptual elements of climate change vulnerability assessments: a
review. International Journal of Climate Change Strategies and Management. 2012 Feb 24.
56. IIPS and ICF. National Family Health Survey (NFHS-4), 2015-16. International Institute for Population
Sciences (IIPS), Mumbai, India.2017.
57. Woodward A, Smith KR, Campbell-Lendrum D, Chadee DD, Honda Y, Liu Q, et al. Climate change and health:
on the latest IPCC report. The Lancet. 2014;383:1185–9. d
58. IDMC, 2020. Global Report on Internal Displacement 2019. www.internal displacement.org/global-
report/grid2019/
Page 15/1959. Oliver-Smith A. Sea level rise and the vulnerability of coastal peoples: responding to the local challenges of
global climate change in the 21st century. UNU-EHS; 2009.
60. Adair LS, Fall CH, Osmond C, Stein AD, Martorell R, Ramirez-Zea M, Sachdev HS, Dahly DL, Bas I, Norris SA,
Micklesfield L. Associations of linear growth and relative weight gain during early life with adult health and
human capital in countries of low and middle income: findings from five birth cohort studies. The Lancet.
2013 Aug 10;382(9891):525-34.
61. Alderman H, Hoddinott J, Kinsey B. Long term consequences of early childhood malnutrition. Oxford
economic papers. 2006 Jul 1;58(3):450-74.
62. Black RE, Allen LH, Bhutta ZA, Caulfield LE, De Onis M, Ezzati M, Mathers C, Rivera J, Maternal and Child
Undernutrition Study Group. Maternal and child undernutrition: global and regional exposures and health
consequences. The lancet. 2008 Jan 19;371(9608):243-60.
63. Hoddinott J. Shocks and their consequences across and within households in rural Zimbabwe. The Journal
of Development Studies. 2006 Feb 1;42(2):301-21.
64. Dey NC, Parvez M, Islam MR, Mistry SK, Levine DI. Effectiveness of a community-based water, sanitation,
and hygiene (WASH) intervention in reduction of diarrhoea among under-five children: Evidence from a
repeated cross-sectional study (2007–2015) in rural Bangladesh. International journal of hygiene and
environmental health. 2019 Sep 1;222(8):1098-108.
65. Prüss-Ustün A, Wolf J, Bartram J, Clasen T, Cumming O, Freeman MC, Gordon B, Hunter PR, Medlicott K,
Johnston R. Burden of disease from inadequate water, sanitation and hygiene for selected adverse health
outcomes: an updated analysis with a focus on low-and middle-income countries. International journal of
hygiene and environmental health. 2019 Jun 1;222(5):765-77.
66. Semba RD, de Pee S, Kraemer K, Sun K, Thorne-Lyman A, Moench-Pfanner R, et al. Purchase of drinking
water is associated with increased child morbidity and mortality among urban slum-dwelling families in
Indonesia. International Journal of Hygiene and Environmental Health. 2009;212:387–97.
doi:10.1016/j.ijheh.2008.09.001.
67. Watson JT, Gayer M, Connolly MA. Epidemics after natural disasters. Emerging infectious diseases. 2007
Jan;13(1):1.
68. Rafa N, Jubayer A, Uddin SM. Impact of cyclone Amphan on the water, sanitation, hygiene, and health
(WASH2) facilities of coastal Bangladesh. Journal of Water, Sanitation and Hygiene for Development. 2021
Mar;11(2):304-13.
69. Dimitrova A, Bora JK. Monsoon weather and early childhood health in India. PloS one. 2020 Apr
10;15(4):e0231479.
70. Bhattacharjee S, Bhattacharjee S, Bal B, Pal R, Niyogi SK, Sarkar K. Is Vibrio fluvialis emerging as a pathogen
with epidemic potential in coastal region of eastern India following cyclone Aila?. Journal of health,
population, and nutrition. 2010 Aug;28(4):311.
71. World Health Organization. WHO-UNICEF joint statement: reducing measles mortality in emergencies. World
Health Organization; 2004.
72. Mohan A, Murhekar MV, Wairgkar NS, Hutin YJ, Gupte MD. Measles transmission following the tsunami in a
population with a high one-dose vaccination coverage, Tamil Nadu, India 2004–2005. BMC Infectious
Diseases. 2006 Dec;6(1):1-6.
Page 16/1973. Mallik S, Mandal PK, Ghosh P, Manna N, Chatterjee C, Chakrabarty D, Bagchi SN, Dasgupta S. Mass measles
vaccination campaign in Aila cyclone-affected areas of West Bengal, India: an in-depth analysis and
experiences. Iranian journal of medical sciences. 2011 Dec;36(4):300.
74. Shaw S, Sahoo H. Accessibility to Primary Health Centre in a Tribal District of Gujarat, India: application of
two step floating catchment area model. GeoJournal. 2020 Apr;85(2):505-14.
75. Olazabal M, de Gopegui MR, Tompkins EL, Venner K, Smith R. A cross-scale worldwide analysis of coastal
adaptation planning. Environmental Research Letters. 2019 Dec 11;14(12):124056.
Figures
Figure 1
BoB coastal districts of India affected by cyclones (100 km inland buffer). Source: Indian meteorological
department, Government of India (IMD)
Page 17/19Figure 2
(a) Number of new displacements due to natural disaster in India; (b) Frequency of cyclones over BoB. Source:
based on https://www.internal-displacement.org/countries/india ;
http://www.imdchennai.gov.in/cyclone_eatlas.htm
Figure 3
Page 18/19Spatial distribution of (a) neonatal mortality rate; (b) Under-5 mortality rate in coastal districts of BoB, 2015-16.
Note: Number of districts follows as the base map (Fig.1) of the study. Source: NFHS4, prepared by authors
Figure 4
Graphs visualizing the scatter plots between vulnerability and Neonatal mortality (a) and Under-5 mortality (b)
across the BoB coastal districts of India. Note: Size of circle proportional to total population of the district, 2011.
Number of districts follows as the base map (Fig.1) of the study. Source: prepared by Authors
Page 19/19You can also read