CLIMATE PRIMER FOR INSTITUTIONAL INVESTORS - Climate Change and Financial Risk - WWF
←
→
Page content transcription
If your browser does not render page correctly, please read the page content below

REPORT
                        Climate Change
  HK                    and Financial Risk
2018

CLIMATE PRIMER
FOR INSTITUTIONAL INVESTORS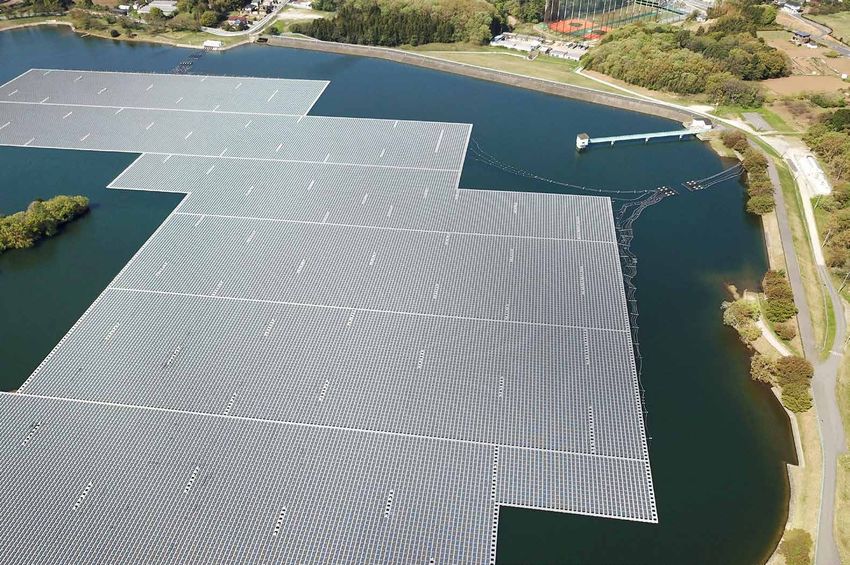
Supported by:

Authors: Sam Hilton | Jean-Marc Champagne

                              Sam Hilton is a Senior Research Analyst
                              for Environmental Finance at WWF-Hong
                              Kong. He was previously an equity research
                              analyst at Keefe Bruyette & Woods and Fox-
                              Pitt, Kelton (acquired by Macquarie) in Hong
                              Kong, where he covered banks, brokers, and
                              exchanges across the Asia-Pacific region.

                              Jean-Marc Champagne is the Head of
                              Environmental Finance at WWF-Hong
                              Kong. He previously worked in equity capital
                              markets, equity research sales, and equity
                              derivative sales for Merrill Lynch in New York
                              City, BNP Paribas, and Jefferies in Hong Kong
                              over a span of 17 years.

Design: Choyo Kwok

Special thanks: Douglas Anderson, Gavin Edwards, Joanne Lee,
Ben Ridley, Tom Swain, Saul Symonds, Kitty Tam and Prashant
Vaze for providing valuable advice on this report.

Publisher: WWF-Hong Kong

© 2018 WWF-Hong Kong. All rights reserved.

WWF is one of the world’s most respected conservation
organizations, with a network active in more than 100 countries.
WWF’s mission is to build a future in which humans live in
harmony with nature, by:
● conserving the world’s biological diversity
● ensuring that the use of renewable natural
  resources is sustainable
● promoting the reduction of pollution and
  wasteful consumption.
WWF-Hong Kong has been working since 1981. In support of
our global mission, WWF-Hong Kong’s vision is to transform
Hong Kong into Asia’s most sustainable city where nature is
conserved, carbon pollution is reduced, and consumption is

                                                                                                                                                                                                                        © Snehal Jeevan Pailkar / Shutterstock.com
environmentally responsible.

Cover*: © 2017 CONOR ASHLEIGH
*A young boy stands on top of a partially submerged seawall in Bairiki, South Tarawa, Kiribati. Kiribati
is a small Pacific nation comprised of 32 low-lying coral atolls and one raised coral island and is one
of the places most vulnerable to climate change in the world.
                                                                                                            Marine Drive, as the name suggests, sits directly along the coastline of Mumbai, India. Nearly 20 million
                                                                                                           residents of Greater Mumbai will be at risk from rising sea levels by 2050 as rapid urbanization increases
                                                                                                                                                                      exposure and vulnerability to climate extremes.

                                                                                                                                                                                                     Climate Primer                                                  01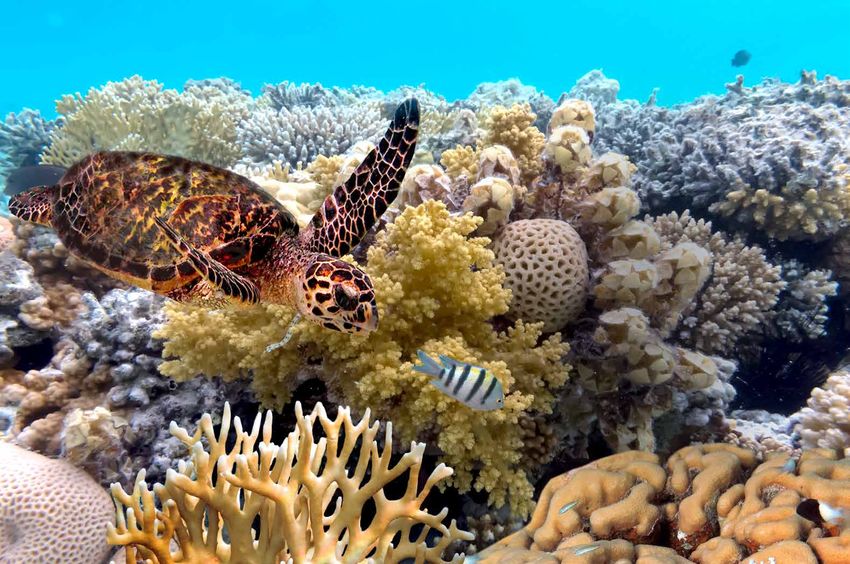
06 30 98 CONTENTS
INTRODUCTION POLICY FINANCE
32 The Paris Agreement 102 Public Finance
07
32 – History: UN Framework and Kyoto 106 Public Finance Players
34 What the Paris Agreement Seeks to Do 106 – Multilateral Development Banks
36 Policy Types 112 – Official Development Assistance
36 – Pricing Carbon 115 – China’s International
38 – Regulatory Standards, Incentives, Development Finance Activities
and/or Prohibitions 116 – Climate-Focused Multilateral Funds
41 Policy Overview by Geography – UNFCCC-related & Climate Investment Funds
EXECUTIVE SUMMARY 42 – United States 121 Private Finance
07 Climate Change in a Nutshell for Investors 42 – European Union-28 124 TCFD: Policy and Voluntary Action Driving
07 The Policy Response to Climate Change 43 – China Climate Integration
08 Approaches to Addressing Climate Change 43 – India 138 Private Finance Players – Potential Climate
08 Climate Finance 44 – Indonesia Integration Actions
44 – Japan 139 – Asset Owners, Asset Managers, and Climate
10
45 – South Korea Change Integration
45 – Other Asia-Pacific 141 – Insurers
48 Implications for Investors 142 – Influencers
SCIENCE
12
12
15
What is Happening and Why?
How is the Climate Changing?
What is Causing Climate Change?
50 146
22 What Does the Near-Future Look Like? TECHNOLOGY CONCLUSION
25 What are the Impacts of Climate Change?
27 How Has Climate Change Manifested in Asia?
52 Mitigation
Implications for Investors
56 Energy
27 Why Act Now and What Can be Done? 56 Renewable Power
148
27 Why Should We Care? 58 – Hydropower
60 – Wind
63 – Solar
66 – Biomass/Geothermal/Marine
70 Carbon Capture & Storage
71 Nuclear Power
71 Fossil Fuel Power ANNEXES AND REFERENCES
74 Energy Storage
148 Annex A: Observed and Projected Impact
77 – Pumped Hydro Storage
of Climate Change in Asia-Pacific
78 – Batteries
162 Annex B: Resource List
82 – Compressed Air Energy Storage
163 References
82 – Flywheel Energy Storage
83 – Hydrogen Energy Storage
85 Smart Grid Technologies
88 New Infrastructure
© Markus Gann / Shutterstock.com
88 – District Energy
89 – Urban Rail
91 – Electrical Charging
95 Adaptation
97 Implications for Investors
Although it’s not predicted that the massive Antarctic ice sheets are likely to melt completely,
even small-scale melting would raise global sea levels, and cause flooding around the world.
02 Climate Primer Climate Primer 03
“Every company, investor, and bank that screens             “Once climate change becomes a clear and present
                                                                     new and existing investments for climate risk is            danger to financial stability it may already be too
                                                                     simply being pragmatic.”                                    late to stabilise the atmosphere at two degrees.”

                                                                                                                JIM YONG KIM                                                                 MARK CARNEY
                                                                                                   President of the World Bank                             Governor of the Bank of England

                                                                     “Fighting climate change isn't just an obligation we        “Get your bosses to go greener and lean on their
                                                                     owe to future generations. It's also an opportunity         portfolio companies to be greener - then you’ll be
                                                                     to improve public health - and drive economic               able to look your grandchildren in the eye.”
                                                                     growth - in the here and now.”
                                                                                                        MICHAEL BLOOMBERG                                                       JEREMY GRANTHAM
                                                                                    Founder, CEO, and Owner of Bloomberg L.P.,      Co-Founder and Chief Investment Strategist of Grantham,
                                                                                                Former Mayor of New York City                                         Mayo, & Van Otterloo
     © Edmund Lowe Photography / Shutterstock.com

                                                                                                                                                               The Pakerisan River flows through the rain forest and tropical jungle on the island of Bali, Indonesia.
                                                                                                                                                                    Forests, especially tropical forests, play an important role in climate change. Trees store carbon
                                                                                                                                                                 through photosynthesis, so deforestation contributes to carbon emissions. Tropical forests contain
                                                                                                                                                                                                                                       about 25% of the world’s carbon.

04                                                  Climate Primer                                                                                                                                                                                     Climate Primer     05
INTRODUCTION EXECUTIVE
SUMMARY
CLIMATE CHANGE PRESENTS AN EXISTENTIAL THREAT Climate Change in a over timescales stretching from years known as Nationally Determined
to centuries, such as sea level rise or Contributions (NDCs). Other key goals
Nutshell for Investors
TO MODERN CIVILISATION. HOWEVER, BECAUSE ITS
changing weather patterns. include: increasing the emphasis on
The science of climate change adaptation, defined as the steps taken
In addition to the physical risks to lessen the impact of climate change
EFFECTS MANIFEST OVER GENERATIONAL TIMESCALES,
is complex, but the story is not involved, investors also face risks from
complicated: on human and natural systems; and
the policy response to climate change. mobilizing USD100 billion per year in
THE PRESENT GENERATION HAS LIMITED INCENTIVE TO 1 The Earth’s atmosphere naturally These include policy and regulatory mitigation and adaptation support by
traps a certain amount of risk, reputational risk and liability or 2025, with a higher funding target to
ADDRESS THE THREAT.
solar radiation as heat via the litigation risk. be established after that.
greenhouse effect.
There are two primary policy paths
2 Carbon dioxide (CO2) is the primary The Policy Response to to encouraging emissions reductions:
gas involved in the greenhouse
In the financial sector, institutional investors are becoming more Climate Change market-based approaches and
effect, due in part to its extremely regulatory approaches. Market-based
aware of the risks presented by climate change, and more willing long life in the atmosphere. Other The global policy response to approaches are generally broader, and
to take action. However, this awareness differs by geography, gases also play a role. climate change began in 1992 with involve pricing carbon in some way,
the signing of the United Nations while regulatory approaches tend to
with relatively lower engagement with the issues in the Asia- 3 By burning fossil fuels, humans
Framework Convention on Climate be more sector-specific. Governments
have significantly increased the
Pacific region. amount of carbon dioxide in the
Change (UNFCCC). It called for are using both approaches in their
“the stabilisation of greenhouse gas efforts to address climate change.
atmosphere.
concentrations in the atmosphere at
For investors, policy or regulatory
This document is intended to provide an introduction to the 4 The higher levels of carbon dioxide a level that would prevent dangerous
action may result in direct or indirect
have trapped more heat, raising anthropogenic interference with the
basics of climate change for the institutional investor community, average global land and ocean climate system.”
effects on their portfolio holdings.
with a focus on Asia-Pacific and the energy sector. It provides an surface temperatures.
The global policy response to climate
The Paris Agreement is an agreement change in large part boils down to
overview of the science of climate change, an articulation of the The increased temperatures have within the UNFCCC which came into significant changes in the energy
global policy response, a survey of technological approaches to numerous consequences that are force in November 2016. It deals with sector, particularly with respect to
the mitigation of GHG emissions, electricity/heat generation. As existing
the problem, and an outline of the various financial entities and already detectable. These include
the adaptation to the impacts of policy commitments are insufficient
rising sea levels, changing weather
resources involved in addressing the issue. patterns, reduced polar ice coverage
climate change, and the financing to get the world on the path to the
of these activities. The parties to 2oC target, let alone the 1.5oC target,
and melting glaciers, higher frequency
the Agreement are in the process of high-carbon energy assets are likely
and/or intensity of extreme weather negotiating the detailed rules required primary targets for further regulatory
events, loss of crucial ecosystems, and to implement it. Although the United activity. Relevant policies for the
increased oceanic acidity. States has formally notified the UN energy and other sectors include
of its intent to withdraw from the carbon taxes, emissions caps, and
All of these climate-related physical
Agreement, this will become effective higher efficiency standards. Investors
effects have risk implications for
no earlier than November 4, 2020. may also be exposed to litigation
investors. Depending on their location, risk for failing to account for these
their portfolio investments may face The primary goal of the Agreement
regulatory or policy risks, should their
higher levels of acute physical risk – is to limit “the increase in the global
holdings be affected materially.
average temperature to well below
these are mainly event-driven risks
2°C above pre-industrial levels,” Finally, investment managers and
from extreme weather events such as
with a stretch target temperature asset owners face an increasing
typhoons, floods, or drought-related increase limit of 1.5°C above those exposure to climate-related
© Kathleen Ricker
fires and may also affect their own levels. Each party to the Agreement reputational risk. This may initially be
operations. In addition, investors with is required to develop, communicate, closely linked with related litigation,
The population of the Adélie penguin (Pygoscelis adeliae) is increasing in Antarctica. However, in
areas where climate change effects are more established, Adélie populations have fallen by more longer-duration assets may be exposed and pursue their own targets and but as climate change impacts become
than 65% in the past 25 years. The biggest threat to them right now is climate change.
to chronic physical risk. These unfold plans for mitigating climate change, more evident, and more attached
06 Climate Primer Climate Primer 07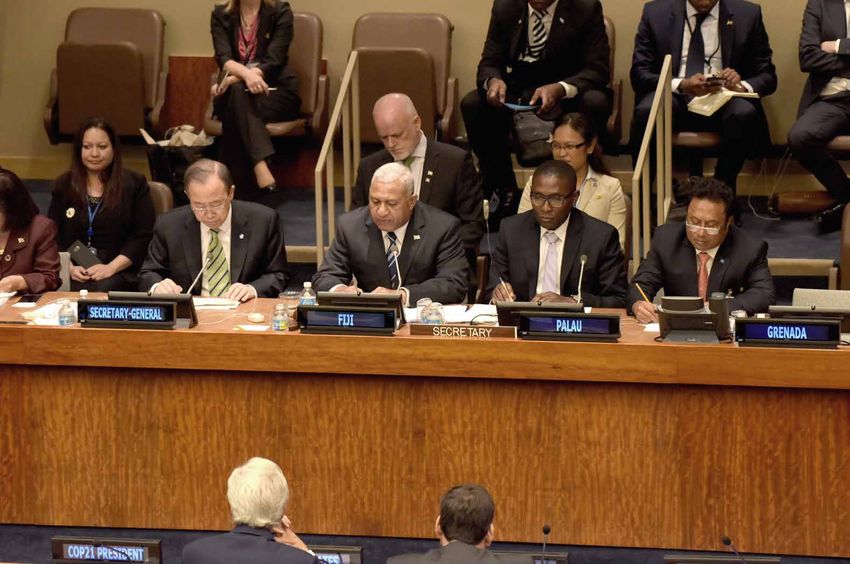
to human stories of lost livelihoods These include renewables, thermal Key areas for investment to support the annual average of the previous two Until that happens, in most cases, The various influencers in the
or negative health outcomes, the power (from fossil fuels or otherwise) this transition include energy years (CPI 2017). indirect investment via equity or debt financial ecosystem play important
reputational risk to the parties involved with or without carbon capture and storage, smart grids, demand- securities is the primary channel supporting roles with respect to the
Public finance is a crucial player
in generating these impacts increases. storage (CCS), and nuclear power. side management, monitoring and through which most institutional investment processes of asset owners
in addressing climate change, in
sensors. Such integration will also investors will be able to apply their and managers. This support ultimately
Renewable power is one of only two particular by getting the private
require adjustments to or a redesign comes down to the provision of
Approaches to Addressing energy sources that does not release of the regulatory regime under which
sector to focus a portion of its far-
capital to address climate change.
information and recommendations
Climate Change greenhouse gases as part of the electricity is delivered. Investment in
larger resource base on the problem. Climate issues have become more
with respect to specific issues
electricity generation process and In combination with the appropriate mainstream in the world of private
appropriate infrastructure and energy institutional investors face or
Responding to climate change unlike nuclear, does not have a long- policies and regulatory environment, finance, and generally fall into the ESG
efficiency also has the potential to decisions they need to make. Because
ultimately takes the form of adaptation term waste disposal issue. In addition, public finance can help stimulate category (environmental, social, and
mitigate energy-related emissions. of this influence, it is critical that asset
and mitigation. Adaptation is the unlike CCS, several renewable power and direct flows of private capital by governance) in industry parlance. A
In particular, district energy, light owners and managers engage with
process of dealing with climate change technologies are already demonstrating demonstrating feasibility, creating 2017 survey by HSBC found that 68%
rail, and electrical charging networks these parties on climate change issues.
impacts that are already happening economic viability and do not require markets, fostering innovation, and of global investors plan to increase
have significant potential to facilitate
or are expected to occur. Mitigation the safe storage of gigatonnes of CO2 reducing risk. In addition, public their investment into climate-related
emissions reductions, both directly
efforts seek to reduce or stabilise the underground every year. As such, the finance also provides critical support or low carbon themes (Knight 2017).
and indirectly.
concentrations of greenhouse gases rapid increase in renewable energy for delivering those public goods – European and US investors were the
in the atmosphere. Mitigating and is one of the primary contributors to such as many adaptation projects – leaders in this regard, with investors
adapting to climate change will require reducing emissions from electricity
Adaptation that the private sector is unwilling or in Asia, and especially the Middle
investments in human capabilities, generation. Renewable resources In the context of climate change, unable to provide. (Amerasinghe, et East, lagging.
communities, systems, and, most include hydropower, wind energy, solar adaptation is defined as action taken al. 2017)
For asset owners and asset managers,
importantly, technology. This presents energy, geothermal heat, ocean energy or investments made to anticipate Public climate finance players the quality and availability of relevant
opportunities for investors. (tides, waves, currents and marine and prevent or reduce the negative include multilateral development information is one of the key barriers
Across the landscape of mitigation and thermal energy) and biomass. effects of climate change on human banks, official development to incorporating climate issues in
adaptation investment, the mitigation Renewables comprised an estimated and natural systems. These effects assistance agencies, other official their investment processes. In part
space offers a wider range of generally fall under the category of sources of funding, and a variety of to address this deficiency, on June
24% of electricity generation in 2016.
investment opportunities and vehicles physical risk discussed in the Science multilateral and bilateral climate 29, 2017, the Financial Stability
In Asia-Pacific, China is the largest
that are compatible with the current chapter and affect areas such as investment funds. All of these players Board’s Task Force on Climate-
player by far, with approximately
investment processes of asset owners agriculture, forestry and fisheries, are involved in some combination related Financial Disclosures (TCFD)
two-thirds of renewable electricity
and managers. This is especially water supply, human health, coastal of mitigation, adaptation, or the issued its final report, providing
generation capacity. While the bulk
the case for those investors whose zones, and infrastructure. building of capacity at the national recommendations on climate-
of installed renewable electricity
mandates focus on secondary market generation capacity is hydropower, This spectrum of affected sectors or subnational level to improve a related financial disclosures that are
instruments such as listed equities. capacity growth is being driven by overlaps significantly with given country’s ability to develop and applicable to organisations across
Asset owners and managers who are solar photovoltaic and wind energy. development assistance. As a implement climate projects. sectors and jurisdictions. If adopted
able to provide direct investment or result, much of the investment into widely, the recommendations will
Investment flows into renewable The private finance ecosystem can
debt finance in particular are less adaptation is driven by the public normalise and improve the standards
energy have been strong for over a play both direct and indirect roles with
limited in their investment options, sector, including governments, of corporate climate risk disclosures,
decade, with total new investment respect to addressing climate change.
as across both the mitigation and official development assistance, allowing investors to better assess
in 2016 of USD242bn representing The private sector is the predominant
adaptation spaces, market rate debt and multilateral institutions. This their own climate-related portfolio
a compound annual growth rate of source of direct investment in
via project or corporate finance is the implies that most potential adaptation risk and provide this information to
15% since 2004. Exit prospects for mitigation, led by project developers,
primary form of project funding. investments will have some form of their clients and beneficiaries. The
investors are also well-established, with non-bank private financial
public finance linkage, whether in the disclosing organisations themselves
with aggregate M&A transactions intermediaries currently playing a
Mitigation reaching USD110bn in 2016, up 10
form of a public-private partnership smaller role.
will also benefit from the process,
or via instruments such as green gaining a better understanding of the
The energy sector is the primary focus times from 2004. Most exits (by dollar bonds or project bonds. It also implies This smaller direct role is a function of real financial implications of climate-
of mitigation efforts, as it comprises value) are via project acquisition / that pure-play exposure to adaptation the structure of the financial system, related risks and their potential
almost 70% of global emissions of refinancing or through corporate investments via listed equities is which tends to focus on more mature impacts on business models, strategy
greenhouse gases (CAIT 2015). Other M&A, although public markets and uncommon; rather, such exposure is sectors with relatively high minimum and cash flows.
key areas include energy efficiency private equity buyouts also play a embedded in the companies that may funding needs. This does not match up
role. (Frankfurt School-UNEP Centre/ Asset owners as well as asset managers
and land use / afforestation. In be involved. well with the comparative newness of
BNEF 2017) need to integrate the assessment
Asia-Pacific, the energy sector’s the various technologies and business
of climate change issues into their
emissions share of 70% is similar to models involved in delivering climate
The prominent role expected of operations and investment processes.
the global level, and is driven largely
renewable power generation as
Climate Finance investment, nor with the limited scale
Ideally, this would be driven from
by the largest emitters, China and of many projects.
part of the transition to low-carbon Climate finance flows originate the top – with the board level
India. Within the energy sector,
generation requires additional ultimately from public or private This mismatch is precisely why public establishing the asset owner’s climate-
the electricity / heat generation
investments in supporting sources. On the public side are financial institutions are involved: related beliefs, policies and targets,
sub-sectors comprise the largest
technologies. This is due to the governments and various public to accelerate the development of the and communicating them down the
component, at almost 30% of global
variability and intermittency of financial intermediaries, while the climate mitigation and adaptation organisation. For asset managers,
emissions. This prominence makes
certain renewables (known as variable private side includes corporates, investment space such that perceived the need for such integration is
them the natural primary target for
renewable energy, or VRE) – in many households, project developers, and risk of these projects is lowered to partially about client service – asset
emissions reduction efforts.
cases, the grid and/or the regulatory private financial intermediaries. In the point that those institutional owners with climate processes will
The technologies involved in mitigating regime have to adapt to integrate 2015-16, climate finance flows from investors – asset owners as well as likely have a preference for engaging
emissions from electricity generation their power in a cost-effective and public and private sources averaged asset managers – capable of providing asset managers with complementary
range from speculative to fully mature. sustainable manner. USD410bn per year, 12% more than direct finance are able to get involved. capabilities.
08 Climate Primer Climate Primer 09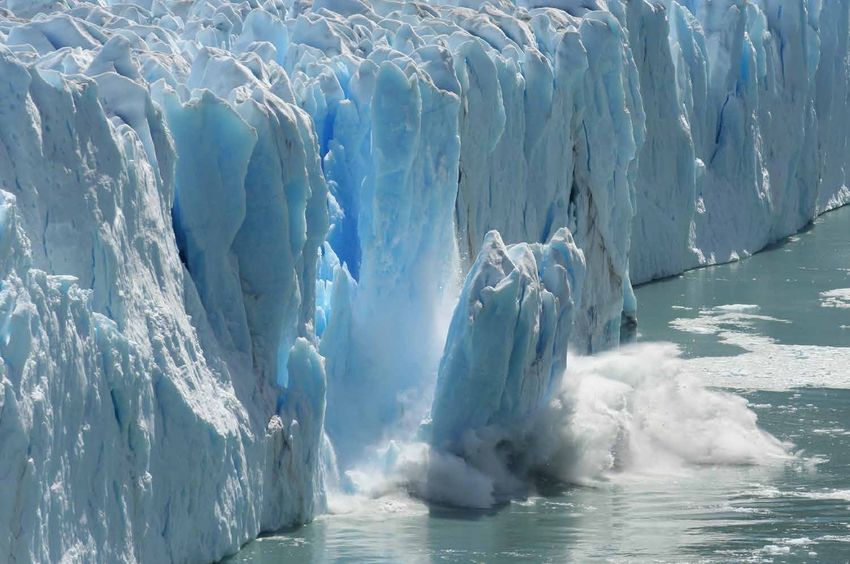
SCIENCE

                                           Even if CO2 emissions cease
                                           immediately, the world
                                           will continue warming for
                                           several decades, due to the
                                           delay in climatic effects.

                                                                                                                                                                        © Vlad61 / Shutterstock.com
                                                         The Great Barrier Reef is one of the world’s richest ocean environments, home to more than 1,500 species
                                                           of fish, six of the world’s seven species of threatened marine turtles, and more than 30 species of marine
 © Global Warming Images / WWF                          mammals. Rising temperatures from climate change are driving mass coral bleaching and also turning green
                                                                                                        turtle (Chelonia mydas) populations almost completely female.

10   Climate Primer                                                                                                                       Climate Primer        11
0.0
-0.2
-0.4
-0.6
1880 1890 1900 1910 1920 1930 1940 1950 1960 1970 1980 1990 2000 2010
Figure 3: Global Land Surface Temperature Relative
to 20th Century Average (oC)
On land, in each of the past three
2.0
decades, global surface temperatures
grew progressively warmer, and those
1.5
WHAT IS HAPPENING
30 years were hotter than any other
similar period over the past 800
1.0
years (IPCC 2014). Indeed, 16 of the
AND WHY? How is the Climate Changing? 0.5
17 hottest years on record came after
2001 (NASA 2017).
0.0
Climate is the typical weather that occurs in a given location at a The evidence is clear that the world is warming.
given time of year. Climate change is an alteration in these usual Time-series metrics tracking indicators such as
-0.5
weather patterns, such as a shift in when temperatures begin to temperature, sea ice, precipitation, and sea level all
rise after winter or when the rainy season starts. Because of the show a warming trend that is accelerating, leading
-1.0
natural variability in the weather, climate change is measured to climate change. It is also clear that human 1880 1890 1900 1910 1920 1930 1940 1950 1960 1970 1980 1990 2000 2010
in time scales of multiple decades or longer. At the global level, influence, particularly the ever-increasing emission
climate change can manifest in multiple ways, such as a change of greenhouse gases (GHGs), is the primary driver
in the Earth’s temperature, or changes in the location, timing, or of this process.
Source: NOAA (2017a)
intensity of rainfall.
Figure 4: Trends in Annual Precipitation Over Land, 1901-2010
Figure 1: Global Land & Ocean Surface Temperature Relative Temperature
to 20th Century Mean (oC)
The Earth’s average surface
OBSERVED CHANGE IN ANNUAL PRECIPITATION OVER LAND
1.2 temperature (land and ocean) has
increased approximately 1.1oC since 1901– 2010
1.0
the late 1800s. This is about 10 times
0.8 faster than post-ice age warming
0.6 episodes over the past million years,
1.2
when the planet’s temperature
0.4
1.0 increased 4-7oC over approximately
0.2
0.8 5,000 years (NASA 2017). Precipitation
0.0
0.6
Observed precipitation over land has
-0.2
0.4 increased by approximately 1-3mm
-0.4
0.2 per decade (on a globally averaged
-0.6 basis) since 1901, with higher
0.0
1880 1890 1900 1910 1920 1930 1940 1950 1960 1970 1980 1990 2000 2010 increases seen since 1951. Although
-0.2 confidence in this observation at the
-0.4 Source: NOAA (2017a) global level is not strong due to data
availability issues, trends are clearer
-0.6 1951– 2010 at some regional and latitudinal levels.
1880 1890 1900 1910 1920 1930 1940 1950 1960 1970 1980 1990 2000 2010
1.0 In particular, precipitation in the mid-
Figure 2: Global Ocean Surface Temperature Relative latitudes of the Northern Hemisphere
o
to
0.8 20th Century Mean ( C)
has increased over the past century,
0.6 Ocean warming is the predominant while tropical precipitation has
1.0 way in which increased energy in the increased over the past decade.
0.4
climate system is absorbed. From (IPCC 2013)
0.8
0.2 1971-2010, over 90% of the increased
0.6
0.0 energy was stored this way, with only
about 1% in the atmosphere. This
0.4
-0.2 warming is strongest near the ocean
0.2
-0.4 surface, with the upper 75m increasing
in temperature by 0.11oC per decade
0.0
-0.6 since 1971. (IPCC 2014)
1880 1890 1900 1910 1920 1930 1940 1950 1960 1970 1980 1990 2000 2010
-0.2
-0.4
-100 -50 -25 -10 -5 -2.5 0 2.5 5 10 25 50 100
-0.6
2.0
1880 1890 1900 1910 1920 1930 1940 1950 1960 1970 1980 1990 2000 2010 (mm yr per decade)
-1
Source: NOAA (2017a) Source: IPCC (2013)
1.5
12 Climate Primer Climate Primer 13
1.0
2.0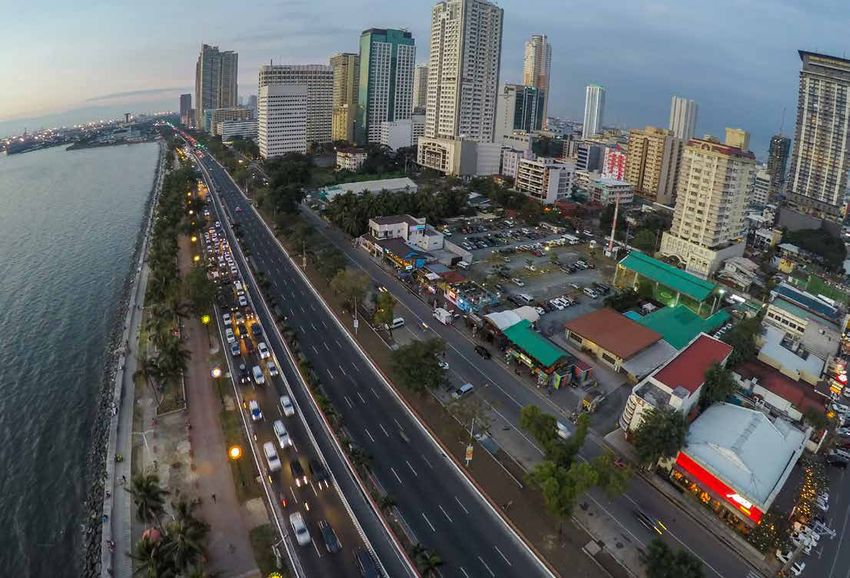
Figure 5: Global Mean Sea Level Sea Level Rise
Change Since 1880
From 1901-2010, the global mean
250 sea level rose 1.7mm per year (0.19m
Global Mean Sea Level Change total), and the rate of increase over the
200 past 150 years is higher than the mean
What is Causing Climate Change?
250 rate seen over the past 2000 years.
150
Global Mean Sea Level Change This rate is continuing to increase:
Millimeters
200 100 from 1993-2010, the rate of increase
was 3.2mm/year. (IPCC 2014)
150 50
Sea level rise is driven by the melting The Greenhouse Effect The greenhouse effect as applied to the climate
Millimeters
100 0 of land-based ice and by thermal works in a similar way. When solar radiation
expansion (water expands as it A physical greenhouse is an enclosed space where the walls and reaches the Earth, some of the energy is reflected
50 -50 roof are made of glass. It warms the enclosed space by allowing
warms). Between the 1970s and the by the Earth and atmosphere, and some is absorbed
0 early 2000s, the contributions of sunlight to enter and by trapping the heat generated. The by the ground, clouds, and greenhouse gases. This
-100
these two factors to sea level rise warmer temperature in the greenhouse causes the ground and absorbed energy is re-emitted in all directions as
1880 1900 1920 1940 1960 1980 2000 2010
-50 was approximately equal. However, plants inside to release more water vapor, which in turn absorbs infrared radiation, warming the Earth’s surface and
the rate of melting of land-based ice additional heat, warming the greenhouse further. lower atmosphere. (IPCC 2013)
Note: Tidal gauge data from 1880-2013.
-100 has continued to increase and over
Source: Church & White (2011) via CSIRO
1880 1900 1920 1940 1960 1980 2000 2010
the past decade the contribution of
melting to sea level rise is now almost Figure 7: The Greenhouse Effect
double that of thermal expansion.
(NOAA 2017b)
THE GREENHOUSE EFFECT
Some of the infrared radiation passes
Figure
500
6: Ocean Dissolved Carbon Dioxide Levels
8.20
and Acidity, Ocean Acidification through the atmosphere but most is
Selected Locations, 1983-2015 Bermuda Bermuda
absorbed and re-emitted in all directions
450 8.15
The ocean is one of the primary sinks SOLAR RADIATION POWERS
THE CLIMATE SYSTEM. by greenhouse gas molecules and clouds.
500 400 8.20 8.10 for the additional carbon dioxide
The effect of this is to warm the Earth’s
Bermuda Bermuda released into the atmosphere. As
450 350 8.15 8.05 surface and the lower atmosphere.
increased CO2 has dissolved into the
400 300 8.10 8.00 ocean, it has become more acidic –
since the beginning of the industrial
350 250 8.05 7.95 era, the pH of ocean surface water has Some solar radiation is
reflected by the Earth and the
DISSOLVED CARBON DIOXIDE (PARTIAL PRESSURE IN MICRO-ATMOSPHERES)
1980 1990 2000 2010 2020 1980 1990 2000 2010 2020dropped by 0.1 which translates into
300 8.00
a 26% increase in acidity, as pH is atmosphere.
250 500 7.95 8.20 measured on a logarithmic scale.
ATMOSPHERE
Canary Islands Canary Islands
DISSOLVED CARBON DIOXIDE (PARTIAL PRESSURE IN MICRO-ATMOSPHERES)
1980 1990 2000 2010 2020 1980 1990 2000 2010 2020
450 8.15
PH (LOWER PH = MORE ACIDIC)
500 400 8.20 8.10
Extreme Climate Events
Canary Islands Canary Islands
450 350 8.15 8.05 Observed extreme climate events have
PH (LOWER PH = MORE ACIDIC)
300 8.00
increased since 1950. For temperature
400 8.10
events, these generally comprise less
350 250 8.05 7.95 frequent cold temperature episodes,
1980 1990 2000 2010 2020 1980 1990 2000 2010 2020and more frequent hot temperature
300 8.00
episodes. In addition, the frequency
250 500 7.95 8.20 of heat waves has increased across Infrared radiation is emitted
1980 1990 2000 2010 2020
Hawaii
1980 1990 2000 2010 2020
Hawaii much of Europe, Asia, and Australia. from the Earth’s surface.
450 8.15 In terms of precipitation, heavy
400 8.20 8.10
precipitation events have increased
500
Hawaii Hawaii in frequency and intensity in North
450 350 8.15 8.05 America and Europe, as has North
Atlantic tropical cyclone activity (since
400 300 8.10 8.00
1970). (IPCC 2014) About half the solar radiation
7.95
is absorbed by the Earth’s surface
350 250 8.05
and warms it.
1980 1990 2000 2010 2020 1980 1990 2000 2010 2020
300 8.00
YEAR YEAR
250 7.95
1980 1990 2000 2010 2020 1980 1990 2000 2010 2020
YEAR YEAR
Source: U.S. EPA (2016)
14 Climate Primer Source: IPCC (2007)
Historically, this has been a natural phenomenon – without Greenhouse Gases
the warming role played by these gases, the Earth would be a
much colder planet, and it is possible that life would not have The largest contributor to warming is carbon
Climate change happens when there is a shift in the energy
evolved without the warmer temperatures resulting from the heat dioxide, followed by methane (CH4), Nitrous oxide
balance of the climate system. Human activity since the
trapped by the gases. Conversely, the example of Venus shows (N20), and the various synthetic F-gases (fluorinated
industrial revolution has resulted in a dramatic increase in the
the temperature effect of a high concentration of atmospheric gases such as chlorofluorocarbons (CFCs) and their
concentrations of greenhouse gases in the atmosphere. These
greenhouse gases (see Figure 8). relations). Aerosols contribute a modest net cooling
gases increase the amount of energy, and thus heat, contained in
the climate system. The contribution to warming by the various effect, although with high uncertainty. Water vapour
gases is quantified through a process known as radiative forcing. is the most abundant greenhouse gas. However, due
Figure 8: Planetary comparison of atmospheric CO2 and This is measured in watts per square meter (W/m2) and is the to its short duration in the atmosphere (days, rather
average temperature difference between sunlight absorbed by the Earth and the than years), it acts via feedback, rather than as a
energy radiated back into space. A positive figure for radiative forcing agent, amplifying the temperature effects of
forcing will lead to net surface warming (increased energy in the the other greenhouse gases – NASA suggests that
Venus climate system), while a negative figure leads to net cooling of
the Earth’s surface.
water vapour may double the warming effect of CO2
alone (NASA 2008).
Thick atmosphere
Mainly (96.5%) comprised of CO2
Average temperature +420oC Mars
Thin atmosphere
Almost all CO2 in ground 95.3% Figure 9: Global Atmospheric Concentrations of Carbon Dioxide
Average temperature -50oC Carbon Dioxide Over Time
CO2 is a warming gas and currently
800,000 BCE to 2015 CE 1950 to 2015 CE comprises approximately 410 parts
450 per million (ppm), or 0.041%, of the
400 Earth’s atmosphere by volume. In
SUN
addition to the natural processes of
350 the carbon cycle, where it circulates
CARBON DIOXIDE CONCENTRATION (PPM)
300
among the atmosphere, the oceans,
800,000 BCE to 2015 CE 1950 to 2015 CE
450 soil, plants and animals, CO2 is
Mercury 250
400
released into the atmosphere through
Thin atmosphere human activities such as burning fossil
200
Below 1% CO2 350
fuels, cement production and flaring,
as well as through changes in land
CARBON DIOXIDE CONCENTRATION (PPM)
150
Average temperature +179oC
300 use such as deforestation, particularly
Earth 100
250
through burning. Deforestation has
Thick atmosphere 50 also reduced the capacity of natural
CO2 comprises 0.041% 200 carbon sinks to remove carbon dioxide
0
Average temperature 15oC from the atmosphere.
150 -800,000 -600,000 -400,000 -200,000 0 1950 1960 1970 1980 1990 2000 2010 2020
Year (negative values = BCE) Year For at least 800,000 years prior to the
100
Industrial Revolution, atmospheric
Source: WWF presentation: “Climate Finance - Investing for Life on Earth”
50 Source: U.S. EPA (2016) concentrations of CO2 fluctuated
Land-Use Change Fossil Fuel Combustion
between about 200-250 ppm, with a
0 45 2,500 few spikes up to a maximum of 300
Figure10:
-800,000 Annual-400,000
-600,000 and Cumulative -200,000 Global
0 Anthropogenic
1950 CO21990
1960 1970 1980 Emissions,
2000 2010 2020
40 ppm. Since the Industrial Revolution,
GtCO2, 1870-2016
“HUMAN ACTIVITY SINCE THE
Year (negative values = BCE) Year
35 2,000 the CO2 level has passed 400 ppm
and is rising at an accelerating rate:
INDUSTRIAL REVOLUTION HAS
30
Land-Use Change Fossil Fuel Combustion while the average rate of increase in
1,500
45 25 2,500 the 1980s and 1990s was 1.5 ppm per
RESULTED IN A DRAMATIC
year, it was 2.2 ppm per year during
40 20 1,000 the 10 years to 2017. In 2016, the CO2
35 15 2,000
INCREASE IN THE CONCENTRATIONS
concentration increased by 2.9 ppm,
30 10 500 second only to the increase in 2015
OF GREENHOUSE GASES IN THE
1,500 (NOAA 2017c).
25 5
20 0 0
ATMOSPHERE.”
1870 1890 1910 1930 1950 1970 1990 2010 1,000 1870 - 1970 1870 - 2016
15
10 500
800,000 BCE to 2015 CE 1950 to 2015 CE
5
2,000
0 0
1870 1890 1910 1930 1950 1970 1990 2010 1870 - 1970 1870 - 2016
1,500
METHANE CONCENTRATION (PPB)
Source: Quéré, et al. (2017)
800,000 BCE to 2015 CE 1950 to 2015 CE
2,000
1,000
16 Climate Primer Climate Primer 17
1,500
N (PPB)
50025025
CARBON DIOXIDE CONCEN
20020
1,000
15
150
10 500
100
5
50
0
Figure 11: Global Atmospheric Concentrations of 0
Methane (CH4) Figure 13: Global Atmospheric Concentrations of Fluorocarbons (F-gases)
0 1870
Methane 1890 Time
Over 1910 1930 1950 1970 1990 2010 1870 - 1970 1870 - 2016 F-Gases Over Time
-800,000 -600,000 -400,000 -200,000 0 1950 1960 1970 1980 1990 2000 2010 2020
Methane currently comprises The various F-gases (and other
Year (negative values = BCE) Year
800,000 BCE to 2015 CE 1950 to 2015 CE approximately 1,840 parts per Ozone-depleting substances Other halogenated gases halocarbons) do not exist in nature;
2,000 billion (ppb), or 0.00018%, of the their concentration in the atmosphere
1,000
Land-Use Change Fossil Fuel Combustion Earth’s atmosphere by volume. With CFC-12 all stems from human activity. These
45 2,500 an atmospheric lifetime of about a HCFC-22 include refrigeration, industrial
1,50040 decade, it is much shorter-lived in processes such as aluminium
100 PFC-14
the atmosphere than carbon dioxide. production and semiconductor
METHANE CONCENTRATION (PPB)
35 2,000 Methyl chloroform
However, methane traps heat more HCFC-141b HFC-134a manufacturing, and the transmission
CONCENTRATION (PPT)
30 effectively; on a 100-year time scale, and distribution of electricity. While
1,000 1,500 HFC-125
25
it contributes 28 times the radiative 10 their atmospheric concentrations
HFC-23
forcing effect as an equivalent Sulfur
are extremely low, measured in parts
20
1,000 amount CO2. In addition to natural Halon-1211
hexafluoride
PFC-116 per trillion, their lifespan in the
50015 sources such as wetlands, the gas is atmosphere can be extremely long,
1
10 released into the atmosphere through PFC-116 ranging from 300 years to 50,000
500
human activities such as energy use, Nitrogen years. Depending on the gas, they
5 trifluoride
agriculture and livestock, and biological contribute between 10,000-20,000
00 0 waste decomposition. Human activities 0.1 times the radiative forcing effect as an
-800,000
1870 -600,000 1910-400,0001930 -200,000
1890 1950 0
1970 19501990 1960 2010
1970 1980 1990 2000 1870
1870 - 1970 2010- 20162020
account for approximately 70% of 1975 1985 1995 2005 2015 1975 1985 1995 2005 2015 equivalent amount CO2 on a 100-year
Year (negative values = BCE) Year
methane emissions. Year time scale, and many are only removed
from the environment through
800,000 BCE to 2015 CE 1950 to 2015 CE Source: U.S. EPA (2016) During pre-industrial times, Source: U.S. EPA (2016)
2,000 800,000 BCE to 2015 CE 1950 to 2015 CE interaction with sunlight in the upper
atmospheric concentrations of CH4
350 Ozone-depleting substances reaches
Other halogenated gasesof the atmosphere.
fluctuated between about 400-
600 ppb, with a few spikes up to a 1,000 NOx
300 CARBON CFC-12NMVOCs
1,500 maximum of 700-800 ppm. Since the
3.50
Aerosols NITROUS MONOXIDE +0.10
GASES
-0.15
AEROSOLS
(DIRECT) AEROSOLS
Industrial Revolution, the CH4 level HALO- OXIDE +0.23 HCFC-22
(PPB)
-0.27 (CLOUDS)
CONCENTRATION(PPB)
250 3.00 CARBONS +0.17
has passed 1,800 ppb and is rising Aerosols are
METHANE particles (liquid
or solid)100 fuels. Aerosols can -0.55 have either a TOTAL
+0.18 LAND USEPFC-14
OXIDE CONCENTRATION
at an accelerating rate: following small enough to remain suspended HUMAN
200 2.50 +0.97 Methyl chloroform warming or cooling effect ALBEDOon the FORCING HFC-134a
1,000 HCFC-141b THE SUN*
a brief plateau in the early 2000s, in the air. Natural examples include climate, depending on -0.15
whether the +2.29
CONCENTRATION (PPT)
+0.05
150 methane concentrations increased 2.00 volcanic aerosols, desert dust (wind-
CARBON suspended particles reflect or absorb HFC-125
METHANE
DIOXIDE 10
by an average of 5.7 ppb per year blown), and fog, while human- incoming sunlight. On aggregate, HFC-23
NITROUS
from 2007-2013 and since then has 1.50 +1.68
generated aerosols include smoke Sulfur
500
100 aerosols exert a net cooling effect, hexafluoride
accelerated to an average of 10.1 ppb from burning tropical forests, as well Halon-1211
countering an estimated 30% of the PFC-116
per year through 2016 (NOAA 2017c). 1.00 as black soot and sulphate1 aerosols
50 warming effect from the primary
resulting from the burning of fossil greenhouse gases since 1750. PFC-116
0 0.50 Nitrogen
0-800,000 trifluoride
Figure
-800,000
12: Global
-600,000 Atmospheric
-600,000
-400,000
-400,000
Concentrations
-200,000
-200,000
0
0
1950 of
1960
1950 1960
1970
1970
1980 1990
1980 1990
2000
2000
2010
2010
2020
2020 Nitrous Oxide (N2O)
Nitrous Oxide Over Time
Year (negative values = BCE) Year 0.00 0.1
Year (negative values = BCE) Year 1975 1985 1995 2005 2015 1975 1985 1995 2005 2015
Nitrous oxide currently comprises
2 Year
800,000 BCE to 2015 CE 1950 to 2015 CE approximately 327 ppb, or 0.00003%, Figure 14: Radiative Forcing (W/m ) In 2011 Relative
350 of the Earth’s atmosphere by volume. To 1750 By Emitted Compounds
It persists in the atmosphere for over 60
300 a century and contributes over 250
times the radiative forcing effect as 50 NOx F-Gas
3.50 CARBON AEROSOLS
NITROUS OXIDE CONCENTRATION (PPB)
250 an equivalent amount CO2 on a 100- NMVOCs GASESN2O ex-LUCF
NITROUS MONOXIDE (DIRECT)
+0.10 -0.15 CH4 ex-LUCF AEROSOLS
year time scale. Approximately 40% of 40 HALO- OXIDE +0.23 -0.27 (CLOUDS)
200 3.00 CARBONS
emissions come from human sources, +0.17 LUCF (Gross)
GtCO2e
METHANE +0.18 -0.55 TOTAL
primarily agriculture, transportation 30 CO2 ex-LUCF LAND USE HUMAN
2.50 +0.97 ALBEDO
150 THE SUN* FORCING
and industrial processes, while the -0.15
remaining 60% stems from the 20 +0.05 +2.29
2.00 CARBON
100 nitrogen cycle, mainly from bacteria. DIOXIDE
10 1.50 +1.68
50 From 800,000 years ago until the
Industrial Revolution, atmospheric 0 1.00
0 concentrations of N2O were centred at 1990 1995 2000 2005 2010
-800,000 -600,000 -400,000 -200,000 0 1950 1960 1970 1980 1990 2000 2010 2020 about 250 ppb ±50 ppb. Since then, the 0.50
Year (negative values = BCE) Year N2O level has approached 330 ppb and
is rising at an accelerating rate: in the 0.00
Source: U.S. EPA (2016) 10 years to 2015, the rate of increase
was 0.90 ppb per year, as compared
to 0.78 ppb per year for the 10 years Note: Simplified version of Figure SPM.5 from IPCC WG1 AR5. In particular, uncertainty ranges have been omitted. The total
to 2005, and 0.67 ppb per year for the anthropogenic radiative forcing for 2011 relative to 1750 is 2.3 W/m2 (uncertainty range 1.1 to 3.3 W/m2). This corresponds to
60 a CO2-equivalent concentration of 430 ppm (uncertainty range 340 to 520 ppm). *The sun is a natural change
previous 10 years. (US EPA 2016) Source: IPCC (2013). Figure concept from Shrink That Footprint
50 F-Gas
N2O ex-LUCF
18 Climate Primer
40 CH4 ex-LUCF
Climate Primer 19
LUCF (Gross)
GtCO2e
30 CO2 ex-LUCF2.00 CARBON
DIOXIDE
1.50 +1.68
1.00
0.50
0.00 Recent Greenhouse Gas
Figure 15: Total Annual Anthropogenic GHG Emissions Emissions Trends
by Gases 1990-2014
From 1970-2014, annual human-
60 derived GHG emissions continued
to increase, with the size of the
50 F-Gas increase growing between 2000 and
N2O ex-LUCF 2014. In this latter period, emissions
40 CH4 ex-LUCF (measured in gigatons of CO2-
LUCF (Gross) equivalent amounts, or GtCO2e) grew
GtCO2e
30 CO2 ex-LUCF by 0.8 GtCO2e (2.0%) per year, as
compared with 0.4 GtCO2e (1.3%)
20 per year for the previous 30 years.
This occurred despite an increasing
10 number of climate change mitigation
policies. Anthropogenic GHG
0 emissions in 2014 were 52 GtCO2e,
1990 1995 2000 2005 2010
and the total amount released from
Note: LUCF = Land Use Change & Forestry. Presented on gross basis, i.e., excludes LUCF 2000-2014 was the highest in human
removals of GHGs. F-Gas = fluorinated gases covered under the Kyoto Protocol. history. (IPCC 2014)
Source: CAIT (2015); FAO (2014)
Greenhouse Gas Emissions
Projections
© Jixin YU / Shutterstock.com
The Intergovernmental Panel on Climate 66% probability of limiting the global temperature increase in
Change (IPCC) condenses its modelling of future 2100 to 1oC above the 1986-2005 reference period (and 2oC above
greenhouse gas emissions and atmospheric GHG pre-industrial temperatures).
concentrations, air pollutant emissions, and land A power plant in Inner Mongolia, China. Sub-critical coal-fired power plants are found across Asia-Pacific
and release greenhouse gases including carbon dioxide, contributing to the rise in global temperatures.
use, and the resulting impact on the climate into RCP8.5 is the highest GHG emissions scenario and is associated
4 scenarios. These are known as “Representative with a temperature increase of 3.7oC by 2100. While there is
Concentration Pathways,” and are referred to as no explicit “business-as-usual” scenario, the IPCC notes that
RCP2.6, RCP4.5, RCP6.0 and RCP8.5, in increasing “scenarios without additional efforts to constrain emissions” fall
order of emissions, with the numbers referring to between RCP6.0 and RCP8.5. Figure 16: GHG emissions forecasts of
the level of radiative forcing in watts/m2. the four primary IPCC scenarios
The key implication of this range of scenarios is that either drastic
The first scenario, RCP2.6, is the most aggressive in action is taken on GHG emissions, or dangerous climate change (a) CO2 emissions (b) CH4 emissions
terms of limiting emissions and removing significant prevails. Both outcomes have implications for the financial sector,
amounts of carbon from the atmosphere. It reflects which are discussed later in this and subsequent chapters. 200 1000
Historical WGIII scenarios categorized by 2100
the future emissions profile required for at least a 800 emissions CO2-eq concentration (ppm), 5 to 95%
>1000
100 RCP scenarios
720−1000
(TgCH4/yr)
600
(GtCO2/yr)
Table 1: Projected change in global mean surface temperature and global mean RCP8.5
580−720
RCP6.0
sea level for the mid- and late 21st century, relative to 1850-1900 400 RCP4.5
530−580
0 480−530
RCP2.6
430−480
2046-2065 2081-2100 200
Full range of the WGIII AR5
scenario database in 2100
Scenario Mean Likely range Mean Likely range -100 0
1950 2000 2050 2100 1950 2000 2050 2100
RCP2.6 1.6 1.0 to 2.2 1.6 0.9 to 2.3 YEAR YEAR
Global Mean Surface
RCP4.5 2.0 1.5 to 2.6 2.4 1.7 to 3.2 CO2-eq concentration (ppm)
Temperature Change (oC) (c) N2O emissions (d) SO2 emissions (e)
relative to pre-industrial 250 500 750 1000 1500
RCP6.0 1.9 1.4 to 2.4 2.8 2.0 to 3.7 30 150
period RCP8.5
RCP8.5 2.6 2.0 to 3.2 4.3 3.2 to 5.4 RCP6.0 Other Anthropogenic
20 100 RCP4.5 CO2 CH4 N2O
Scenario Mean Likely range Mean Likely range
(TgN2O/yr)
(TgSO2/yr)
RCP2.6 Halocarbons
Total
RCP2.6 0.41 0.34 to 0.49 0.57 0.43 to 0.72 10 50 WGIII
Global Mean scenarios
Sea Level Rise (m) RCP4.5 0.43 0.36 to 0.50 0.64 0.49 to 0.80 5 to 95%
relative to pre-industrial RCP6.0 0.42 0.35 to 0.49 0.65 0.50 to 0.80
0 0
period 1950 2000 2050 2100 1950 2000 2050 2100 -2 0 2 4 6 8 10
RCP8.5 0.47 0.39 to 0.55 0.80 0.62 to 0.99 YEAR YEAR Radiative forcing in 2100 relative to 1750 (W/m2)
Note: Adds 0.61oC to surface temperatures and 0.17m to mean sea level to compare with pre-industrial figures (1850-1900).
Source: IPCC (2014) Source: IPCC (2014)
20 Climate Primer Climate Primer 210
2000 2050 2100 1950 2000 2050 2100
YEAR YEAR
CO2-eq concentration (ppm)
N2O emissions (d) SO2 emissions (e)
250 500 750 1000 1500
150
RCP8.5
RCP6.0 Other Anthropogenic
100 RCP4.5 CO2 CH4 N2O
(TgSO2/yr)
RCP2.6 Halocarbons
Total
50 WGIII
scenarios
5 to 95%
Mean over
What Does the Near Future
1.0
0 2081–2100
2000 2050 2100 1950 2000 2050 2100 -2 0 2 4 6 8 10
Look Like?
0.8
YEAR YEAR Radiative forcing in 2100 relative to 1750 (W/m2)
0.6
(m)
0.4
Figure 17: Projected Global Average Ocean Surface Temperature Temperature Scenarios Figure 19: Projected Global Mean Sea Level Sea Level Rise
RCP8.5
Change Relative to 1986-2005 Rise Relative to 1986-2005
RCP6.0
RCP4.5
0.2
Ocean warming is projected to All forecast scenarios have the global
RCP2.6
continue, particularly at the surface in Mean over average sea level rising faster than
3.00 1.0
the tropics. At lower depths, the most 2081–2100 the observed rate of 2mm/year from
2000 2020 2040
RCP8.5
2060 2080 2100 warming is expected in the Southern 1971-2010, with the highest-emission
YEAR
RCP6.0 Ocean. Ocean warming will also lead 0.8 RCP8.5 scenario expecting 8-16 mm
2.0 RCP4.5
RCP2.6
to continued reductions in sea ice per year for the final two decades of
historical cover in the Arctic Ocean. Indeed, 0.6 the 21st century. This translates into
the highest emission scenario expects an average total sea level rise in 2100
(°C)
1.0
(m)
1.0 Mean over
Mean over that ocean to be nearly ice-free in 0.4 2081–2100 of 0.4-0.63 m, relative to the final two
RCP8.5
2081–2100 September by mid-century. decades of the 20th century.
8.2
0.0 0.8
RCP6.0
RCP4.5
On land, the surface warming trend 0.2
RCP2.6
is expected to continue for at least
0.6
the rest of this century. Across the
(pH unit)
-1.0
8.0 0
four main warming scenarios put
(m)
RCP2.6
1980 2000 2020 2040 2060 2000 2020 2040 2060 2080 2100
forth by the IPCC, likely warming 0.4
RCP4.5
RCP8.5
YEAR YEAR
ranges from 0.3oC to 4.8oC, relative
RCP6.0
7.8
RCP6.0
to 1986-2005 average temperatures.
RCP4.5
0.2
RCP2.6
Source: IPCC (2013) Source: IPCC (2013)
All the scenarios expect at least 1oC of
RCP8.5
warming by mid-century.
7.6 0
Mean over
1950 2000 2050 2100 Mean over 2000 2020 2040 2060 2080 2100 2081–2100
6.0
Figure 18: Projected Global Average
RCP8.5 YEAR Surface Temperature 2081–2100 Precipitation 8.2Figure20: Projected Global MeanYEAR Ocean Acidification
Change Relative
RCP2.6 to 1986-2005 Ocean Surface pH
historical
4.0 The forecast scenarios show a high The ocean pH is projected to decrease
(pH unit)
8.0
degree of variability in expected future further, by 0.06-0.32 by 2100,
RCP2.6
Mean over Mean over
6.0 precipitation trends with respect to depending on the emissions scenario.
RCP4.5
2081–2100
(°C)
2.0 RCP8.5 2081–2100
RCP8.5
region and latitude. For example, in This corresponds to an increase in
RCP6.0
RCP2.6 7.8
8.2
historical the RCP8.5 scenario, high latitudes acidity of 15-109%.
RCP6.0
4.0
and the Pacific tropics are expected to
RCP8.5
RCP4.5
0.0
see increases in precipitation, while
RCP2.6
Extreme Climate Events
(pH unit)
7.6
8.0
climate change will make dry regions
RCP2.6
(°C)
2.0
RCP8.5
drier and wet regions wetter in the 1950 2000 2050 2100
RCP4.5
-2.0
YEAR
mid-latitudes. All of the scenarios The observed trends – fewer
RCP6.0
1950 2000 2050 2100
RCP6.0
7.8
expect more intense monsoon cold events, more hot events,
RCP4.5
0.0 YEAR
precipitation and expand the areas more frequent and intense heavy
RCP8.5
RCP2.6
affected by monsoon systems, as well precipitation events – are all expected
7.6 Mean over
-2.0 as higher-intensity El Niño events. 6.0 to continue and potentially accelerate
(IPCC 2014) 1950 RCP8.5 2000 2050 2100 2081–2100 through the balance of the 21st
1950 2000 2050 2100 RCP2.6 YEAR century.
YEAR historical
4.0
Source: IPCC (2013) Source: IPCC (2013)
(°C)
2.0 Mean over
RCP8.5
6.0
RCP8.5 2081–2100
RCP2.6
RCP6.0
RCP4.5
historical
0.0
4.0
RCP2.6
-2.0
(°C)
2.0
RCP8.5
1950 2000 2050 2100
YEAR
RCP6.0
RCP4.5
22 Climate Primer 0.0 Climate Primer 23
RCP2.6
-2.0What are the Impacts of Climate Change?
The observed changes to the climate increase the risk of a variety of potentially
detrimental effects on a wide variety of physical, biological, and human systems
and environments. Some of these risks and effects are global, while others
are regional or local, and many are interlinked. Some risks and effects may be
mitigated, while others may build to a point of no return if current trends persist
for an extended period. One example of this is the thawing of permafrost in arctic
Changes in water
regions – once it is gone, it may take many centuries to be re-established even if
the world stops warming. Due to the complexity, interconnectedness and feedback
loops involved in these systems, this section is intended to give an extremely
broad overview of the kinds of risks and effects involved, rather than a detailed
“1.4 BILLIONis a direct
catalogue of impacts.
availability Climatic Effects may have a direct impact on food
production and industry. Extreme
PEOPLE HAVE
Changes in water availability is a direct weather events can disrupt transport,
effect of both rising
effect of both rising temperatures and logistics, and even infrastructure
changing precipitation patterns. In for extended periods, disrupting
cold regions, warmer temperatures livelihoods and potentially fostering
NO ACCESS
have led to the shrinkage of many disease outbreaks. Heat waves can lead
glaciers, potentially compounded to increased mortality of vulnerable
temperatures and
by shifting precipitation patterns populations, and also contribute to
to reduce the snowfall required to worsening fire seasons by drying out
TO RELIABLE
replenish them. This can lead to less forests. Rising surface temperatures
glacial runoff in spring, affecting may negatively impact agricultural
natural systems downstream including yields, worsening food security.
changing precipitation
local ecosystems, microclimates and
In the ocean, marine warming, as
ELECTRICITY”
groundwater reservoirs. This may
with surface warming, has led in some
change the ability of the affected
cases to the shifting of ranges for fish
landscapes to support terrestrial
and seafood stocks, with potentially
species, leading to shifts in their
patterns.
adverse effects on the fishing industry
ranges or even to extinction.
as well as aquaculture. Globally, 40%
In warmer regions, increasing of the world’s population lives in
temperatures may also lead to shifting coastal zones (i.e., within 100km of
ranges of animals and plants, to the the coastline, as defined by the UN),
extent they are able to do so. Summer making a large fraction of humanity
heat has become more intense, which, vulnerable to sea level rise. Rising seas
depending on locality, may lead to a present increased risk of damage to
higher incidence of drought, a longer infrastructure, property and lives via
fire season, increased monsoon flooding, particularly in combination
precipitation, flooding, and more with events such as storm surges.
frequent and more intense extreme
Resource stress, particularly
weather events such as tropical
regarding food and suitable land, has
Workers toiling in the fields in Shanxi Province, northern China. China is in the middle of its worst drought on record, with over cyclones. All of these effects have
the potential to lead to conflict, with
100 of its major cities facing serious water shortages. One of the main consequences of this is that many areas which previously consequences for local ecosystems.
produced much of China’s food are seeing crop yields falling, potentially putting China’s long-term food security at risk. concomitant risk of loss of life as well
© Global Warming Images / WWF as further disruption to livelihoods
Human-Related Effects and communities.
These natural system effects also have
significant potential to disrupt human
systems. For example, the changes
in water availability described above
24 Climate Primer Climate Primer 25How has Climate Change Manifested in Asia?
While climate change is a global phenomenon, it also manifests regionally and
locally. All of the climate effects described above are also being observed in
Asia, at the continental, regional and country levels. Temperatures are rising,
precipitation patterns are changing, the sea level is rising, and extreme weather
Archipelagic nations
events are increasing in frequency and intensity, among other effects. For Asia
this can be seen on a country-by-country basis in Annex A.
Given the diversity of geographies, topographies, and climates among the various
countries in Asia, the specific climate-related risks faced by the different countries
such as Indonesia or the
vary significantly. For example, archipelagic nations such as Indonesia or the
Philippines are clearly much more exposed to the risks of rising sea levels than are
landlocked countries like Mongolia or Laos.
WHY ACT NOW
Philippines are much
equally important priorities. The
policy response is discussed further in
AND WHAT CAN BE
the next chapter.
Regarding the latter option, although
DONE?
development efforts are ongoing
more exposed to the risks
(see the Technology chapter), no
technologies currently exist with
Changes to the climate occur slowly, the scale required at an acceptable
in human terms, and often with a economic or environmental cost
of rising sea levels than
delay. Even if CO2 emissions cease to remove sufficient CO2 from the
immediately, the world will continue atmosphere to make a difference to the
warming for several decades, due to climate system. The only potentially
the delay in climatic effects impacting viable option at present with sufficient
on the climate and the decadal time scale is to use reforestation and
are landlocked countries
scales required for natural systems to afforestation to improve the capacity
re-absorb CO2. Responding to climate of natural carbon sinks while also
change ultimately takes the form of severely curtailing deforestation.
adaptation or mitigation. Adaptation
As even this will take multiple decades
is the process of dealing with climate
like Mongolia or Laos.
to show results, notwithstanding the
change impacts that are already
amount of land required, curtailing
happening or are expected to occur.
greenhouse gas emissions is a critical
Mitigation efforts seek to reduce
component of the effort to stabilise
or stabilise the concentrations of
the Earth’s climate. The longer it
greenhouse gases in the atmosphere.
takes the world to reach and pass peak
There are only two ways to lower emissions, the larger the problem
the concentration of atmospheric becomes, and the more dependent it
carbon dioxide: reduce the rate of becomes on inventing or developing
emissions (mitigation), and increase the necessary technology.
the rate at which it is removed from
WHY SHOULD WE
Roxas Boulevard, in Manila, Philippines. Manila is a low-lying coastal city which is highly vulnerable to the atmosphere (sequestration). The
rising sea levels, floods, and other impacts of climate change. former option has been the primary
CARE?
© AAR Studio / Shutterstock.com focus of policy commitments under
the UN Framework on Climate
Change, signed in 1992, which has
articulated a goal of limiting the rise
in the Earth’s temperature to 2oC Risk Implications
above pre-industrial temperatures by
2100 (consistent with RCP2.6). But From a financial perspective, climate
the Paris Agreement, signed in 2015, change presents a number of different
included adaptation to climate change types of risks that some investors
and appropriate financial flows as are only beginning to take under
26 Climate Primer Climate Primer 27You can also read