Climate Adaptation Policy Paper & Vulnerability Assessment - CITY OF FOWLER GENERAL PLAN UPDATE APRIL 2020
←
→
Page content transcription
If your browser does not render page correctly, please read the page content below
Climate Adaptation
Policy Paper &
Vulnerability Assessment
CITY OF FOWLER
GENERAL PLAN UPDATE
APRIL 2020
CLIMATE ADAPTATION POLICY PAPER
& VULNERABILITY ASSESSMENT
GENERAL PLAN UPDATE

APRIL 2020

Prepared For:
CITY OF FOWLER PLANNING & COMMUNITY DEVELOPMENT DEPARTMENT
128 S. 5TH STREET
FOWLER, CA 93625

Prepared By:
PROVOST & PRITCHARD CONSULTING GROUP
286 W. CROMWELL AVENUE
FRESNO, CA 93711
City of Fowler General Plan Update                                                 Climate Adaptation Policy Paper and Vulnerability Assessment

TABLE OF CONTENTS
Purpose ......................................................................................................................................................... 1
Background ................................................................................................................................................... 1
    Scientific Context ...................................................................................................................................... 1
    Legislative Context (Senate Bill 379) ......................................................................................................... 2
    Mitigation -vs- Adaptation ........................................................................................................................ 2
Climate Adaptation Planning Process ............................................................................................................ 3
    Understanding the Effects of Climate Change .......................................................................................... 5
Methodology and Data Sources .................................................................................................................... 7
    Cal-Adapt .................................................................................................................................................. 7
    Summary Reports...................................................................................................................................... 7
Vulnerability Assessment .............................................................................................................................. 8
    Exposure Assessment................................................................................................................................ 8
        Primary Effects of Climate Change ....................................................................................................... 9
        Secondary Effects of Climate Change ................................................................................................. 10
    Sensitive Community Assets and Potential Impacts ................................................................................ 15
        Sensitive Community Assets ............................................................................................................... 15
        Potential Impacts as a Result of Local Exposures................................................................................ 16
    Adaptive Capacity ................................................................................................................................... 20
        Planning Documents ........................................................................................................................... 21
        Standards, Ordinance, and Programs ................................................................................................. 23
        Summary and Recommendations ....................................................................................................... 24
    Risk and onset ......................................................................................................................................... 25
Bibliography ................................................................................................................................................ 27

April 2020                                                                                                                                               Page | i
City of Fowler General Plan Update Climate Adaptation Policy Paper and Vulnerability Assessment LIST OF FIGURES Figure 1: Climate Change Mitigation -vs- Adaptation .................................................................................... 3 Figure 2: Adaptation Planning Development................................................................................................. 4 Figure 3: Associated Effects of Climate Change on Human Health ............................................................... 6 Figure 4: Predicted Annual Average Maximum Temperature in Fowler ....................................................... 9 Figure 5: Annual Average Precipitation under the RCP 4.5 Scenario........................................................... 10 Figure 6: Annual Average Precipitation under the RCP 8.5 Scenario........................................................... 10 Figure 7: Extreme Heat Days under the RCP 4.5 Scenario ........................................................................... 12 Figure 8: Extreme Heat Days under the RCP 8.5 Scenario ........................................................................... 12 Figure 9: Predicted Annual Extreme Heat Days in Fowler ........................................................................... 12 Figure 10: Fowler's Sensitive Community Assets ......................................................................................... 16 LIST OF TABLES Table 1: Primary Versus Secondary Effects of Climate Change ..................................................................... 5 Table 2: Planning Documents, Standards, Ordinance, and Programs Addressing Climate Change ............. 20 Table 3: Summary of Adaptive Capacity ...................................................................................................... 25 Table 4: Summary of Risk and Onset ........................................................................................................... 26 April 2020 Page | ii
City of Fowler General Plan Update                          Climate Adaptation Policy Paper and Vulnerability Assessment

PURPOSE
The purpose of this policy paper is to provide an overview of new general plan requirements, as outlined
by Senate Bill (SB) 379, which require cities and counties to address the impacts of climate change in their
communities. This paper will review the scientific context of climate change, the requirements of SB 379,
and provide a vulnerability assessment: a five-step process that establishes the climate change exposures
Fowler will face, summarizes likely impacts, and reviews risk and onset of each impact. The information in
the vulnerability assessment will provide the basis for climate adaptation policy recommendations to be
considered during the general plan update process.

BACKGROUND
SCIENTIFIC CONTEXT
The earth’s climate has been warming for the past century. Scientific analysis of earth’s historical climate
shows that the climate system varies naturally over a wide range of timescales. In general, climate changes
prior to the Industrial Revolution in the 1700s can be explained by natural causes. However, recent climate
changes cannot be explained by natural causes alone.1 It is understood that this warming trend is related
to anthropogenic2 releases of certain gases, known as greenhouse gases (GHG), into the atmosphere. GHGs
absorb infrared energy that would otherwise escape from the Earth. As the infrared energy is absorbed,
the air surrounding the Earth is heated. An overall warming trend has been recorded since the late 19 th
century, with the most rapid warming occurring over the past two decades.

Recent scientific analysis completed by the Intergovernmental Panel on Climate Change (IPCC) confirms
that human influence on the climate system is clear, and recent anthropogenic emissions of greenhouse
gases are the highest in history.3 This has led to atmospheric concentrations of carbon dioxide, methane,
and nitrous oxide that are unprecedented in at least the last 800,000 years. Their effects, together with
those of other anthropogenic drivers, have been detected throughout the climate system and are
extremely likely to have been the dominant cause of the observed warming since the mid-20th century.3

In recent decades, changes in climate have caused impacts on natural and human systems on all continents
and across the oceans. Impacts are due to observed climate change, irrespective of its cause, indicating the
sensitivity of natural and human systems to changing climate.4 Some of these impacts include changes in

1
  (United States Environmental Protection Agency, 2017)
2
  Resulting from the influence of human beings.
3
  (Contribution of Working Groups I, II and III to the Fifth Assessment Report of the Intergovernmental Panel on
Climate Change, 2014)
4
  (Contribution of Working Groups I, II and III to the Fifth Assessment Report of the Intergovernmental Panel on
Climate Change, 2014)

April 2020                                                                                                      Page | 1
City of Fowler General Plan Update                         Climate Adaptation Policy Paper and Vulnerability Assessment

extreme weather, precipitation, and melting snow which affect water resources, impact crop yields, and
change wildlife geographic ranges and migratory patterns.5

Even after implementing measures to minimize how much the climate will change, communities around
the world will experience new challenges due to the shifting climate. These impacts will vary from place to
place, as will their intensity. In order to prepare for these changes, communities must determine what
impacts they are most likely to face.

LEGISLATIVE CONTEXT (SENATE BILL 379)
In an effort to prepare for and mitigate climate change related
impacts, new laws governing land use planning efforts have                    SB 379 REQUIREMENTS
                                                                       Long range planning documents must integrate
been enacted. SB 379 was passed in October of 2015 in
                                                                       climate adaptation and resiliency strategies,
reaction to increasing evidence that global climate change will        including:
have lasting impacts on the health and well-being of
                                                                       1.   A vulnerability assessment that identifies
communities around the world.                                               the risks climate change poses to the local
                                                                            jurisdiction and the geographic areas at
                                                                            risk from climate change.
SB 379 requires cities and counties to address climate change
impacts either through their local hazard mitigation plan 2. A set of adaptation and resilience goals,
                                                                     policies, and objectives based on the
(LHMP) or general plan safety element. Jurisdictions must            information specified in the vulnerability
incorporate climate adaptation into their safety element once        assessment.
an LHMP is adopted on or after January 1, 2017, or, if they do 3. A set of feasible implementation
                                                                     measures designed to carry out the goals,
not have an adopted LHMP, the safety element must be
                                                                     policies, and objectives identified in the
updated before January 1, 2022. These updates must include           adaptation objectives.
goals, policies, and objectives to address climate resilience in
response to likely climate change vulnerabilities. These goals, policies, objectives, and implementation
measures are based on a required vulnerability assessment. The vulnerability assessment will identify the
risks that climate change poses to the jurisdiction by analyzing projected climactic shifts and the vital
services, functions, and populations put at risk by those changes.

MITIGATION -VS- ADAPTATION
In the wake of new legislation pertaining to climate adaptation, it is necessary to distinguish the types of
planning efforts undertaken to address climate change. Local planning efforts address climate change in
two separate yet related ways. The first is through the reduction of greenhouse gas (GHG) emissions, also
known as mitigation. The second is through adaptation planning, which is the subject of this policy paper.
While these efforts are often pursued in parallel, there is a distinct difference between mitigation and
adaptation. The purpose of mitigation is to slow the overall effects and consequences of climate change by
reducing the amount of GHGs released into the atmosphere. Adaptation planning seeks to address the
impacts of climate change on the vital structures, functions, and populations within a specific jurisdiction.

5
 (Contribution of Working Groups I, II and III to the Fifth Assessment Report of the Intergovernmental Panel on
Climate Change, 2014)

April 2020                                                                                                       Page | 2
City of Fowler General Plan Update Climate Adaptation Policy Paper and Vulnerability Assessment
Adaptation planning assesses climate change risks and provides coping strategies to help communities
adapt to the changing environment regardless of how effectively GHG emissions may be curbed.
These parallel planning efforts are also handled through two different regulatory landscapes. Mitigation is
often dealt with through environmental compliance documents regulated by the California Environmental
Quality Act (CEQA), while adaptation planning is addressed through long range planning documents such
as local hazard mitigation plans (LHMPs), general plans, or climate action plans.
Figure 1: Climate Change Mitigation -vs- Adaptation
(California Emergency Management Agency, California Natural Resources Agency, 2012)
CLIMATE ADAPTATION PLANNING
PROCESS
The primary resource outlining best practices for climate adaptation planning is the California Adaptation
Planning Guide (APG). The APG was developed by the California Emergency Management Agency (CEMA)
and the California Natural Resources Agency (CNRA) in order to help guide climate adaptation planning at
the local level. The guide is a four-part series which introduces the basis for climate adaptation planning,
provides a step-by-step process for conducting local vulnerability assessments, and outlines strategies for
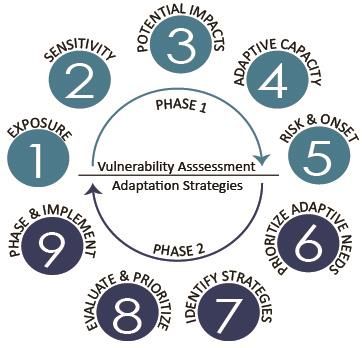
creating local adaptation plans. The APG breaks down climate adaptation planning into nine distinct tasks
categorized into two phases, as shown in Figure 2: Adaptation Planning Development.
April 2020 Page | 3City of Fowler General Plan Update Climate Adaptation Policy Paper and Vulnerability Assessment
Figure 2: Adaptation Planning Development
(California Emergency Management Agency, California Natural Resources Agency, 2012)
Phase one of this process is conducting a vulnerability assessment. The vulnerability assessment will
identify:
1. Exposure the community will experience due to the effects of climate change.
2. Sensitivity of key community structures, functions, and populations that are potentially susceptible
to each exposure.
3. Potential Impacts likely to occur to the structures, functions, and populations within a community
due to climate change exposures.
4. Adaptive Capacity of the community, or its ability to cope with and address projected impacts.
5. Risk and Onset, including necessary adjustments to address the likely occurrence and timing of the
projected impacts.
These first five steps are covered in this paper and inform its structure.
Phase two of the planning process is known as adaptation strategy development. This process includes
steps six through nine:
6. Prioritize Adaptive Needs based on the findings in the vulnerability assessment.
7. Identify Strategies to address the highest priority adaptation needs.
April 2020 Page | 4City of Fowler General Plan Update Climate Adaptation Policy Paper and Vulnerability Assessment
8. Evaluate and Prioritize those strategies based on the projected onset of the impacts, cost, co-
benefits, and feasibility.
9. Phase and Implement adaptation strategies and develop a monitoring system to assess
effectiveness.
As noted in the Purpose section above, climate adaptation strategies identified during phase two (steps six
through nine) will be addressed during future stages of the general plan update process. The adaptation
strategies will result in climate adaptation policy recommendations to be considered in the general plan
update. The information contained in phase one, the vulnerability assessment, will provide the data and
research basis for those recommendations
UNDERSTANDING THE EFFECTS OF CLIMATE CHANGE
The discussions in this report provide descriptions of both primary and secondary effects of climate change.
Primary effects result from direct exposures such as temperature and precipitation changes, sea level rise,
and the occurrence of severe storms. Secondary effects occur as a result of primary effects, and may
include phenomenon such as heat waves, changed seasonal patterns, and coastal erosion. A list of primary
effects and commonly associated secondary effects may be seen in Table 1: Primary Versus Secondary
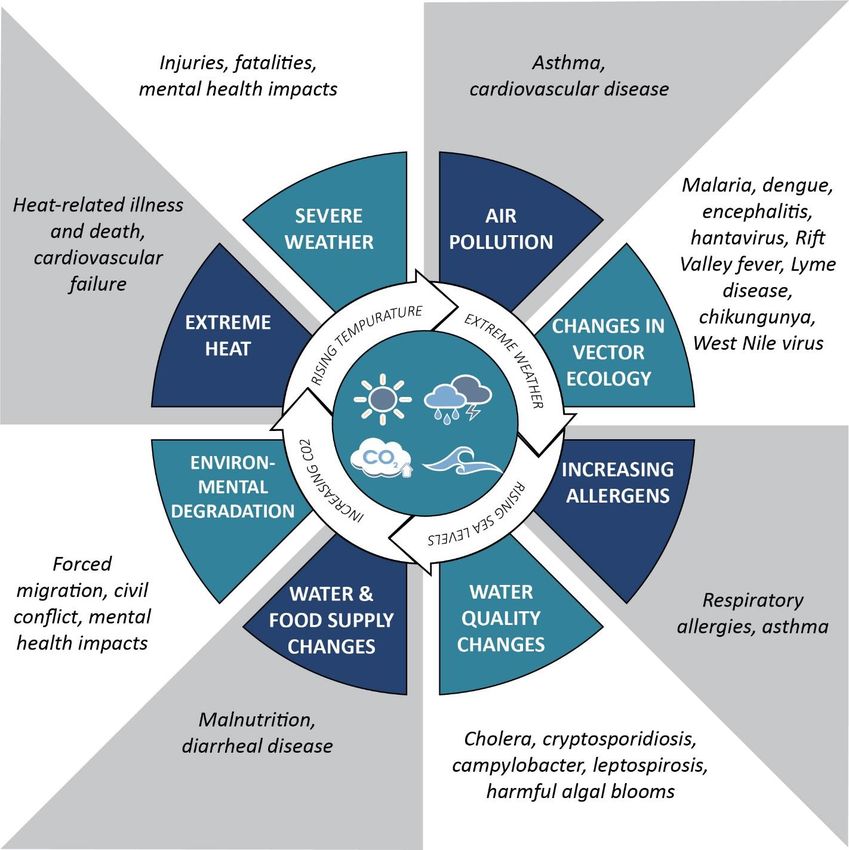
Effects of Climate Change. Public health impacts must also be evaluated in order to determine and prioritize
the adaptive needs of a community. The relationship between associated health effects of climate change
is illustrated in Figure 3: Associated Effects of Climate Change on Human Health.
Table 1: Primary Versus Secondary Effects of Climate Change6
Primary Impact Associated Secondary Impacts
Sea level rise Inundation or long-term waterline change
Coastal Erosion
Extreme high tide
Saltwater intrusion
Changed temperature/precipitation patterns/severe Changed seasonal patterns
storms Wildfire
Drought
Reduced Snowpack
Heatwaves
Landslide
6
(California Emergency Management Agency, California Natural Resources Agency, 2012)
April 2020 Page | 5City of Fowler General Plan Update Climate Adaptation Policy Paper and Vulnerability Assessment
Figure 3: Associated Effects of Climate Change on Human Health
(Federal Centers for Disease Control)
April 2020 Page | 6City of Fowler General Plan Update Climate Adaptation Policy Paper and Vulnerability Assessment METHODOLOGY AND DATA SOURCES In California, Cal-Adapt provides climate change predictions downscaled to the most appropriate jurisdictional level, producing data for a number of potential exposure types under different climate scenarios. Nationwide and regional climate reports predicting potential climate change effects were used to supplement Cal-Adapt data and additional state and local documents were utilized to help determine the effects of climate change in Fowler. CAL-ADAPT This policy paper primarily considers peer-reviewed climate change data from Cal-Adapt, a web-based, interactive visualization tool that synthesizes climate research into a series of charts, maps, and data points of observed and projected climate variables for California. Cal-Adapt was developed by UC Berkeley’s Geospatial Innovation Facility and funded and advised by the California Energy Commission and California Strategic Growth Council. Cal-Adapt is particularly useful for identifying localized climate change predictions. Most climate change data exist on a global scale and are brought to the local level through a process called downscaling. Cal-Adapt downscales for several boundaries related to environmental, census, and planning regions. This report uses the incorporated and census designated place boundary of Fowler whenever downscaling is appropriate. Cal-Adapt uses two climate change scenarios, called Representative Concentration Pathways (RCP). RCP 4.5 is a moderate scenario where GHG emissions are curbed and peak in 2040. RCP 8.5 assumes emissions continue as usual and rise throughout the 21st century. Because Cal-Adapt considers both scenarios to be equally likely, both are discussed in this report. Cal-Adapt combines several models to form its pathway predictions. How the climate will change depends on human action and feedback loops, so averaging models helps to account for this uncertainty. More information about the models can be found on the Cal- Adapt website. The charts used in this report to demonstrate trends and the variation between scenarios use only the average simulation for ease of reference. SUMMARY REPORTS This report also considers analysis from climate change experts. While Cal-Adapt can provide powerful insight to how the climate will change in a particular place, it cannot explain how those changes will impact the structures, functions, and populations of that place. To better understand the potential impacts on these features in Fowler, Cal-Adapt data was supplemented with national and state summary documents, which provided additional analysis on how these exposures may impact Fowler and the region. The Fourth National Climate Assessment first identifies climate change impacts the United States is likely to face. It then narrows its scope to discuss what will impact various regions. Fowler is located in the Southwest region, consisting of California, Nevada, Utah, Colorado, Arizona, and New Mexico. The regional April 2020 Page | 7
City of Fowler General Plan Update                          Climate Adaptation Policy Paper and Vulnerability Assessment

predictions of climate change impacts outlined in the Fourth National Climate Assessment help to bridge
the gap between how the climate will change, as documented through the Cal-Adapt tool, and what
impacts it will have on life in the Southwest region.

This vulnerability assessment also considers documents produced by California State agencies. California’s
Fourth Climate Change Assessment Statewide Summary Report identifies which climate changes California
is most susceptible to and which populations are likely to be affected. Other reports provide more
specialized analysis for specific regions, such as the Climate Change and Health Profile Report for Fresno
County, prepared by the California Department of Public Health.

VULNERABILITY ASSESSMENT
As described in the above section titled Climate Adaptation Planning Process, Fowler must conduct a
vulnerability assessment to:

     1.      Determine what effects of climate change are likely to occur in Fowler;
     2.      Identify sensitive structures, functions, and populations within the City;
     3.      Determine likely impacts;
     4.      Evaluate current capacity to adapt to the shifting climate; and
     5.      Assess the risk and onset of the impacts likely to occur.

The topics in the following sections include these five steps and, together, make up the vulnerability
assessment for the City of Fowler.

EXPOSURE ASSESSMENT
The City of Fowler, located in the southern San Joaquin Valley,              RELATIVE CONCENTRATION
will be exposed to a variety of natural hazards that are likely to
                                                                                 PATHWAYS (RCP)
become more frequent and severe due to climate change.                     Cal-Adapt uses two climate change
Primarily, Fowler will face temperature and precipitation                  scenarios, called Representative
changes, but severe weather and wildfire will also be of concern.          Concentration Pathways (RCP). RCP 4.5 is a
                                                                           moderate scenario where GHG emissions
                                                                           are curbed and peak in 2040. RCP 8.5
The following exposures are divided into primary and secondary
                                                                           assumes emissions continue as usual and
effects, while the individual topics addressed in each category            rise throughout the 21st century. Both
are primarily organized around those identified in the Cal-Adapt           scenarios are considered equally likely and
tool.                                                                      thus are both discussed in this report.

Where possible, each exposure was evaluated under both the RCP 4.5 and RCP 8.5 Scenarios.

April 2020                                                                                                       Page | 8
City of Fowler General Plan Update Climate Adaptation Policy Paper and Vulnerability Assessment
Primary Effects of Climate Change
Sea Level Rise
Fowler is in the San Joaquin Valley of California, deeply inland and surrounded by mountain ranges. Thus,
it is unlikely to experience direct effects from sea-level rise. However, secondary effects of rising sea levels,
such as population change, shifting job markets, and increased need for healthcare, may still affect Fowler.
Although sea-level rise cannot be ignored as an impact for California, Fowler itself has low exposure to this
effect of climate change.
Temperature Increase
Between 1961 and 1990, the average annual temperature in Fowler was approximately 76.5oF. The average
temperature is expected to rise significantly in the coming decades. Between 1961 and 1990, the average
annual temperature was approximately 76.5oF. The overall increase will depend on how much carbon is
released into the atmosphere. In a low-emissions scenario, average annual maximum temperature will
likely rise to around 82oF by 2099. If emissions are not curbed, it is likely that annual average maximum
temperature in Fowler will increase to around 85oF.7 Figure 4: Predicted Annual Average Maximum
Temperature in Fowler demonstrates the expected increases in average maximum temperature for both
scenarios. There is a high certainty that Fowler will be exposed to increasing average temperature.
Figure 4: Predicted Annual Average Maximum Temperature in Fowler8
90
Annual Average Maximum Temperature
88
86
84
82
80
78
76
74
72
70
2007
2049
2091
1989
1992
1995
1998
2001
2004
2010
2013
2016
2019
2022
2025
2028
2031
2034
2037
2040
2043
2046
2052
2055
2058
2061
2064
2067
2070
2073
2076
2079
2082
2085
2088
2094
2097
2100
RCP 4.5 RCP 8.5 Observed
7
(Geospatial Innovation Facility and California Energy Commission, 2020)
8
(Geospatial Innovation Facility and California Energy Commission, 2020)
April 2020 Page | 9City of Fowler General Plan Update Climate Adaptation Policy Paper and Vulnerability Assessment
Changing Precipitation
The San Joaquin Valley region as a whole will experience declines in annual precipitation of 1-2 inches by
the year 2050 and as much as 3.5 inches by 2100. Areas of higher elevation are expected to experience
precipitation declines up to 10 inches.9 Under the RCP 4.5 scenario, the City of Fowler’s expected minimum
precipitation rates may decline from 6.7 inches per year to 2.1 inches from 2020 to 2040 and 3.3 inches
per year through the last half of the century. Under the 8.5 RCP scenario, minimum precipitation rates may
decline to 4.6 and 3.0 inches per year from 2020 to 2040 and 2040 to 2099, respectively. While minimum
precipitation rates are likely to decline, maximum precipitation rates may increase, leading to relatively
stable average precipitation under both scenarios. A summary of these scenarios can be seen in Figure 5:
Annual Average Precipitation under the RCP 4.5 Scenario and Figure 6: Annual Average Precipitation under
the RCP 8.5 Scenario below.
Figure 5: Annual Average Precipitation under the RCP 4.5 Scenario
Figure 6: Annual Average Precipitation under the RCP 8.5 Scenario
Secondary Effects of Climate Change
Drought, Snowpack and Water Supply
The state of California has seen temperatures increase steadily since 1895, with accelerated warming rates
since the 1970s.10 As winter temperatures increase, freezing elevations11 have risen by approximately 500
feet and winter chill time has decreased.12 These warming trends have led to more and more mountain
10
(California Department of Water Resources, n.d.)
11
The freezing elevation is the altitude at which the temperature is at 0 °C (32°F).
12
(California Department of Water Resources, n.d.)
April 2020 Page | 10City of Fowler General Plan Update Climate Adaptation Policy Paper and Vulnerability Assessment precipitation falling as rain instead of snow, decreasing snowpack and causing snowmelt to occur earlier in the year.13 In very dry years, the possibility of drought will become a more frequent reality. Drought is a gradual phenomenon, occurring slowly over a period of time, and is defined based on impacts to water users.14 California’s extensive system of water supply infrastructure can mitigate the effects of a short-term dry period, but the changing climate will stress jurisdictions’ ability to meet their longer-term water needs.15 In addition, as precipitation decreases, soil is more likely to become parched. Parched soil absorbs less water, increasing runoff and stressing water storage infrastructure, which may lead to dam failure and worsened drought conditions. Extreme Heat Both the frequency and severity of extreme heat events are increasing.16 Intense heat is a hazard on its own, but it also increases the risk of other extreme weather such as wildfire or drought. Historically, the City of Fowler experienced, on average, four extreme heat days each year.17 That number is expected to rise to 30 extreme heat days per year by 2099 in RCP 4.5 and to 46 extreme heat days per year in RCP 8.5 as shown in Figure 7: Extreme Heat Days under the RCP 4.5 Scenario and Figure 8: Extreme Heat Day under the RCP 8.5 Scenario. Future predictions are charted in Figure 9: Predicted Annual Extreme Heat Days in Fowler. 13 (Fresno County, Amec Foster Wheeler, 2018) 14 (California Department of Water Resources, n.d.) 15 (Fresno County, Amec Foster Wheeler, 2018) 16 (Center for Disease Control) 17 From 1950-2000, where an extreme heat day is one when the maximum temperature is above 103.9oF, the 98th historical percentile of daily maximum/minimum temperatures based on observed historical data from 1961-1990 between April and October; (California Department of Water Resources, n.d.) April 2020 Page | 11
City of Fowler General Plan Update                            Climate Adaptation Policy Paper and Vulnerability Assessment

                              Figure 7: Extreme Heat Days under the RCP 4.5 Scenario

                              Figure 8: Extreme Heat Days under the RCP 8.5 Scenario

                             Figure 9: Predicted Annual Extreme Heat Days in Fowler18

 100
     90
     80
     70
     60
     50
     40
     30
     20
     10
      0
          2040

          2079
          1989
          1992
          1995
          1998
          2001
          2004
          2007
          2010
          2013
          2016
          2019
          2022
          2025
          2028
          2031
          2034
          2037

          2043
          2046
          2049
          2052
          2055
          2058
          2061
          2064
          2067
          2070
          2073
          2076

          2082
          2085
          2088
          2091
          2094
          2097
          2100

                                            RCP 4.5        RCP 8.5        Observed

Flooding
Natural floods are usually caused by weather events and can pose a substantial threat to property and
human safety. Floods may also be caused by structural failures at reservoirs and dams. In some instances,

18
     (Geospatial Innovation Facility and California Energy Commission, 2020)

April 2020                                                                                                      Page | 12
City of Fowler General Plan Update Climate Adaptation Policy Paper and Vulnerability Assessment
climate change will affect the likelihood of a structural failure due to a combination of drought and severe
storm events. In addition to facing more intense rain events with higher than normal maximum
precipitation, Fowler will also experience drought conditions which can contribute to parched soil, where
the ground is less able to absorb water during storms and floods. Together, these phenomena may
contribute to increased runoff during storm events and a decreased ability to contain stormwater, further
stressing water storage infrastructure and increasing the likelihood of failure.
With the changing climate causing an increase in severe weather events, flooding may pose a greater risk
than it has historically. A small portion of the City of Fowler is within the 100-year floodplain designated by
FEMA. Due to its location primarily outside of flood zones, Fowler has little to no exposure to climate-
related flood risks. The greatest risk for flooding in Fowler remains the Pine Flat Dam, located approximately
23 miles northeast of Fowler. Although increased drought conditions and other climate change effects have
the potential to stress dam infrastructure, it is not anticipated that climate change would greatly impact
the likelihood of the Pine Flat Dam failing.
Severe Weather
Severe weather includes any destructive weather event, such as fog, hail, and severe thunderstorms. The
Fresno County Multi-Jurisdictional Hazard Plan identified the most common severe weather events as:
• Fog;
• Heavy rain, thunderstorms, hail, lightning, and wind; and
• Tornados.19
Fog
Fog occurrence in Fowler can be expected to decrease as a result of climate change. Already, warming
temperatures have resulted in a significant drop in the number of fog days being recorded.20 Fog limits
visibility, which poses a distinct threat to drivers and pedestrians. While fewer fog days may be good for
public safety, the warmer temperatures indicated by the decrease in fog may result in reduced agricultural
productivity from many orchard crops.21 Fowler is already exposed to fog that threatens public safety, but
climate change is expected to decrease its occurrence. Decreased fog is a secondary effect of rising
temperature, which is covered in the Extreme Heat section of this report.
Storms
Storms are characterized by heavy rain and are often accompanied by strong winds, lightning, and hail.
These storms will likely increase in both frequency and severity. The number of rainy and snowy days in
Fresno County is expected to increase from 25-40 days annually to 35-55.22 These storms will carry greater
amounts of precipitation and reach extreme levels more frequently as the climate continues to change.
Fowler is likely to be exposed to more intense storms due to climate change.
19
(Fresno County, Amec Foster Wheeler, 2018)
20
(Fresno County, Amec Foster Wheeler, 2018)
21
(Fresno County, Amec Foster Wheeler, 2018)
22
(Fresno County, Amec Foster Wheeler, 2018)
April 2020 Page | 13City of Fowler General Plan Update Climate Adaptation Policy Paper and Vulnerability Assessment
Tornados
Historically, most tornados in Fresno County have been minor,
FUJITA SCALE
registering as F0 or F1 on the Fujita scale.23 Tornados can form The Fujita Scale determines tornado strength
in storms that have a certain type of wind shear, though based on structural damage. The Enhanced
meteorologists are unsure why only some of these storms Fujita Scale was implemented in 2007 and uses
generate tornados. An increase in the frequency of severe the same potential damage to produce more
accurate wind speed predictions.
storms would increase the potential for tornado-generating
conditions.24 In 2007 the Fujita Scale was revised to reflect F0 Broken branches, sign damage
F1 Roof damage, mobile homes and cars
more accurate wind speed estimates. This is known as the shifted
Enhanced Fujita Scale. Should the County experience a F2 Roof torn off, cars lifted off ground,
large trees uprooted
tornado that registers as a four or five on the Enhanced Fujita
F3 Roof and some walls missing, most
scale, severe property and crop damage would occur. Loss of trees uprooted, cars thrown
life would also be likely. Older and poorly constructed homes F4 Houses leveled, large missiles
generated and thrown 100+ yards
would experience the most damage and put those residents F5 Strong homes leveled, trees debarked,
in the most risk for injury or death.25 Fowler is likely to be complete destruction
exposed to more storms with tornado-generating strength,
but exposure to tornados is not a primary climate change concern for the City.
Wildfire
Wildfires occur primarily in areas with abundant fuel, so heavily forested areas are especially at risk.
Although there is a threat of wildfire throughout Fresno County, the City of Fowler is at low risk and has
not historically experienced fires.26 Cal-Adapt models do not predict Fowler will experience wildfire in either
RCP 4.5 or RCP 8.5. Still, fires may occur in areas with little risk and climate change is likely to increase the
occurrence of wildfire throughout the state. Drought, rising temperatures, and a lengthening fire season
will all increase the risk of wildfire in Fowler. Not only can drought increase the risk of fire, water shortages
may also limit Fowler’s ability to fight wildfires. Additionally, increased wind due to climate change, coupled
with hot, dry conditions, can worsen fire risk.
Fowler is much more likely to be exposed to the indirect effects of wildfire, such as the release of smoke
and air pollution capable of traveling long distances. As fire occurrence in the rest of the state increases,
smoke and ash will likely cause Fowler to experience greater air pollution and decreased air quality. The
San Joaquin Valley has experienced decreased air quality due to large fires burning in all parts of California.27
Though Fowler is unlikely to be directly exposed to a wildfire, the City will be exposed to the effects of fires
elsewhere in the state.
23
(NOAA, 2014)
24
(Fresno County, Amec Foster Wheeler, 2018)
25
(Fresno County, Amec Foster Wheeler, 2018)
26
(Fresno County, Amec Foster Wheeler, 2018)
27
(San Joaquin Valley Air Pollution Control District, 2018-19)
April 2020 Page | 14City of Fowler General Plan Update Climate Adaptation Policy Paper and Vulnerability Assessment
Streamflow
Climate change is expected to cause streamflow to vary more frequently between extremely high and low
flows. Because Fresno County and the San Joaquin Valley are located in a primarily arid climate, most
streamflow in the region occurs in channelized and controlled streams. It is not expected that streamflow
would vary to the extreme levels that it might in a natural stream, as it is already heavily controlled by man-
made systems. Therefore, Fowler is unlikely to be exposed to changes in streamflow due to climate change.
SENSITIVE COMMUNITY ASSETS AND POTENTIAL IMPACTS
The next step in completing a vulnerability assessment is to create an inventory of sensitive community
assets potentially affected by climate change exposures. Once an inventory of these assets is completed,
likely impacts can be analyzed.
The impacts a community will face are the combination of climate change exposures and how those
exposures affect sensitive community assets. Understanding both concepts is key to evaluating climate
change impacts at a community level.
Sensitive Community Assets
When inventorying sensitive assets, the APG suggests sorting each asset into one of three categories:
1. Structures. Structures include critical infrastructure such as roads, communications systems, and
utility systems including potable water, wastewater, natural gas, fuel, and electric power. Critical
structures also include hazardous materials facilities and high potential loss facilities. These
structures house toxic, flammable, explosive, and/or radioactive materials, and may include
nuclear power plants, dams, military installations, industrial buildings, and other structures which
critically impact the environment, public health, or safety in the event of damage.
2. Functions. The essential functions of a community include services that maintain government
continuity and public safety, including emergency operations like healthcare, police, fire services,
evacuation shelters, and schools. These functions are always important to the health and welfare
of a community but are especially critical following climate-related hazard events.
3. Vulnerable populations. Often, the populations most sensitive to climate change exposures are
those experiencing high levels of social vulnerability. Social vulnerability refers to the
characteristics of a person or group that influence their capacity to anticipate, cope with, resist, or
recover from the effects of climate change. Characteristics which inform social vulnerability include
age, health, income, linguistic isolation, mobility, and more. These characteristics often align with
indicators used in environmental justice analysis, or the establishment of Disadvantaged
Communities (DACs) as defined by SB 1000. As a result, populations identified as Disadvantaged
Communities may also be considered the most sensitive to climate change.
April 2020 Page | 15City of Fowler General Plan Update Climate Adaptation Policy Paper and Vulnerability Assessment
In order to aid jurisdictions in identifying sensitive community assets, the APG has provided sensitivity
checklists outlining the structures, functions, and populations which should be evaluated. These checklists
can be seen in Figure 10: Fowler’s Sensitive Community Assets below.
Figure 10: Fowler's Sensitive Community Assets
Items which are marked with an “x” exist within the Fowler planning area.
POTENTIALL SENSITIVE POTENTIALL SENSITIVE POTENTIALL SENSITIVE
FUNCTIONS STRUCTURES POPULATIONS
☐ Government continuity ☒ Residential ☒ Seniors
☒ Water/sewer/solid waste ☒ Commercial ☒ Children
☒ Energy delivery ☒ Industrial ☒ Individuals with disabilities
☒ Emergency services ☒ Institutional (schools, churches, ☒ Individuals with compromised
☒ Public safety hospitals, prisons, etc.) immune systems
☒ Public health ☒ Parks and Open Space ☒ Chronically ill individuals
☒ Emotional and mental health ☒ Recreational facilities ☒ Individuals without access to
☒ Business continuity ☒ Transportation facilities and lifelines (e.g. car or transit,
☒ Housing access infrastructure telephones)
☒ Food security ☐ Marine Facilities ☒ Non-white communities
☒Mobility/transportation/access ☒ Communication Infrastructure ☒ Low-income, unemployed, or
☒ Quality of life ☐ Dikes and levees underemployed communities
☒ Social services ☒ Water treatment plant and ☒ Individuals with limited English
☐ Ecological function delivery infrastructure skills
☐ Tourism ☒ Wastewater treatment plant and ☒ Renters
☒ Recreation collection infrastructure ☒ Students
☒ Agriculture, forest, and fishery ☐ Seasonal Residents
productivity ☒ Individuals uncertain about
☒ Industrial operations available resources because of
citizenship status
Potential Impacts as a Result of Local Exposures
Extreme Heat
Decreased Public Health
Exposure to extreme heat can pose a serious health threat, causing discomfort and fatigue and, in severe
cases, hospitalization and death.28 Specifically, heat can compromise the cardiovascular and respiratory
systems and especially impacts populations with other health conditions or that do not have access to cool
spaces.29
The populations most likely to be impacted by extreme heat include:
28
(Center for Disease Control)
29
(Katharine Burgess, 2019)
April 2020 Page | 16City of Fowler General Plan Update Climate Adaptation Policy Paper and Vulnerability Assessment
• Seniors
• Children
• Individuals without access to lifelines (e.g., car or transit, telephones)
• Low-income, unemployed, or underemployed communities
• Individuals with limited English skills
• Individuals who work outdoors
Infrastructure Damage and Impaired Services
Rapid changes in temperature and extreme heat can compromise the integrity of road infrastructure,
causing physical damage such as road buckling.30 When temperatures reach certain levels, people are also
unwilling to use alternative modes of transportation, such as biking or walking, putting additional stress on
roadway and public transit infrastructure. Additionally, extreme heat puts stress on utility infrastructure
due to the high energy demand associated with air conditioning and other cooling needs. Increased health
needs due to high temperature can also put stress on emergency response and medical functions.
The economy of the San Joaquin Valley is primarily based on agricultural production. Increased
temperatures will vary the growing season and the types of crops that can be grown in the region.
Additionally, higher temperatures may increase water demand for both agricultural and urban use. With
less water available and increased demand, California cities will have trouble meeting their water needs.
The functions and structures most likely to be impacted by extreme heat in Fowler include:
• Energy delivery
• Emergency services
• Public health
• Mobility/transportation/access
• Transportation facilities and infrastructure
• Agriculture, forest, and fishery productivity
• Water treatment and delivery infrastructure
Severe Weather
Severe weather associated with climate change can cause significant damage to property and crops. Storms
also pose a threat to people who are unable to find adequate shelter. Extremely wet events, especially in
arid climates like the San Joaquin Valley, can overstress water infrastructure and cause flooding and
property damage.
The populations, functions, and structures most likely to be impacted by storm events in Fowler are:
• Individuals experiencing homelessness
30
(Katharine Burgess, 2019)
April 2020 Page | 17City of Fowler General Plan Update Climate Adaptation Policy Paper and Vulnerability Assessment
• Public safety
• Built structures
• Water collection and storage infrastructure
Wildfire
Wildfires pose significant threat to property and human safety. Should a fire burn through Fowler, built
structures and agricultural activities as well as public safety would be at risk. Though fire risk is increasing
in California as a whole, it is unlikely to impact Fowler directly. Fowler is primarily at risk from the indirect
effects of wildfire, such as air pollution and smoke. Smoke carries particulate matter, carbon monoxide,
nitrogen oxides, and volatile organic compounds, all of which can significantly reduce air quality.31 Exposure
to smoke can negatively impact the respiratory and cardiovascular systems, increase hospitalizations, and
agitate medical issues such as asthma.
The air quality in the San Joaquin Valley is already poor. It exceeds federal and State standards for both
particulate matter at 2.5 microns and ozone, as well as State standards for particulate matter at 10
microns.32 Wildfire smoke contains both particulate matter and ozone. Wildfire smoke is becoming
increasingly impactful on Fowler’s air quality and it can be expected that individuals not already
predisposed to health risks from poor air quality would begin to be affected. Particulate matter and ozone
can cause several health effects including coughing, wheezing, chest pain, headaches, nausea, fatigue, and,
on a prolonged timeline, dementia. Individuals whose jobs require them to spend more time outside or do
intense physical labor are significantly more likely to be impacted by poor air quality.
The populations and functions most likely to be impacted by wildfire in Fowler are:
• Seniors
• Children
• Individuals with compromised immune systems
• Individuals who are chronically ill
• Outdoor workers
• Business continuity
Drought, Snowpack and Water Supply
The expected reduction in snowpack coupled with more frequent extreme heat events indicate that climate
change will decrease water supply while increasing demand throughout California. Regulations and water
rights further limit the availability of water when conditions in the mountains change resulting in reduced
snowpack. Drought especially impacts agricultural and urban functions, as both of those uses rely on large
amounts of water. Other secondary impacts of drought, such as wildfire, dust storms, and flash floods, can
pose serious risk to health and property.
31
(Centers for Disease Control and Prevention, 2019)
32
(City of Fowler, 2019)
April 2020 Page | 18City of Fowler General Plan Update Climate Adaptation Policy Paper and Vulnerability Assessment
Decreased Public Health
Dust storms associated with drought carry particulate matter that degrades air quality and can increase the
incidence of coccidioidomycosis, or valley fever.33 Drought is also associated with increased risk of disease
from both groundwater and surface water sources, especially for those with chronic health conditions.34
While air quality issues are especially impactful for people with respiratory illnesses, those with immune
disorders are more likely to be affected by decreased water quality.
The populations most likely to be impacted by drought in Fowler are:
• Individuals with compromised immune systems
• Individuals who are chronically ill
• Individuals who work in conditions where they are exposed to dust
Infrastructure Damage and Impaired Services
Groundwater levels in the Fowler area have dropped from approximately 33 feet below ground surface in
1967 to about 60 feet below ground surface in 2019, with large swings in the water table occurring in
response to hydrologically wet and dry periods.35 During hydrologically dry periods there is less surface
water available, causing increased reliance on ground water. Historic trends in water depths indicate that
groundwater levels may fall more drastically in drought conditions.36 The City of Fowler currently relies
solely on groundwater to serve its municipal functions. As climate change exposures increase the likelihood
of drought, there may be a need to address chronic lowering of groundwater levels.
Drought not only decreases the availability of water; it decreases its quality as well. Negative impacts to
water sheds may arise as drought-fueled wildfires lead to increased landslides, mudslides, or sediment in
run-off that reduce water quality. In addition, higher water temperatures and levels of sediment decrease
water oxygen levels, which can kill aquatic life and put drinking water availability into question.37 Lack of
surface water for irrigation can reduce farm productivity, a major economic driver for the San Joaquin
Valley. Furthermore, it can cause food insecurity as the San Joaquin Valley produces food for the rest of
the country.
The functions and structures most likely to be impacted by drought and snowpack and water supply
changes in Fowler include:
• Public health
• Food security
• Agriculture, forest, and fishery productivity
• Water treatment and delivery infrastructure
33
(Centers for Disease Control and Prevention, 2019)
34
(Centers for Disease Control and Prevention, 2020)
35
(Provost & Pritchard Conulting Group, 2019)
36
(Provost & Pritchard Conulting Group, 2019)
37
(Centers for Disease Control and Prevention, 2020)
April 2020 Page | 19City of Fowler General Plan Update Climate Adaptation Policy Paper and Vulnerability Assessment
ADAPTIVE CAPACITY
Adaptive capacity is the ability of a community to address climate change impacts. In order to determine
Fowler’s adaptive capacity, it is necessary to evaluate the extent to which potential impacts are already
being addressed. This is done through a review of climate change related policies, plans, and programs,
that are either in place or can be easily implemented. Once complete, adaptive capacity is rated as either
low, medium, or high to indicate level of preparedness. High capacity indicates that adaptive measures are
already implemented, and low capacity indicates that a community is unprepared for the impacts it may
face.
For the purposes of this effort, a document review has been completed wherein local planning documents
were reviewed for responsiveness to the most likely impacts facing Fowler. A list of documents, their
applicability to the City of Fowler, and the year they were completed can be found in Table 2: Planning
Documents, Standards, Ordinance, and Programs Addressing Climate Change. The most likely climate
change impacts facing Fowler include decreased public health, infrastructure damage, and impaired public
services as a result of:
• Drought, reduced snowpack, and reduced water supply;
• Extreme heat;
• Severe weather; and
• Wildfire.
A more detailed description of these impacts may be reviewed in the section above, entitled Sensitive
Community Assets and Potential Impacts.
Table 2: Planning Documents, Standards, Ordinance, and Programs Addressing Climate Change
Applicable
Document Type (yes/no) Title and Year Completed Agency
Planning Documents
General Plan Y 2025 General Plan, 2004 (update City of Fowler
currently underway)
Climate Action Plan N
Climate Adaptation Plan N
Area and Specific Plans N Central Fowler Revitalization Plan City of Fowler
(Downtown Plan), 2007
Local Hazard Mitigation Plans Y Fresno County Multi-Jurisdictional Fresno County
Hazard Mitigation Plan, 2018
Local Coastal Plan N *Not Applicable
Urban Water Management Plan N *Not Required
Ground Water Sustainability Plan Y South Kings Groundwater Sustainability South Kings
Plan, 2019 Groundwater
Sustainability
Agency
Integrated Regional Water Y Kings Basin Integrated Regional Water Kings Basin Water
Management Plan Management Plan, 2016 Authority
April 2020 Page | 20City of Fowler General Plan Update Climate Adaptation Policy Paper and Vulnerability Assessment
Applicable
Document Type (yes/no) Title and Year Completed Agency
Transit Plan Y Fresno County Regional Long Range Fresno Council of
Transit Plan 2019-2050, 2019 Governments
Sustainable Community Plans (SB Y Regional Transportation Plan, Fresno Council of
375) Sustainable Communities Strategy, 2018 Governments
Regional Transportation Plans Y Regional Transportation Plan, Fresno Council of
Sustainable Communities Strategy, 2018 Governments
Standards, Ordinance and Programs
Capital Improvement Program Y Currently Underway
Zoning Code Y City of Fowler Zoning Ordinance, 2009 City of Fowler
Building Code Y California Building Standards Code, 2019 California Building
Standards
Commission
Fire Code Y California Fire Code, 2019 California Building
Standards
Commission
Tree Ordinance N
Stormwater Management Plan N
Floodplain Ordinance Y Fowler Municipal Code, Chapter 8, 2009 City of Fowler
Planning Documents
General Plan38
A general plan is a comprehensive, long-range planning document that forms the basis of land use decisions
and envisions how a community will grow. It addresses issues that impact the entire city, such as how land
is used, the locations of roads and parks, safety, noise, and more. Every other planning document adopted
by the city must be consistent with the goals and policies of the general plan.
Fowler’s operating General Plan was adopted in 2004 and establishes a planning horizon of 2025. Topics
covered include land use, circulation, housing, economic development, environmental resources
management, and public facilities elements. Since its adoption, the General Plan has been revised and
amended but not comprehensively updated. The General Plan is currently in the process of being
comprehensively updated.
As part of the update process, existing General Plan policies have been reviewed for consistency with new
legislative requirements and current community needs. Currently, there are no policies that deal directly
with climate change resiliency. There are some policies that emphasize sustainability, growth management,
and active transportation, all of which have co-benefits with climate adaptation needs. While there are
some policies relevant to climate adaptation, they do not directly address climate change exposures and
impacts most relevant to Fowler. Focused climate change adaptation policies will need to be developed as
part of ongoing update efforts.
38
(City of Fowler, Land Use Associates, 2004)
April 2020 Page | 21City of Fowler General Plan Update Climate Adaptation Policy Paper and Vulnerability Assessment Local Hazard Mitigation Plans39 The Local Hazard Mitigation Plan (LHMP) is intended to reduce the long-term risk of environmental hazards such as severe weather or drought. Fresno County has a multi-jurisdictional plan which addresses hazards at a more regional scale and Fowler contributed an annex to that document which examines more local impacts. The plan identifies which hazards pose a risk to the County, what the impacts of such hazards would be, and how to mitigate and lessen the impacts of hazards. With the risk of many of these hazards increasing due to climate change, the mitigation measures identified in the LHMP are closely related to the beneficial actions of climate adaptation planning. The LHMP is identified as a document that can be used to implement SB 379; however, while it includes mutually beneficial measures, it does not directly address the necessary actions Fowler will need to take to address climate change. Groundwater Sustainability Plan40 In 2014, the California Sustainable Groundwater Management Act (SGMA) was signed into law in order to provide a statutory framework for sustainable local management of groundwater basins. SGMA requires certain governments and water agencies to bring groundwater basins into balanced levels of pumping and recharge. The City of Fowler falls within the South Kings Groundwater Sustainability Agency (SKGSA) boundary. As part of a critically over-drafted sub basin, the SKGSA’s goal is to ensure sustainable management by the year 2040. The primary planning document outlining sustainable management practices is the Groundwater Sustainability Plan (GSP). Climate change related impacts are a consistent consideration throughout the South Kings GSP. Sustainable water management practices in the face of changing seasonal patterns, reduced snowpack, flooding, and drought potential are covered within the South Kings GSP. It is also important to note that GSPs must be consistent with local general plans. Integrated Regional Water Management Plan41 Integrated Regional Water Management (IRWM) practices began in 2002, with the passing of the Regional Water Management Planning Act (SB 1672). In some ways, IWRM is considered the precursor to SGMA. IRWM seeks to build collaborative water management solutions across jurisdictional boundaries. The City of Fowler lies within the Kings Basin IRWM Plan (IRWMP) Area. The IRWMP for this area covers many interrelated water management topics, including predicted impacts from climate change, a vulnerability assessment for the Kings Basin, proposed adaptation measures, and monitoring plans. The information contained within this report is a valuable resource for predicting the effects of climate change on Fowler’s water resources. Downtown Plan (Central Fowler Revitalization Plan)42 The Central Fowler Revitalization Plan was adopted in 2007 as a method of creating a set of guiding design principles to revitalize Fowler’s downtown commercial core. The primary focus of this document is economic development, coupled with urban design principles to facilitate economic development. The design concepts discussed within the Central Fowler Revitalization Plan focus on connectivity, walkability, 39 (Fresno County, Amec Foster Wheeler, 2018) 40 (South Kings Groundwater Sustainability Agency, 2019) 41 (Kings Basin Water Authority, 2018) 42 (Local Government Commission, Opticos Design, 2007) April 2020 Page | 22
You can also read