Nevada Strategic Highway Safety Plan 2021-2025 02/19/2021
←
→
Page content transcription
If your browser does not render page correctly, please read the page content below
2021-2025
Nevada Strategic Highway
      Safety Plan

                           02/19/2021
2021-2025 NEVADA STRATEGIC HIGHWAY SAFETY PLAN

Table of Contents
Acronyms                                                                                                                                                                      iv
Letter from Governor                                                                                                                                                           v
Partner Pledge                                                                                                                                                                vi
Acknowledgments                                                                                                                                                              vii
   Nevada Executive Committee on Traffic Safety........................................................................................................vii
   Task Force Leaders................................................................................................................................................... viii
   Implementation Team............................................................................................................................................... viii
What is the Strategic Highway Safety Plan?                                                                                                                                    1
   Background ................................................................................................................................................................ 2
   2021-2025 SHSP Update Overview............................................................................................................................ 2
   SHSP Organizational Structure.................................................................................................................................. 4
   Roles and Responsibilities ......................................................................................................................................... 5
   SHSP Update Process................................................................................................................................................ 6
   Emphasis Areas.......................................................................................................................................................... 7
   2016-2020 SHSP Highlights....................................................................................................................................... 8
SHSP Goals and Performance Measures                                                                                                                                           9
   Nevada Traffic Fatalities Compared to Other Western States and National Average.............................................. 12
Key Areas                                                                                                                                                                  13
Safer Roads............................................................................................................................................................... 14
   Safe Speed............................................................................................................................................................... 15
   Lane Departures....................................................................................................................................................... 17
   Intersections.............................................................................................................................................................. 19
Vulnerable Road Users........................................................................................................................................... 21
   Pedestrians............................................................................................................................................................... 22
   Motorcyclists............................................................................................................................................................. 24
Safer Drivers and Passengers.............................................................................................................................. 26
   Occupant Protection................................................................................................................................................. 27
   Older Drivers............................................................................................................................................................. 29
   Young Drivers............................................................................................................................................................ 31
Impaired Driving Prevention................................................................................................................................. 33
   Impaired Driving........................................................................................................................................................ 34
Safety Data Analysis                                                                                                                                                        36
Next Steps                                                                                                                                                                  37
   Implementation......................................................................................................................................................... 37
   Connecting with the Community.............................................................................................................................. 41

                                                                                                Revised: February 2021 (Approved by FHWA: February 19, 2021)

                                                                                    Page ii                                                                      02/19/2021
2021-2025 NEVADA STRATEGIC HIGHWAY SAFETY PLAN

Figures
Figure 1. SHSP Organizational Structure..................................................................................................... 4
Figure 2. SHSP Development Timeline........................................................................................................ 6
Figure 3. Total Fatalities and Serious Injuries and Percent of Total Fatalities and
Serious Injuries by Emphasis Area............................................................................................................... 7
Figure 4. Nevada Fatalities, Five-Year Average and 2025 Target............................................................... 9
Figure 5. Nevada Serious Injuries, Five-Year Average and 2025 Target.................................................. 10
Figure 6. Nevada Fatality Rates, Five-Year Average and 2025 Target..................................................... 10
Figure 7. Nevada Serious Injury Rates, Five-Year Average and 2025 Target............................................11
Figure 8. Nevada Non-Motorized Fatalities and Serious Injuries,
Five-Year Average and 2025 Target............................................................................................................11
Figure 9. 2018 State Fatalities and Fatality Rates Comparison................................................................ 12
Figure 10. 2018 Percent of Fatalities by Person Type State Comparison................................................ 12
Figure 11. 2014-2018 Nevada Speed-Related Fatalities............................................................................ 15
Figure 12. 2014-2018 Nevada Speed-Related Serious Injuries................................................................. 15
Figure 13. 2014-2018 Nevada Lane Departure Fatalities...........................................................................17
Figure 14. 2014-2018 Nevada Lane Departure Serious Injuries.................................................................17
Figure 15. 2014-2018 Nevada Intersection Fatalities................................................................................. 19
Figure 16. 2014-2018 Nevada Intersection Serious Injuries...................................................................... 19
Figure 17. 2014-2018: Nevada Pedestrian Fatalities.................................................................................. 22
Figure 18. 2014-2018 Nevada Pedestrian Serious Injuries........................................................................ 22
Figure 19. 2014-2018 Nevada Motorcyclist Fatalities................................................................................ 24
Figure 20. 2014-2018 Nevada Motorcyclist Serious Injuries..................................................................... 24
Figure 21. 2014-2018 Nevada Occupant Protection Fatalities.................................................................. 27
Figure 22. 2014-2018 Nevada Occupant Protection Serious Injuries....................................................... 27
Figure 23. 2014-2018 Nevada Older Driver Fatalities................................................................................ 29
Figure 24. 2014-2018 Nevada Older Driver Serious Injuries...................................................................... 29
Figure 25. 2014-2018 Nevada Young Driver Fatalities............................................................................... 31
Figure 26. 2014-2018 Nevada Young Driver Serious Injuries.................................................................... 31
Figure 27. 2014-2018 Nevada Impaired Driving Fatalities......................................................................... 34
Figure 28. 2014-2018 Nevada Impaired Driving Serious Injuries.............................................................. 34
Figure 29. Nevada Online Crash Data Dashboard.................................................................................... 36
Figure 30. Nevada SHSP Implementation Tracking Progress Summary................................................. 38

                                                                     Page iii                                                        02/19/2021
2021-2025 NEVADA STRATEGIC HIGHWAY SAFETY PLAN

Acronyms
     6 “Es”    quity, Engineering, Education, Enforcement, Emergency Medical Services/Emergency Response/
              E
              Incident Management, and Everyone
   AASHTO     American Association of State Highway and Transportation Officials
     ARIDE    Advanced Roadside Impaired Driving Enforcement
      CEA     Critical Emphasis Area
     CVSP     Commercial Vehicle Safety Plan
      DRE     Drug Recognition Expert
       DUI    Driving Under the Influence
      FAST    Fixing America’s Surface Transportation Act
     FHWA     Federal Highway Administration
     GHSA     Governors Highway Safety Association
     HRRR     High-Risk Rural Roads
      HSIP    Highway Safety Improvement Program
      HSM     Highway Safety Manual
      HSP     Highway Safety Plan
       ICE    Intersection Control Evaluation
    MAP-21    Moving Ahead for Progress in the 21st Century Act
   MMUCC      Model Minimum Uniform Crash Criteria
      MPO     Metropolitan Planning Organization
    NCATS     Nevada Citation and Accident Tracking System
     NDOT     Nevada Department of Transportation
    NECTS     Nevada Executive Committee on Traffic Safety
      NHP     Nevada Highway Patrol
    NHTSA     National Highway Traffic Safety Administration
      OTS     Office of Traffic Safety
      RSA     Road Safety Assessment
SAFETEA-LU    Safe, Accountable, Flexible, Efficient, Transportation Equity Act: A Legacy for Users
      SMP     Safety Management Plan
     SHSP     Strategic Highway Safety Plan
      SFST    Standard Field Sobriety Test
     TRCC     Traffic Records Coordinating Committee
      TWG     Technical Working Group
      VMT     Vehicle Miles Traveled

                                                    Page iv                                           02/19/2021
2021-2025 NEVADA STRATEGIC HIGHWAY SAFETY PLAN

Letter from Governor

                              Page v                      02/19/2021
2021-2025 NEVADA STRATEGIC HIGHWAY SAFETY PLAN

Partner Pledge
The goal of Zero Fatalities is to eliminate fatalities on our roadways. Some people may think zero is an impossible
goal, but when it comes to your family and friends, what other number would be acceptable? We are aiming for zero
fatalities because everyone matters.

As a member of Nevada’s Strategic Highway Safety Plan’s Executive Committee on Traffic Safety, my agency
pledges to support Nevada’s goal of Zero Fatalities.

           Kristina Swallow                                             Wesley Harper
           Nevada Department of Transportation                          Nevada League of Cities

           George Togliatti                                             Eric Spratley
           Nevada Department of Public Safety                           Nevada Sheriffs’ and Chiefs’ Association

           John McCormick                                               Dean Dow
           Administrative Office of the Courts                          Regional Emergency Medical
                                                                        Services Authority

           Lucia Maloney
           Carson Area Metropolitan Planning                            M.J. Maynard
           Organization                                                 Regional Transportation Commission
                                                                        of Southern Nevada

           Thedrick Andres
           Henderson Police Department                                  Bill Thomas
                                                                        Regional Transportation Commission
                                                                        of Washoe County
           Deserea Quintana
           Inter-Tribal Council of Nevada
                                                                        John Hammond
                                                                        Southern Nevada Health District
           Joseph Lombardo
           Las Vegas Metropolitan Police Department
                                                                        Nick Haven
                                                                        Tahoe Regional Planning Agency
           Vinson Guthreau
           Nevada Association of Counties
                                                                        Susan Klekar
                                                                        Federal Highway Administration
           Jhone Ebert
           Nevada Department of Education
                                                                        Bill Bensmiller
                                                                        Federal Motor Carrier Safety
           Richard Whitley                                              Administration
           Nevada Department of Health and
           Human Services
                                                                        Gina Espinosa-Salcedo
                                                                        National Highway Traffic Safety
           Julie Butler                                                 Administration
           Nevada Department of Motor Vehicles

                                                      Page vi                                           02/19/2021
2021-2025 NEVADA STRATEGIC HIGHWAY SAFETY PLAN

Acknowledgments
The implementation and update of the Nevada SHSP would not be possible without the hard work and
commitment of the Nevada Executive Committee on Traffic Safety (NECTS), Task Force Leadership, and the
Implementation Team. All individuals have dedicated significant amounts of time and effort toward the
development and/or implementation of Nevada’s SHSP and saving the lives of Nevadans. Members of the NECTS,
Task Force Leaders, and the Implementation Team are listed below and on the
following page.

Nevada Executive Committee on Traffic Safety
NECTS Agency Department                                            NECTS Appointee
                                                                   Kristina Swallow
Nevada Department of Transportation
                                                                   Sondra Rosenberg
                                                                   Amy Davey (Office of Traffic Safety)
Nevada Department of Public Safety
                                                                   Col. Anne Carpenter (Nevada Highway Patrol)

Administrative Office of the Courts                                John McCormick

Carson Area Metropolitan Planning Organization                     Lucia Maloney

Henderson Police Department                                        Lt. John Lotito

Inter-Tribal Council of Nevada                                     Deserea Quintana

Las Vegas Metropolitan Police Department                           Joseph Lombardo

Nevada Association of Counties                                     Vinson Guthreau

Nevada Department of Education                                     Jennah Fiedler

Nevada Department of Health and Human Services                     Don Watson

Nevada Department of Motor Vehicles                                Julie Butler

Nevada League of Cities                                            Jo Walker

Regional Emergency Medical Services Authority                      Dean Dow

Nevada Sheriffs’ and Chiefs’ Association                           Eric Spratley

Regional Transportation Commission of Southern Nevada              Mohammad Farhan

Regional Transportation Commission of Washoe County                Rebecca Kapuler

Southern Nevada Health District                                    Chad Kingsley

Tahoe Regional Planning Agency                                     Nick Haven

Federal Highway Administration                                     Susan Klekar

Federal Motor Carrier Safety Administration                        Bill Bensmiller

National Highway Traffic Safety Administration                     Gina Espinosa-Salcedo

                                                        Page vii                                           02/19/2021
2021-2025 NEVADA STRATEGIC HIGHWAY SAFETY PLAN

Task Force Leaders
Kyle Bacon, Nevada Department of Transportation, Traffic Safety Engineering
Erin Breen, University of Nevada, Las Vegas - Vulnerable Road Users Partnership
Shannon Bryant, Nevada Traffic Safety Resource Prosecutor
Lori Campbell, Nevada Department of Transportation, Traffic Safety Engineering
Victoria Hauan, Office of Criminal Justice Assistance
Christina Karanikolas, City of Las Vegas
Kevin Moore, Department of Public Safety, Office of Traffic Safety
Shashi Nambisan, University of Nevada, Las Vegas
Fred Shakal, Nevada Department of Transportation, Traffic Safety Engineering
Lt. Scott Shaw, Reno Police Department
Bill Story, NDOT Multimodal Planning and Program Development
Genevieve Swain, Department of Public Safety, Office of Traffic Safety
Pete Vander Aa, Department of Public Safety, Office of Traffic Safety
Lt. Jeff Varner, Department of Public Safety, Nevada Highway Patrol
Narcisa Zepeda, Department of Public Safety, Office of Traffic Safety

Implementation Team
Andrew Bennett, Department of Public Safety, Office of Traffic Safety
Juan Balbuena, Federal Highway Administration
Amy Davey, Department of Public Safety, Office of Traffic Safety
Fred Shakal, Nevada Department of Transportation, Traffic Safety Engineering
Lacey Tisler, Nevada Department of Transportation, Traffic Safety Engineering
Jaime Tuddao, Nevada Department of Transportation, Traffic Safety Engineering
Kimley-Horn Consultant Team
   Mike Colety                              Meg Merry                             Lindsay Saner
   David Giacomin                           Taylor Michaels                       Carrie Sorensen
   Anabel Hernandez                         Molly O’Brien                         Karen Sprattler
   Emily Hilby

                                                        Page viii                                   02/19/2021
2021-2025 NEVADA STRATEGIC HIGHWAY SAFETY PLAN

What is the Strategic Highway Safety Plan?
Nevada’s Strategic Highway Safety Plan (SHSP) is a comprehensive statewide safety plan that identifies the
greatest causes of fatalities and serious injuries on Nevada roadways and provides a coordinated framework for
reducing the crashes that cause fatalities and serious injuries. The SHSP establishes statewide goals and strategies
focusing on the 6 “Es” of traffic safety: Equity, Engineering, Education, Enforcement, Emergency Medical Services/
Emergency Response/Incident Management, and Everyone.

The purpose of the SHSP is to eliminate traffic-related fatalities and serious injuries by combining and sharing
resources across disciplines and strategically targeting efforts to the areas of greatest need. Nevada has enlisted
stakeholders from state, local, tribal, and federal agencies; institutions; private-sector organizations; and concerned
citizens to develop goals and strategies to solve this problem.

SHSPs were first mandated under the Safe, Accountable, Flexible, Efficient, Transportation Equity Act: A Legacy for
Users (SAFETEA-LU), and extended under the Moving Ahead for Progress in the 21st Century Act (MAP-21) and the
Fixing America’s Surface Transportation (FAST) Act. Both extended the use of the Highway Safety Improvement
Program (HSIP) as a federal-aid program. A SHSP is a major component and requirement of the HSIP (23 U.S.C. §
148). It is a statewide coordinated safety plan that provides a comprehensive framework for reducing highway
fatalities and serious injuries on all public roads. A SHSP identifies a state’s key safety needs and guides investment
decisions towards strategies and countermeasure with the most potential to save lives and prevent injuries.

The FAST Act provides guidance for developing the SHSP and requires consultation with safety stakeholders,
such as:

  ● Highway safety representatives of the Governor of the State
  ● Metropolitan Planning Organizations (MPOs)
  ● Representatives of major modes of transportation
  ● State and local traffic enforcement officials
  ● Rail-highway grade-crossing safety representatives
  ● Motor carrier safety program reprsentatives
  ● Motor vehicle administration agencies
  ● City and county transportation officials
  ● State representatives of non-motorized users
  ● Other major federal, state, tribal, and local safety stakeholders

The SHSP is aligned with other statewide planning efforts and provides guidance for statewide traffic safety plans
and local plans, and guides the investment of funds for three federally-funded programs:

  ● HSIP managed by the Nevada Department of Transportation (NDOT)
  ● Highway Safety Plan (HSP) managed by the Office of Traffic Safety (OTS)
  ● Commercial Vehicle Safety Plan (CVSP) managed by the Nevada Highway Patrol (NHP)

                                                        Page 1                                              02/19/2021
2021-2025 NEVADA STRATEGIC HIGHWAY SAFETY PLAN

Background
Nevada’s efforts to develop the SHSP began in 2004 when NDOT Traffic Safety Engineering formed a Technical
Working Group (TWG) of traffic safety representatives that initiated coordination and later supported the activities of
NECTS. The role of NECTS, as established in 2005, is to provide guidance, approve the SHSP (and subsequent
updates), and help gain consensus at a high level among local, state, tribal, and federal agencies that improve
traffic safety.

Nevada’s first five Critical Emphasis Areas (CEAs) were identified at the 2004 Traffic Safety Summit—the first to be
held in Nevada. The original CEAs included: making walking and street crossing safer (Pedestrians), reducing
impaired driving (Impaired Driving), increasing seat belt usage (Seat Belts, now called Occupant Protection),
improving the design and operation of highway intersections (Intersections); and keeping vehicles on the roadway
(Lane Departures).

In 2010, Nevada adopted a statewide goal of Zero Fatalities, consistent with the national Toward Zero Deaths
strategy sponsored by the Federal Highway Administration (FHWA), the National Highway Traffic Safety
Administration (NHTSA), the American Association of State Highway and Transportation Officials (AASHTO), and the
Governors Highway Safety Association (GHSA). In 2010, as an interim goal to reach Zero Fatalities, Nevada
established the goal of reducing fatalities by year 2030 to half of those recorded in 2008.

In 2014, the SHSP was amended to incorporate special user groups including bicyclists, pedestrians, motorcyclists,
younger road users, and older road users into all CEAs and to incorporate Emergency Responders and Traffic
Incident Management into the “E” for Emergency Medical Services. The NECTS also approved the sixth CEA—
Motorcycles—due to the increasing trends in motorcycle fatalities and serious injuries both in Nevada and on a
national level.

The NECTS approved the addition of Young Drivers as the seventh CEA in 2017. The Young Drivers Task Force held
their first meeting at the 2017 Nevada Traffic Safety Summit in Reno to establish strategies and action steps to
reduce fatalities and serious injuries involving young drivers (ages 16-20).

2021-2025 SHSP Update Overview
The SHSP is administered by NDOT in primary coordination with the Nevada Department of Public Safety, Office of
Traffic Safety (DPS-OTS). NECTS provides direction and oversight of the specific elements for the development and
implementation of the SHSP.

SHSP Guiding Principles
The 2021-2025 SHSP adopts four guiding principles that align with the Road to Zero Coalition’s initiatives to achieve
the goal of zero roadway fatalities by the year 2050 (The Road to Zero: A Vision for Achieving Zero Roadway Deaths
by 2050, Rand Corporation, 2018).

 Incorporate Equity
     The SHSP will incorporate equity in all aspects of the plan, including processes, strategies, and outcomes of
     the SHSP to serve all, but particularly vulnerable and traditionally under-served populations.

     Implementation of the SHSP will include development of a data analysis process that incorporates equity
     among all road users. Existing action steps will be evaluated with the following questions during the life of the
     SHSP:

      ●   Which groups will benefit from implementation of this action step?
      ●   Who may be negatively impacted by implementation of this action step?
      ●   Was demographic and socioeconomic data considered in the development of the action step?
      ●   Who was involved in developing the action step?

                                                        Page 2                                              02/19/2021
2021-2025 NEVADA STRATEGIC HIGHWAY SAFETY PLAN
The evaluation process for how equity is measured in action steps, identified projects, adoption of standards
and other decisions will be documented.
 Prioritize Safe Speed
Speeding accounts for nearly one-third of all traffic fatalities in Nevada; however, we know that speed is a
contributing factor to all fatal and serious injury crashes. Speeding and excessive speed endangers not only
the life of the driver, but all the people on the road around them. Implementation of all action steps should
factor in speed and acknowledge that reducing speed can lessen the severity of impact on the humans
involved in three ways: reducing impact forces, providing additional time for drivers to stop, and improving
visibility.
 Double Down on What Works
The key to the success of the SHSP is to include strategies and action steps that are data-driven and
evidence-based, including proven safety countermeasures that are highly effective in reducing fatalities and
serious injuries. These include the Federal Highway Administration’s (FHWA) Proven Safety Countermeasures
as well as the National Highway Traffic Safety Administration’s (NHTSA) Countermeasures That Work and the
Crash Modification Factors (CMF) Clearinghouse. This priority also includes a strong emphasis on improving
data availability, quality, and analysis tools.
 Accelerate Advanced Technology
New emerging technologies have applications that impact the vehicles, drivers and passengers, and the ways
all road users interact and communicate with the built environment and each other. The SHSP embraces
emerging technologies by establishing partnerships with technology providers, health and safety groups,
manufacturers, and government partners to prioritize safety.
Structuring the SHSP
For the 2021-2025 SHSP, four Key Areas were selected to prioritize collaboration among the 6 “Es” for SHSP
implementation: Safer Roads, Vulnerable Road Users, Safer Drivers and Passengers, and Impaired Driving
Prevention. The plan established task forces for each Key Area, which will be responsible for collaboration and
monitoring progress on the implementation of strategies and action steps.
Vulnerable Safer Drivers and Impaired Driving
Safer Roads
Road Users Passengers Prevention
As shown in the SHSP Organizational Structure on the next page, the SHSP established 13 emphasis areas
organized under the four Key Areas, including nine CEAs that have developed strategies and action steps for
implementation. Selection of the nine CEAs for the 2021-2025 SHSP Update was a data-driven process and
includes emphasis areas with the highest number of fatalities and serious injuries over the previous five years
(2014-2018). Seven CEAs are consistent with the previous SHSP (Impaired Driving, Intersections, Lane Departures,
Motorcycles, Occupant Protection, Pedestrians and Young Drivers) and there are two new CEAs for the 2021-2025
Update: Safe Speed and Older Drivers.
In addition to the Key Area Task Forces responsible for implementing the plan, the Traffic Records Coordination
Committee (TRCC) focuses on improving the available data to strengthen the ability of safety practitioners to
strategically select and implement strategies. Communications and outreach through the Zero Fatalities program
supports the SHSP implementation. The structure and roles and responsibilities for these groups are provided in
the following sections.
Page 3 02/19/20212021-2025 NEVADA STRATEGIC HIGHWAY SAFETY PLAN
SHSP Organizational Structure
Figure 1. SHSP Organizational Structure
Nevada Executive Committee Traffic Records
on Traffic Safety Coordinating Committee
Key Areas
Vulnerable Safer Drivers and Impaired Driving
Safer Roads
Road Users Passengers Prevention
Safe Speed* Pedestrians* Occupant Impaired
Protection* Driving*
Emphasis Areas
Emphasis Areas
Lane Motorcyclists*
Departures* Older Drivers*
Bicyclists
Intersections* Young Drivers*
Micromobility
Work Zones Distracted
Driving
* = Critical Emphasis Area
Page 4 02/19/20212021-2025 NEVADA STRATEGIC HIGHWAY SAFETY PLAN
Roles and Responsibilities
To keep the SHSP process moving forward, Nevada established roles and responsibilities for each of the entities
involved in the plan. A description of those roles is shown below.
Nevada Executive Committee on Traffic Safety
● Establishes SHSP policies and procedures, reviews progress, provides advice and guidance,
addresses challenges, and removes barriers
● Provides support and assistance to specific SHSP strategies as appropriate
● Consults the SHSP when updating agency or organization plans and programs and shares progress
on safety initiatives
Key Area Task Force Leadership
Safer Roads Vulnerable Road Users Safer Drivers and Passengers Impaired Driving Prevention
● Ensures team membership is multidisciplinary and includes representatives from at least three of the 6 “Es” of
safety and follows up with SHSP implementation team if assistance is needed on team composition
● Schedules group meetings, notifies participants, and prepares meeting reports including action item
implementation progress/status after each meeting
● Tracks progress on implementation of the action plan with assistance from various action step leaders and
notifies the state SHSP coordinators if assistance is needed to implement any action step
● Prepares quarterly progress reports describing what progress has been made on each of the action steps
● Reviews the strategies and determines if any should be revised or deleted, identifies new strategies, and
develops action plans
● Applies the SHSP to help implement a task or project
Traffic Records Coordinating Committee Leadership
● Facilitates the Nevada TRCC and supports the continued improvement of data in the Nevada Citation and
Accident Tracking System (NCATS) and/or other state safety databases
● Supports efforts to ensure that NCATS meets the standards of the Model Minimum Uniform Crash Criteria
(MMUCC)
● Assists with the distribution of NCATS data to government and non-government agencies
● Coordinates the data analysis to support effective SHSP implementation
Page 5 02/19/20212021-2025 NEVADA STRATEGIC HIGHWAY SAFETY PLAN
SHSP Update Process
The 2021-2025 SHSP Update was developed through a collaborative, data-driven process that identified goals for
the four Key Areas and outlined effective strategies and action steps for the nine CEAs. The SHSP Action Plan,
included as a supplementary document, expands on the CEA strategies to include detailed, trackable action steps.
Safety stakeholders from public- and private-sector agencies and organizations representing the 6 “Es” of safety
work together to create and implement the plan under the direction of NECTS.
Stakeholder Involvement
In Summer 2020, safety stakeholders throughout Nevada were surveyed to better understand the perspectives of
those involved in the SHSP process. Responses were received from 77 safety partners, covering all 6 “Es” of traffic
safety. The survey results showed that the SHSP’s greatest strengths included its interagency cooperation and
collaboration, as well as the data-driven nature of the process. Some of the challenges noted by survey
respondents included resources, the legislative process, and the size and geographic diversity of the state. When
asked to discuss possible improvements to the process, many ideas were expressed, but a common response was
increased involvement of local partners and local agencies. Along with an emphasis on accountability and
measurable action steps, stakeholders also indicated that an even greater focus on data-driven activities would be
helpful in reducing fatal and serious injury crashes.
Moving forward, stakeholders indicated that their highest priorities for the 2021-2025 SHSP are data-driven
implementation and resource allocation; increased coordination between federal, state, local, and tribal
entities; and coordination with other safety initiatives such as Vision Zero. Nevada safety stakeholders are
eager to work together to build partnerships that will bring Nevada closer to its goal of Zero Fatalities.
Development of the strategies and action steps for the new SHSP was a year-long effort that involved input from
Chairs, Vice Chairs, Action Step Leaders, and all members of the Task Forces. Task Forces reviewed crash data,
successes, and challenges from the 2016-2020 SHSP to determine new strategies and action steps during the
summer of 2020. The draft SHSP was presented to the NECTS in December 2020. The final document was
approved by the NECTS and provided to NDOT and FHWA for approval in January 2021. The project timeline for the
2021-2025 SHSP is shown in Figure 2.
Figure 2. SHSP Development Timeline
2021 - 2025 SHSP Development Timeline
2020 2021
MAR APR MAY JUN JUL AUG SEP OCT NOV DEC JAN
MAR - MAY JUL - AUG
Data Analysis Finalize Strategies and
Strategy Action Step Assessment Action Steps
MAY - JUN SEP - NOV DEC JAN
Stakeholder Outreach Draft Document Present to Provided
Draft Strategies and NECTS for NDOT
Action Steps and FHWA
Approval
Page 6 02/19/20212021-2025 NEVADA STRATEGIC HIGHWAY SAFETY PLAN
Emphasis Areas
To identify commonalities, causes, and driver factors, statewide traffic-related fatalities, and serious injuries from
the most recent five-year period (2014-2018) were combined for each of the emphasis areas. As shown in Figure 3,
the top categories of combined fatalties and serious injuries for the five-year period include the seven CEAs from
the 2016-2020 SHSP (Impaired Driving, Intersections, Lane Departures, Motorcycles, Occupant Protection,
Pedestrians, and Young Drivers), and two new CEAs, Older Drivers, and Safe Speed. Distracted Driving, Work
Zones, Bicyclists, and Micromobility fatalities and serious injuries are lower on the chart; however, these emphasis
areas will be included in the plan and monitored by the Key Area Task Forces.
Figure 3. Total Fatalities and Serious Injuries and Percent of Total Fatalities
and Serious Injuries by Emphasis Area*
Intersections 2,612 35.0%
Lane Departures 2,043 27.4%
Impaired Driving 1,747 23.4%
Occupant Protection 1,647 22.1%
Emphasis Area
Motorcyclists 1,512 20.3%
Older Drivers 1,280 17.2%
Safe Speed 1,274 17.1%
Pedestrians 1,231 16.5%
Young Drivers 983 13.2%
Distracted Driving 375 5.0%
Work Zones 272 2.5%
Bicycles 128 3.7%
Micromobility 51 0.7%
0 500 1000 1500 2000 2500 3000
FATALITIES AND SERIOUS INJURIES
*Note: A crash may be categorized in more than one emphasis area (e.g., an impaired motorcyclist at an intersection.) Therefore,
the values exceed the total number of fatalities and serious injuries and the sum of the percentages is more than 100%.
Page 7 02/19/20212021-2025 NEVADA STRATEGIC HIGHWAY SAFETY PLAN
2016-2020 SHSP Highlights
Accomplishments of the 2016-2020 SHSP were reviewed to celebrate the successes of the plan and to identify
areas to build upon for the 2021-2025 SHSP. The following list includes a summary of the actions and effective
efforts that were completed during the 2016-2020 SHSP Implementation. The SHSP team and partners are proud
of the accomplishments of the traffic safety community in Nevada.
Coordinated outreach efforts of partners and local agencies to present a consistent Zero Fatalities message
Conducted numerous outreach events to promote Zero Fatalities, including the following campaigns:
● Look Twice
● Don’t Kill a Dream
● Worst Year Ever
● Lives are on the Line
Conducted numerous annual Joining Forces and High-Visibility Enforcement Events
Conducted Advanced Roadside Impaired Driving Enforcement (ARIDE), Drug Recognition Expert (DRE), and Standard Field
Sobriety Test (SFST) training for law enforcement officers
Developed an interactive online crash data tool
Hosted the annual Nevada Traffic Safety Summit for over 200 safety professionals in Las Vegas (2016, 2018) and Reno (2017,
2019), and a virtual Traffic Safety Summit in 2020
Formed the multi-agency Driving Under the Influence (DUI) Strike Team in Southern Nevada, which has made over 2,200
DUI arrests
Formalized Vision Zero Truckee Meadows and adopted a Vision Zero Action Plan for Northern Nevada
Formalized the Young Drivers Task Force, with consistent participation from all “Es” of traffic safety
Completed numerous NDOT Road Safety Assessments (RSAs) and Safety Management Plans (SMPs) statewide
Adopted the NDOT Complete Streets Policy in 2017
Implemented Intersection Control Evaluations (ICE) for intersection analysis
Updated the NDOT Access Management System and Standards document in 2017
Passed a law for Nevada 24/7 Sobriety and Drug Monitoring Program, modeled after Washoe County’s “Sober 24” program
Passed laws to require registration of mopeds and riders to wear a helmet
Utilized WayCare technology to predict traffic incidents and decrease response times on Southern Nevada roadways
Developed Task Force “Legislative Advisory Opinions,” recommendations on traffic-safety-related legislation
Page 8 02/19/20212021-2025 NEVADA STRATEGIC HIGHWAY SAFETY PLAN
SHSP Goals and Performance Measures
The overall goal for Nevada is Zero Fatalities by 2050. There are five performance measures that NDOT is required
to submit to FHWA annually and there performance measures are also be used for the SHSP:
1 Number of fatalities 4 Serious injury rate
2 Number of serious injuries 5 Non-motorized fatalities and serious injuries
3 Fatality rate
The performance measure targets were set to meet Nevada’s goal of Zero Fatalities by 2050. The current trend was
projected through 2021 and then a straight-line reduction from the 2021 projection was calculated to meet the goal.
The following figures show the values used to set the 2025 targets for each performance measure.
Performance Measure 1: Number of Fatalities
The 2025 Target for Performance Measure 1 is 258.8 fatalities.
Figure 4. Nevada Fatalities, Five-Year Average and 2025 Target
Nevada Fatalities
450
390.0 2021 Projection - 310.6
400 2021 Target - 300.2
359.6
325.6
350 329
324
288.6 326 311 329 319.8 315.9
291
300 258.8
261 266 317.2
257 246 304.6 300.2
Fatalities
243 294.6 304
250 278.0
266.2
254.6 264.2
200
2025 Target 258.8
150 2050
Target 0
100
51.8
50
0
2008
2009
2010
2011
2012
2013
2014
2015
2016
2017
2018
2019
2020
2021
2022
2023
2024
2025
2045
2046
2047
2048
2049
2050
# of Fatalities Projected # of Fatalities # of Fatalities: 5-Year Average
Page 9 02/19/20212021-2025 NEVADA STRATEGIC HIGHWAY SAFETY PLAN
Performance Measure 2: Number of Serious Injuries
The 2025 Target for Performance Measure 2 is 823.4 serious injuries.
Figure 5. Nevada Serious Injuries, Five-Year Average and 2025 Target
Nevada Serious Injuries
1,720.0
2000
1,756.6
1647.8
1800
2021 Projection - 988.0
1558 1489.4 2021 Target - 955.1
1600
1412 1265.4
1349
1400 1328 1335.6 1273
Serious Injuries
1219 1212 1228.6 1165.6
1161 1205.2
1200 1077.7
1207 1225.4
1229.6
1240.4
823.4
1000 1102 1090 909.7
824.4
800 1014 955.1
600 2050
2025 Target 823.4 Target 0
400 164.7
200
0
2008
2009
2010
2011
2012
2013
2014
2015
2016
2017
2018
2019
2020
2021
2022
2023
2024
2025
2045
2046
2047
2048
2049
2050
# of Serious Injuries Projected # of Serious Injuries # of Serious Injuries: 5-Year Average
Performance Measure 3: Fatality Rate
The 2025 Target for Performance Measure 3 is 0.893 per 100 Million Vehicle Miles Traveled (VMT).
Figure 6. Nevada FatalityNevada
Rates,Fatality Rate
Five-Year Average and 2025 Target
2 1.844
1.692
1.512 2021 Projection - 1.071
1.56
Fatalities per 100 Million VMT
2021 Target - 1.036
1.5 1.322
1.106 1.26 1.23 1.168
1.19 1.202 1.15 1.170 1.186 1.121
1.16
1.02 0.98 0.893
1 1.16
1.08 1.08 1.098 1.118 1.160 1.13 1.031.036
1.06 2050
Target 0
2025 Target 0.893
0.5
0.179
0
2008
2009
2010
2011
2012
2013
2014
2015
2016
2017
2018
2019
2020
2021
2022
2023
2024
2025
2045
2046
2047
2048
2049
2050
Fatality Rate /100 million VMT Projected Fatality Rate /100 million VMT
Fatality Rate /100 million VMT: 5-Year Average
Page 10 02/19/20212021-2025 NEVADA STRATEGIC HIGHWAY SAFETY PLAN
Performance Measure 4: Serious Injury Rate
The 2025 Target for Performance Measure 4 is 2.792 per 100 Million VMT.
Figure 7. Nevada Serious Injury Rates, Five-Year Average and 2025 Target
Nevada Serious Injury Rate
9.00 8.230
8.040 7.595
Serious Injuries per 100 Million VMT
8.00 7.41 6.861 2021 Projection - 3.351
6.75 2021 Target - 3.239
7.00 5.683
6.00 6.141
6.00 5.45 5.285 5.38
4.974
5.09 4.779
5.00 4.477 4.248
5.12 4.76 5.162 3.757 2025 Target 2.792
4.00
4.51 2.92
4.12
3.00 3.61 2.48 2050
3.62 3.239 Target 0
2.00 2.792
0.558
1.00
0.00
2008
2009
2010
2011
2012
2013
2014
2015
2016
2017
2018
2019
2020
2021
2022
2023
2024
2025
2045
2046
2047
2048
2049
2050
Serious Injury Rate / 100 Million VMT Projected Serious Injury Rate / 100 Million VMT
Serious Injury Rate / 100 Million VMT: 5-Year Average
Performance Measure 5: Non-Motorized Fatalities and Serious Injuries
The 2025 Target for Performance Measure 5 is 233.1 non-motorized fatalities and serious injuries.
Figure 8. Nevada Non-Motorized Fatalities and Serious Injuries,
Five-Year Average and 2025 Target
Nevada Non-Motorized Fatalities and Serious Injuries
400
2021 Projection - 279.7
2021 Target - 270.4
Fatalities and Serious Injuries
350 312.0
307.0 296.7 308 297.9
312 302 281.5 262.8 339299.9
291.7 288.3
300 288
276 272.8 262 303 259.5 233.1
245.1
250 236 238 271.5 270.4
262 254.8261.1
200 252
2025 Target - 233.1
150
2050
Target 0
100
46.6
50
0
2008
2009
2010
2011
2012
2013
2014
2015
2016
2017
2018
2019
2020
2021
2022
2023
2024
2025
2045
2046
2047
2048
2049
2050
# of Non-motorized Fatalities and Serious Injuries Projected # of Non-motorized Fatalities and Serious Injuries
# of Non-motorized Fatalities and Serious Injuries: 5-Year Average
Page 11 02/19/20212021-2025 NEVADA STRATEGIC HIGHWAY SAFETY PLAN
Nevada Traffic Fatalities Compared to Other Western States and
National Average
The following two tables show fatality data for Nevada, three neighboring states, and the national average
for comparison.
Figure 9. 2018 State Fatalities and Fatality Rates Comparison*
Fatality Rates per
State
Population
Traffic Fatalities VMT (Millions)
(thousands) 100,000 100 Million VMT
Population
Arizona 1,010 7,171,646 66,145 14.08 1.53
Idaho 231 1,754,208 17,709 13.17 1.30
Nevada 330 3,034,392 28,319 10.88 1.16
Utah 260 3,161,105 32,069 8.22 0.81
National 36,560 327,167,434 3,240,327 11.17 1.13
*Source: NHTSA 2014-2018 Data Summary
Figure 10. 2018 Percent of Fatalities by Person Type State Comparison*
Percent of Fatalities by Person Type
State
Drivers Passengers Motorcycles Pedestrians Bicyclists Other
Arizona 54.26% 49.60% 14.75% 23.47% 2.28% 0.89%
Idaho 71.43% 64.50% 16.45% 7.36% 0.87% 9.09%
Nevada 59.39% 52.12% 17.88% 23.94% 2.42% 1.52%
Utah 63.85% 60.00% 18.08% 13.85% 1.15% 0.77%
National 62.71% 17.03% 13.38% 17.19% 2.34% 0.15%
*Source: NHTSA 2014-2018 Data Summary
Page 12 02/19/20212021-2025 NEVADA STRATEGIC HIGHWAY SAFETY PLAN
Key Areas
For the 2021-2025 SHSP Update, the 13 emphasis areas are organized under four Key Areas. The Key Areas are
intended to promote collaboration between the emphasis areas to strengthen SHSP implementation. The four Key
Areas include Safer Roads, Vulnerable Road Users, Safer Drivers and Passengers, and Impaired Driving
Prevention. Task Force Chairs will lead quarterly meetings with members of each task force.
As shown in the figure below, nine of the 13 emphasis areas are CEAs with specific strategies and action steps. The
nine CEAs include Safe Speed, Lane Departures, Intersections, Pedestrians, Motorcyclists, Occupant Protection,
Older Drivers, Young Drivers, and Impaired Driving. Based on the most recently available crash data, focusing on
the nine CEAs could have the greatest potential for reducing fatalities and serious injuries as these emphasis areas
historically have higher numbers of fatalities and serious injuries.
The CEAs have a set of strategies and action steps for implementation for the five-year SHSP. Task forces will be
led by a Vice Chair for each CEA and will include action step leaders and other active members. The Key Area Task
Forces will track and discuss any actions for the additional emphasis areas (Work Zones, Bicyclists, Micromobility,
and Distracted Driving).
The following sections highlights crash attributes, data trends and the 2021-2025 Strategies identified for each CEA.
Key Areas
Vulnerable Safer Drivers and Impaired Driving
Safer Roads
Road Users Passengers Prevention
Safe Speed* Pedestrians* Occupant Impaired
Critical Emphasis Areas
Critical Emphasis Areas
Protection* Driving*
Lane Motorcyclists*
Departures* Older Drivers*
Bicyclists
Intersections* Young Drivers*
Micromobility
Work Zones Distracted
Driving * = Critical Area
Page 13 02/19/20212021-2025 NEVADA STRATEGIC HIGHWAY SAFETY PLAN
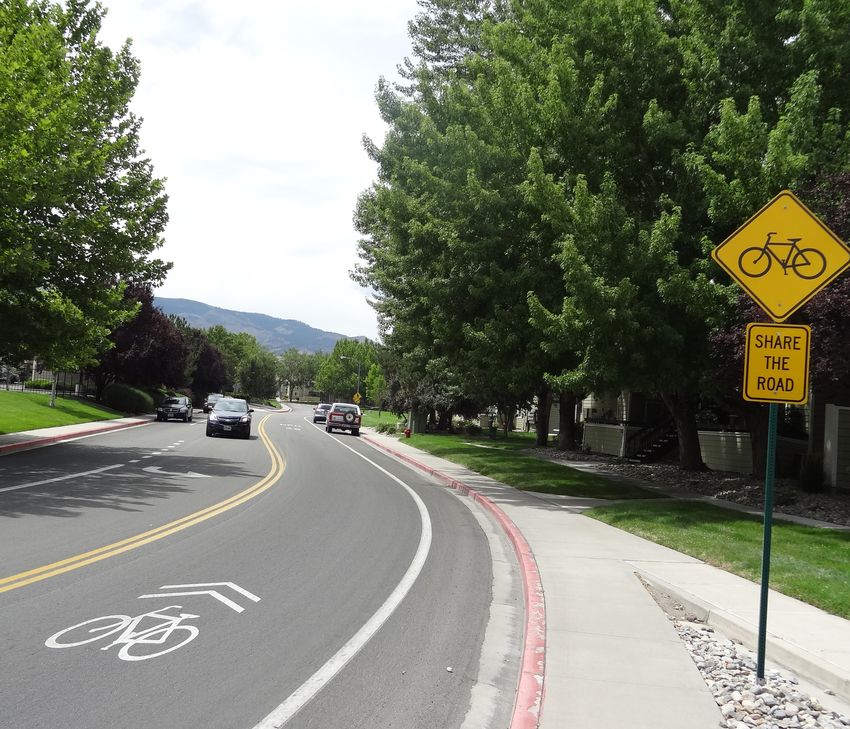
Safer Roads
Safe Speed Lane Departures Intersections Work Zones
The Safer Roads Key Area includes emphasis areas relative to the built environment. The Safer Roads Key Area
will implement actions to reduce fatalities and serious injuries due to Speed, Lane Departures, Intersections, and
Work Zones.
Page 14 02/19/20212021-2025 NEVADA STRATEGIC HIGHWAY SAFETY PLAN
Safer Roads
Safe Speed
Speed-related fatalities have dropped from a high of 126 in 2016 to a low of 93 in 2018.
Serious injuries have decreased from a high of 174 in 2015 to a low of 106 in 2018. However,
speed is a major contributing factor to driver, pedestrian, and bicyclist fatalities, and
accounts for one-third of all traffic fatalities in Nevada. It is known that speed is a
contributing factor in all fatal and serious injury crashes.
As one of Nevada’s new CEAs for the 2021-2025 SHSP, a Safe Speed Task Force will be
formed to implement and track new strategies and action steps that focus on eliminating
fatalities and serious injuries related to vehicles exceeding safe speed. Between 2014 and
2018, the five-year average for speed-related crashes increased 3.9% annually for fatalities
and decreased 0.1% annually for serious injuries.
Average Annual
Percent Change of
Five-Year Average
Figure 11. 2014-2018 Nevada Speed-Related Fatalities
(2014-2018)
150 150
125 105 125
106 105
90 96
100 100
126
Fatalities
75
50
100 112 95 93 75
50
3.9%
25 25
0 0
2014 2015 2016 2017 2018
Year
Per Year Five-Year Average
Figure 12. 2014-2018 Nevada Speed-Related Serious Injuries
175 151 156 155 175
152 150
150 150
160 174 164
125 144 125
Serious Injuries
100 100
106
75
50
75
50 0.1%
25 25
0 0
2014 2015 2016 2017 2018
Year
Per Year Five-Year Average
Speed Related
Page 15 02/19/20212021-2025 NEVADA STRATEGIC HIGHWAY SAFETY PLAN
Safer Roads
Safe Speed
Most Common Fatality and Serious Injury Crash Attributes
● Impairment (60%), Lane Departures (48%), and Occupant Protection (32%) were also
common factors in speed-related fatal crashes (see below)
● Male at-fault drivers, age 21–35
● Male fatalities and serious injuries: age 21–35
● Day of week: Saturday
● Speed-related crashes occured most often during daylight (51%) and in dark but
lighted locations (24%)
● Single vehicle, rear-end, and angle crashes are the most common crash types
Performance Measures
● Number of speed-related fatalities
● Number of speed-related serious injuries
Strategies
1. Advance the use of infrastructure techniques and technology to manage target speeds
and set speed limits
2. Utilize high-visibility speeding enforcement targeted at high-risk locations to reduce
crash severity
3. Improve effectiveness of education and outreach about safe speed and
aggressive driving
Percent of Other CEAs in Speed-Related Fatal Crashes
Impaired Lane Occupant Young
Intersections Motorcyclists Older Drivers Pedestrians
Driving Departures Protection Drivers
60% 48% 32% 31% 26% 15% 13% 7%
Page 16 02/19/20212021-2025 NEVADA STRATEGIC HIGHWAY SAFETY PLAN
Safer Roads
Lane Departures
Lane departure crashes are non-intersection crashes in which a vehicle crosses an edgeline
or lane line and may leave the roadway or cross the centerline. Although lane departure
countermeasures have historically been focused on High-Risk Rural Roads (HRRR), the
focus of the Lane Departure Task Force has been expanded to include urban and suburban
areas. Lane departure fatalities have dropped from a high of 146 in 2015 to a low of 112 in
2018. Serious injuries have decreased from a high of 392 in 2015 to a low of 154 in 2018.
Between 2014 and 2018, the five-year average for lane departures stayed the same for
fatalities and decreased 2.2% for serious injuries. The Lane Departure Task Force has
developed new strategies and action steps to continue progress in eliminating fatalities and
serious injuries occurring from lane departure crashes.
Average Annual
Percent Change of
Lane Departures Five-Year Average
Figure 13. 2014-2018 Nevada Lane Departure Fatalities
(2014-2018)
150 150
123 124 122
120 120
125 125
146
100 119 118 100
112
Fatalities
107
0%
75 75
50 50
25 25
0 0
2014 2015 2016 2017 2018
Year
Per Year Five-Year Average
Figure 14. 2014-2018 Nevada Lane Departure Serious Injuries
400 400
320 329 337
350 322 350
288
300 392 325 300
337
Serious Injuries
250 250
2.2%
200 233 200
150 150
154
100 100
50 50
0 0
2014 2015 2016 2017 2018
Year
Per Year Five-Year Average
Page 17 02/19/20212021-2025 NEVADA STRATEGIC HIGHWAY SAFETY PLAN
Safer Roads
Lane Departures
Most Common Fatality and Serious Injury Crash Attributes
● Impairment (56%), Occupant Protection (41%), and Speed-Related (31%) are all
common factors in Lane Departure fatal crashes (see below)
● Male at-fault drivers, age 26–55
● Day of week: Saturday
● Lane departure crashes occured most often during daylight (54%) and in dark
unlighted locations (18%)
● Single-vehicle, angle, and head-on crashes are the most common crash types
Performance Measures
● Number of lane departure fatalities
● Number of lane departure serious injuries
Strategies
1. Apply proven engineering countermeasures and roadway improvements to keep
vehicles in their lanes
2. Increase survivability in the event of a lane departure through engineering and
emergency response
Percent of Other CEAs in Lane Departures Fatal Crashes
Impaired Occupant Young
Safe Speed Motorcyclists Older Drivers Intersections Pedestrians
Driving Protection Drivers
56% 41% 31% 18% 17% 11% 8% 4%
Page 18 02/19/20212021-2025 NEVADA STRATEGIC HIGHWAY SAFETY PLAN
Safer Roads
Intersections
With different crossing and entering movements by both drivers and pedestrians, an
intersection is one of the most complex traffic situations that motorists encounter.
Intersection fatalities have increased from a low of 88 in 2014 to a high of 105 in 2018.
Serious injuries have decreased from a high of 500 in 2015 to a low of 320 in 2018. Between
2014 and 2018, the five-year average for intersection crashes increased an average of 6.7%
annually for fatalities and decreased an average of 0.7% annually for serious injuries. The
Intersection Safety Task Force has developed new strategies and action steps to continue
progress in eliminating fatalities and serious injuries at intersections.
Average Annual
Percent Change of
Intersections Five-Year Average
Figure 15. 2014-2018 Nevada Intersection Fatalities
(2014-2018)
125 125
96 99
100 91 100
77 81
105
75 108 105 75
Fatalities
6.7%
88 89
50 50
25 25
0 0
2014 2015 2016 2017 2018
Year
Per Year Five-Year Average
Intersections
Figure 16. 2014-2018 Nevada Intersection Serious Injuries
500 439 443 441 443 500
423
400 438 500 400
449 410
Serious Injuries
300 300
320
200 200
0.7%
100 100
0 0
2014 2015 2016 2017 2018
Year
Per Year Five-Year Average
Page 19 02/19/20212021-2025 NEVADA STRATEGIC HIGHWAY SAFETY PLAN
Safer Roads
Intersections
Most Common Fatality and Serious Injury Crash Attributes
● Intersection fatal crashes also included Impairment (46%), Speed-Related (31%), and
Pedestrians (28%) (see below)
● Male at-fault drivers, age 21–45
● Days of week: Friday and Saturday
● Intersection crashes occured most often during daylight (61%) and in dark but lighted
locations (25%)
● Angle, single-vehicle, and rear-end crashes are the most common crash types
Performance Measures
● Number of intersection fatalities
● Number of intersection serious injuries
Strategies
1. Screen the roadway network for high-risk intersections and apply effective and/or
innovative countermeasures
2. Screen the roadway network for high-risk segments and apply effective and/or
innovative countermeasures to improve intersection safety
3. Conduct outreach and education initiatives for target audiences that focus on
eliminating high-risk behaviors at intersections
Percentage of Other CEAs in Intersection Fatal Crashes
Impaired Occupant Young Lane
Safe Speed Pedestrian Older Drivers Motorcyclists
Driving Protection Drivers Departures
46% 31% 28% 25% 19% 15% 13% 10%
Page 20 02/19/20212021-2025 NEVADA STRATEGIC HIGHWAY SAFETY PLAN
Vulnerable Road Users
Pedestrians Motorcyclists Bicyclists Micromobility
The Vulnerable Road Users Key Area includes emphasis areas related to non-motorized road users, such as
pedestrians, bicyclists, those on scooters and other forms of micromobility, and motorcyclists. The Vulnerable
Road Users Key Area includes the CEA Task Forces for Pedestrians and Motorcyclists, which have specific
strategies presented on the following pages. Future actions related to bicyclists and micromobility safety will be
addressed by the task force as needed.
Page 21 02/19/20212021-2025 NEVADA STRATEGIC HIGHWAY SAFETY PLAN
Vulnerable Road Users
Pedestrians
NHTSA estimates that in 2018, 6,283 pedestrians were killed in traffic crashes across the
United States. In Nevada, there were 79 pedestrian fatalities and 158 serious injuries in
2018. Most pedestrian fatalities occurred mid-block on a roadway, and a large percent
occurred in marked crosswalks. The greatest proportion of pedestrian serious injuries
occurred at intersections. Between 2014 and 2018, the five-year average for pedestrian
fatalities increased an average of 8.9% annually and the serious injuries five-year average
increased an average of 4.8% annually. To address the issue, the Pedestrian Safety Task
Force has developed new strategies and action steps for eliminating fatalities and serious
injuries.
Average Annual
Percent Change of
Five-Year Average
Figure 17. 2014-2018: Nevada Pedestrian Fatalities
(2014-2018)
100 100
75 77
80 80
61 67
60 55 91 79 60
Fatalities
80
40 71
66
40 8.9%
20 20
0 0
2014 2015 2016 2017 2018
Year
Per Year Five-Year Average
Figure 18. 2014-2018 Nevada Pedestrian Serious Injuries
200 200
156 169 169
175 150 175
141
150 150
158
Serious Injuries
125
173 193 125
134 186
4.8%
100 100
75 75
50 50
25 25
0 0
2014 2015 2016 2017 2018
Year
Per Year Five-Year Average
Page 22 02/19/20212021-2025 NEVADA STRATEGIC HIGHWAY SAFETY PLAN
Vulnerable Road Users
Pedestrians
Most Common Fatality and Serious Injury Crash Attributes
● Intersections (34%), Impairment (23%), and Older Drivers (13%) are most common
among Pedestrian fatal crashes (see below)
● Male at-fault drivers, age 21–45
● Male pedestrian serious injuries, age 26–55
● Male pedestrian fatalities, age 51–65
● Cashes occurred most often on weekdays (Monday through Friday)
● Time of day: noon to midnight
● Pedestrian crashes occurred most often at night, in dark conditions (76%) and dark
with light conditions (62%)
Performance Measures
● Number of pedestrian fatalities
● Number of pedestrian serious injuries
Strategies
1. Screen the roadway network for high-risk signalized intersections and apply effective
and/or innovative countermeasures for pedestrians
2. Screen the roadway network for high-risk segments and apply effective and/or
innovative countermeasures for pedestrians
3. Conduct outreach and education initiatives for target audiences that focus on
eliminating high-risk pedestrian behaviors
Percentage of Other CEAs in Pedestrian Fatal Crashes
Impaired Lane Young Occupant
Intersections Older Drivers Safe Speed Motorcyclists
Driving Departures Drivers Protection
34% 23% 13% 9% 6% 6% 0% 0%
Page 23 02/19/20212021-2025 NEVADA STRATEGIC HIGHWAY SAFETY PLAN
Vulnerable Road Users
Motorcyclists
Motorcyclist fatalities have dropped from a high of 74 in 2016 to a low of 58 in 2018. Serious
injuries have decreased from a high of 294 in 2016 to a low of 191 in 2018. However, the
five-year average for motorcyclists increased an average of 5.1% annually for fatalities and
increased an average of 3.3% annually for serious injuries between 2014 and 2018. The
Motorcycle Safety Task Force has developed new strategies and action steps to continue
progress in eliminating motorcyclist fatalities and serious injuries.
Average Annual
Percent Change of
Five-Year Average
Figure 19. 2014-2018 Nevada Motorcyclist Fatalities
(2014-2018)
80 80
70 61 61 70
59
60 51 52 60
50 74 58 50
Fatalities
55 54
5.1%
40 63 40
30 30
20 20
10 10
0 0
2014 2015 2016 2017 2018
Year
Per Year Five-Year Average
Figure 20. 2014-2018 Nevada Motorcyclist Serious Injuries
300 300
246 247 242
250 212 228 250
294
Serious Injuries
200 273 200
237 213
3.3%
150 191 150
100 100
50 50
0 0
2014 2015 2016 2017 2018
Year
Per Year Five-Year Average
Page 24 02/19/2021You can also read