The Landscape of Climate Finance 2012 - A CPI Report - Climate Policy Initiative Barbara Buchner Angela Falconer Morgan Hervé-Mignucci Chiara ...
←
→
Page content transcription
If your browser does not render page correctly, please read the page content below
The Landscape of Climate Finance 2012

Climate Policy Initiative

Barbara Buchner
Angela Falconer
Morgan Hervé-Mignucci
Chiara Trabacchi

December 2012

 A CPI Report
Descriptors
       Sector              Multilateral Climate Finance
       Region              International
                           Climate Finance, Private Finance, Public
       Keywords            Finance, Climate Policy, International Climate
                           Negotiations
       Related CPI
                           The Landscape of Climate Finance 2011
       Reports
       Contact             Barbara Buchner, CPI Europe
                           barbara.buchner@cpivenice.org
                           Morgan Hervé-Mignucci, CPI Venice
                           morgan.herve-mignucci@cpivenice.org

    About CPI
    Climate Policy Initiative (CPI) is a policy effectiveness analysis
    and advisory organization whose mission is to assess, diagnose,
    and support the efforts of key governments around the world to
    achieve low-carbon growth.
    CPI is headquartered in San Francisco and has offices around the
    world, which are affiliated with distinguished research institutions.
    Offices include: CPI Beijing affiliated with the School of Public
    Policy and Management at Tsinghua University; CPI Berlin; CPI
    Hyderabad, affiliated with the Indian School of Business; CPI Rio,
    affiliated with Pontifical Catholic University of Rio (PUC-Rio); and
    CPI Venice, affiliated with Fondazione Eni Enrico Mattei (FEEM).
    CPI is an independent, not-for-profit organization that receives
    long-term funding from George Soros.

Copyright © 2012 Climate Policy Initiative www.climatepolicyinitiative.org

All rights reserved. CPI welcomes the use of its material for noncommercial purposes, such
as policy discussions or educational activities, under a Creative Commons Attribution-
NonCommercial-ShareAlike 3.0 Unported License.

For commercial use, please contact admin@cpisf.org.
Acknowledgements The authors wish to thank the following organizations and professionals for their collabora- tion and inputs, including, in alphabetical order, Adaptation Fund, African Development Bank, Agence Française de Développement, Asian Development Bank, Asociación Latino- americana de Instituciones Financieras para el Desarrollo, Banco Nacional de Desenvolvimen- to Economico e Social, BlueNext, Bloomberg New Energy Finance, Climate Investment Funds, Development Bank of Latin America, Development Bank of Southern Africa, E3G, Ecofys, European Bank for Reconstruction and Development, European Climate Foundation, Global Canopy Programme, Global Environmental Facility, Independent Evaluation Group of the World Bank Group, Inter-American Development Bank, International Finance Corporation, Japan International Cooperation Agency, KfW Bankengruppe, Nacional Financiera, Organisa- tion for Economic Co-operation and Development, Overseas Development Institute, Over- seas Private Investment Corporation, The Nature Conservancy, United Nations Environment Programme, UNFCCC Secretariat, World Bank, and the World Wildlife Fund. Experts in these organizations were critical in helping us better understand the available data, the various linkages between flows, and our work has benefited substantially from the many discussions. The authors would like to acknowledge and thank the following professionals for their cooperation and contributions: Claudio Alatorre Frenk, Philippe Ambrosi, Amal-Lee Amin, Geraldine Ang, Sabrina Archambault, Joumana Asso, Andreas Biermann, Simon Billett, Neil Bird, Lucas Bossard, Milena Breisinger, Alice Caravani, Sarah Carta, Ken Chomitz, Christa Clapp, Jan Corfee-Morlot, Júlia Silva Dolado Tundidor, Mafalda Duarte, Jane Ebinger, Ubaldo Elizondo, Jane Ellis, Pierre Forestier, Jorge Gastelumendi, Valerie Gaveau, Guido Geissler, Pierre Guigon, Erik Haites, Jochen Harnisch, Kyosuke Inada, Marcelo Jordan, Sumalee Khosla, Ale- jandro Kilpatrick, Franka Kingel, Hafiz Mirza, Enrique Nieto, Chantal Naidoo, Ros Nightingale, Christina Rollin, Lisa Ryan, Matt Leggett, Abraham Louw, Johanna Lütterfelds, David S. Mc- Cauley, Ariane Meier, Kawamura Mihoko, John E. Morton, Smita Nakhooda, Valeria Pacardo, Charlie Parker, Cecilia Piemonte, Camilo Rojas, Eric Usher, Eduardo Vasquez Kunze, Sheelagh Whitley and Ming Yang. Finally the authors would like to acknowledge the contribution of the following CPI experts for the briefs on specific countries studies featured in the report: Rodney Boyd, Joana Chia- vari, Wenjuan Dong, Shobit Goel, Uday Varadarajan, Yuqing Ariel Yu. A special thanks also to Ruby Barcklay, Gianleo Frisari, Tom Heller, Ingmar Juergens, Valerio Micale, David Nelson, Elysha Rom-Povolo, Gireesh Shrimali, Tim Varga, Jane Wilkinson and Marni Wood for their help, useful comments, suggestions and internal review. Preface Mapping the landscape of climate finance across the world is a work in progress – we aim to provide the best possible information, but cannot claim to have captured everything. Comments and clarifications on the numbers, tracking methods, and sources are very welcome.
The Landscape of Climate Finance 2012                                                                    December 2012

Executive Summary                                             Public Sources
Climate finance has been a key topic in recent interna-
tional climate negotiations. Understanding how much             Public sources ranged at least between USD
and what type of finance is available to advance low-           16-23 billion, or 5-6%, of the total amount. A
carbon growth and combat climate change at a global             large proportion of this amount reflects domes-
level is critical to scaling up finance and ensuring that       tic government support to renewable energy
resources are used effectively.                                 projects and related infrastructure, as engines of
                                                                economic growth.
The Landscape of Climate Finance 2012 estimates
that annual global climate finance flows reached
                                                              Notwithstanding fiscal austerity and the tightening
approximately USD 343-385 billion, on average                 credit context, the public sector increased funding for
USD 364 billion, in 2010/2011. This figure rep-               low-carbon, climate-resilient development. Notably,
resents an increase from last year’s report, mostly           bilateral Official Development Assistance grew from
because of the expanded scope of this year’s study (See       USD 9.5 billion in 2009 to an estimated USD 23 billion
Box ES-1), but still falls short of the investment required   in 2010, reflecting the impact of fast-start finance
to limit global temperature rise to below two degrees         pledges, which we estimate accounted for around
Celsius. To achieve this goal, the International Energy       36% of Official Development Assistance in 2010. A
Agency projects that incremental investment in the            large portion of this Official Development Assistance
energy sector will need to reach USD 36 trillion over the     was subsequently intermediated by Bilateral Finance
period of 2012-2050 – or approximately USD 1 trillion         Institutions.
each year.
                                                              The Landscape 2012 captures a broader range of public
The private sector contributed the majority of                domestic flows in developed and developing coun-
finance (USD 217-243 billion), mostly from devel-             tries. We found that almost USD 11 billion was spent
oped country actors. The public sector (USD 16-23             to support domestic renewable energy projects. This
billion) acted as a catalyst for private finance as           spending was largely related to the tail end of the U.S.
well as providing bilateral aid to other develop-             ‘green’ economic stimulus packages.
ing countries. A large proportion of public finance
                                                              Furthermore, our investigation of the ownership struc-
reflected domestic government support toward struc-
                                                              tures of seemingly private investments indicates that a
tural changes in energy systems as engines of economic
                                                              large portion of these investments could be classified
growth.
                                                              as governments’ direct and indirect shareholdings and
Public and private intermediaries, especially                 lending to private investment structures. While we
national development banks and commercial                     have not included these types of government invest-
                                                              ments in this year’s finance flows diagram, our prelimi-
banks, played an important role raising and
                                                              nary investigation identified USD 51 billion of public
channelling global climate finance (USD 110-120               money sitting behind private investments, mostly in
billion), as well as supporting the creation of an envi-      developing countries and in particular, China.
ronment conducive to private sector investment.

Emerging economies were key recipients of
climate finance, but were also important sources.
Roughly one third of global mitigation investments were
located in China, Brazil, and India. A significant share of
this was raised domestically and invested in pursuit of
national development mandates.

The following provides more detailed findings for each
stage of the lifecycle of climate finance flows – from
public sources, private sources, through to intermediar-
ies, instruments, and uses.

4
December 2012 The Landscape of Climate Finance 2012
Box ES-1: Building an understanding of climate finance
CPI’s Landscape of Climate Finance 2011 represented the first attempt to map the lifecycle of climate finance
flows across the globe. This year’s study, the Landscape 2012, builds and improves upon our previous work
using data from the latest year available, mostly 2011.
Compared with the Landscape 2011, the Landscape 2012 aims to provide, to the extent possible: an expanded
geographical scope, covering more flows between and within countries; expanded coverage of players,
including broader coverage of private and public actors; a more detailed representation of private sector flows,
with a better picture of sources and uses; an improved representation of uses by economic sector, including
flows toward adaptation, improving land use, and preventing deforestation; and a better understanding of the
final users of climate finance.
While the Landscape 2012 provides real insights about global climate finance, this exercise is still a work in
progress. External factors continue to hinder our collective understanding of the scope, true magnitude,
nature, and effectiveness of global climate finance flows.
Future steps need to resolve the following key issues to build an understanding of climate finance:
• Further expansion of scope and coverage. Climate finance configurations differ by country and
circumstance and a variety of actors with distinctive responsibilities exist. There needs to be a better
understanding of the different actors, including the various players in the private sector, and Development
Finance Institutions at the international, national and local levels. To inform the debate on climate finance
effectiveness, better sectoral and geographic information on the uses of money is also required.
• A net perspective. The Landscape 2012 takes both incremental costs and investment capital into
account, and focuses on gross flows due to the difficulty of calculating incremental cost and net values
of all finance flows. To create a more precise picture, we need more information about net flows and
incremental costs compared to business-as-usual, or ‘brown’, investments.
• A sound understanding of how effectively financial flows are being used, and whether they address the
challenges posed by climate change and global needs. In addition to CPI’s effort to build up an evidence-
based, bottom-up database of success and failure stories related to climate finance (the San Giorgio
Group case studies*), there is a need to explore whether finance flows represented in the Landscape have
been effective.
• A benchmark on business-as-usual, or ‘brown’, finance flows. To put climate finance estimates into
perspective, comparable estimates of traditional polluting investments are a useful benchmark to check
whether there is real progress towards a low-carbon, climate-resilient future.
A comprehensive picture of climate finance flows is essential to ensure that governments and policymakers
have the knowledge and tools to spend their money most effectively. CPI remains committed to improving the
understanding and transparency of today’s climate finance landscape to help countries learn how to spend
money wisely.
* The San Giorgio Group is a working group of key financial intermediaries and institutions actively engaged in green, low-emissions finance. Led by
CPI, the World Bank Group, OECD, and CLP, the mission of the Group is to provide valuable insights on how to scale up climate finance and spend
available resources more wisely. To this end, CPI is examining a series of case studies to determine how public money can catalyze and incentiv-
ize private investment in low-carbon technologies, and to provide lessons for scaling up green finance.
5The Landscape of Climate Finance 2012 December 2012
Private Sources Intermediaries
Private finance continued to represent the lion’s Public and private financial institutions played
share of total climate finance flows with USD an important role in the climate finance land-
217-243 billion, or 63% of the total. Close to two- scape, raising and channelling USD 110-120
thirds of private finance came from developed billion. Public intermediaries (such as Multilateral,
countries. Bilateral, and National Development Banks)
distributed USD 77 billion, or about 67% of these
In developed countries, private actors contributed resources. Public intermediaries can also enable
USD 143 billion, with USD 68-70 billion in asset private investment and help make projects
finance. Fifty-five percent of projects were financed on viable.
a balance sheet basis while 45% were funded through
project-level finance. Commercial banks were the
leading providers of project-level debt (77%), while Development Finance Institutions (multilateral, bilat-
domestic public budgets contributed around 17%, and eral, and national) continued to play a pivotal role, dis-
corporate players contributed around 6%. In devel- tributing climate finance of around USD 77 billion. This
oped countries, domestic private actors contributed represented about 21% of global climate finance flows.
the most to overall asset finance investment flows In addition, domestic and international development
(84%). Investment by private actors from other OECD agencies played a critical role in channeling bilateral aid.
members (almost exclusively developed countries) rep- Increased international focus on the role of National
resented around 12% of investment, and investment by and Sub-regional Development Banks made it pos-
private actors from non-OECD countries made up the sible to gather more detailed information about the
remaining 4%. climate finance flows and the role of these intermediar-
In developing countries, private actors contributed ies in managing and disbursing funds. Together with
USD 85 billion, with USD 64-87 billion in asset Bilateral Finance Institutions, these banks distributed
finance. Four out of five projects were financed on a the majority of intermediated climate finance (USD 54
balance sheet basis. This headline obscures important billion) and played a growing role enabling the transi-
country-specific trends, such as the role of National tion to low-carbon and climate resilient development
Development Banks in encouraging private investments in the countries where they operate. In fact, 89% of
at the local level. In particular, the Brazilian National total climate finance from National and Sub-regional
Development Bank (BNDES) played a central role in Development Banks was invested in the country in
financing wind power generation in Brazil. We estimate which these institutions are located.
that domestic private actors contributed up to 83% of National Development Banks in emerging economies,
private investments in developing countries. Private such as the Brazilian and the Chinese development
investors from OECD countries contributed 15% while banks, channeled the largest share. Local budget
non-OECD actors made up the remaining 2%. contributions to climate compatible activities in these
The inclusion of small-scale renewable energy finance countries was particularly evident in Brazil where the
(almost exclusively in developed countries) in the Brazilian Development Bank’s concessional support
Landscape 2012 highlights the significant contribution of to renewable power generation projects reflected the
households and corporate actors (USD 83 billion). government’s backing for the Bank’s operations, in the
pursuit of its policy targets.
It is important to acknowledge the complex interplay
between actors at different stages of the lifecycle of
climate flows. Multilateral and bilateral entities tend to
rely on national actors’ closer proximity and knowledge
of the local market, with the objective of channeling
money more effectively. National actors, on the other
hand, benefit from the expertise of international inter-
mediaries to develop their capacity to assess, analyze,
and structure green investment projects, or appraise the
6December 2012 The Landscape of Climate Finance 2012
risk profiles of developers. In turn, this allows national for low-carbon technologies to compete with traditional,
institutions to pass knowledge to the local banking fuel-based alternatives.
system to unlock its financing potential and exploit its
ability to reach a wide group of recipients. Beyond grants, loans, equity, and debt finance, a variety
of risk management instruments help to overcome
Dedicated Climate Funds typically managed by risk barriers and encourage low-carbon technologies
multilateral, bilateral, and national intermediaries to scale up. Public-private facilities and guarantees to
contributed at least USD 1.5 billion to overall flows. assume regulatory, credit, or perceived technology risks,
Their importance is likely to grow given their capacity are just some of the instruments that can remove the
to catalyze and coordinate resources for co-financing, risks private actors are not willing or capable of bearing.
including at national levels.
Private commercial banks and infrastructure funds
intermediated around USD 38 billion, including project-
Uses
level debt and direct investments. Private intermediar-
ies played a particularly critical role by providing the Mitigation activities attracted USD 350 billion,
scale of finance and financial toolboxes able to address mostly related to renewable energy and energy
the specific needs of ‘green’ and innovative investment efficiency. Emerging economies were key recipi-
interventions (e.g. concentrated solar power, etc.). On ents of climate finance. Close to 33% of mitiga-
the other hand, project developers provided equity tion-related finance was invested in China, Brazil,
capital and know-how. and India.
Instruments The majority of funding captured by the Landscape 2012
was spent on mitigation activities. Compared to the
Our analysis of instruments indicates that most Landscape 2011, there was progress in understanding
climate finance, USD 293-347 billion out of USD adaptation finance due to increased tracking efforts.
364 billion, can be classified as investments in However, weaknesses in defining and tracking adap-
which public or private financial institutions had tation finance, partial reporting by some multilateral
an ownership interest or claim – that is, money players, and the inability of existing efforts to capture
which has to be paid back – rather than as contri- private flows dedicated to such activities hampered our
butions to incremental costs. understanding of adaptation finance flows.
Public intermediaries enabled otherwise unviable The bulk of financing captured went to renewable
projects through the use of instruments such as energy generation projects and energy efficiency,
concessional loans and grants. accounting for 85% and 4% of the total respectively.
This reflects governments’ low-carbon growth ambi-
Around USD 293 billion was in the form of market tions, the commercial viability of a broad range of
rate loans and equity, of which USD 262 billion had proven technologies, the profit-driven character of
been made by the private sector. Green credit lines as private investments, and the data sources we had
well as support for institutional development were also access to.
intended to attract local financial institutions to on-lend This report confirms that public financial institutions are
to projects that would not otherwise be implemented playing an essential role in financing clean energy, allo-
and to favor private sector investment. cating more than 60% of their intermediated financial
Public intermediaries enabled investments by filling flows to renewable energy and energy efficiency. They
capacity and viability gaps that prevented private are also essential for financing adaptation measures,
investors from engaging in capital-intensive, riskier, contributing up to USD 11 billion and, even more impor-
and in the short-term, less profitable ventures. Public tantly, managing and implementing some of the relevant
intermediaries delivered more than 60% of their financ- adaptation funds.
ing through concessional loans and about 7% in grant The allocation of climate finance between developed
form. Lowering the cost of debt in this way is essential and developing countries was relatively balanced, with
USD 193 billion, or 53%, going to projects in developed
7The Landscape of Climate Finance 2012 December 2012 countries and USD 172 billion, or 47%, to projects in developing countries. Emerging giants such as China, Brazil, and India were the largest recipients of global mitigation-directed climate finance flows, with USD 171 billion, close to 33% of the total. This implies that investments have been made where they are needed most and where mitiga- tion potential is the greatest. Notably, a significant share of this was raised domestically and invested in pursuit of development mandates. 8
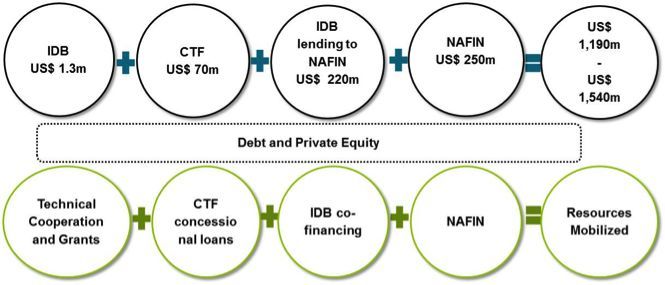
Figure 1: Climate Finance Flows Diagram 2012* (in USD billions)
The Landscape of Climate Finance 2012
9
THE CLIMATE FINANCE FLOWS DIAGRAM 2012
*Notes: Figures are indicative estimates of annual flows for the latest year available, 2010 or 2011 (variable according to the data source). Flows are expressed in USD billions
and rounded to produce whole numbers. Estimates spanning multiple years are adjusted to produce annual-equivalent estimates. Where ranges of estimates are available,
the mid-point is presented. The diagram distinguishes between ‘incremental costs,’ that is, financial resources that cover the price difference between a cheaper, more polluting options
and costlier, climate-friendly ones and do not need to be paid back — and ‘capital investment,’ which are tangible investments in mitigation or adaptation projects that need to be paid
back. Categories not representing capital investment, or a mix of capital investment and incremental costs, are incremental costs only. The group of National Finance Institutions includes
The Climate Finance Flows Diagram 2012, also known as the ‘spaghetti’ diagram, illustrates the landscape of climate finance flows along their Sub-regional entities. Most data presented relates to commitments in a given year due to limited availability of disbursement data.
life cycle for the latest year available, mostly 2011. The width of the arrows in the diagram represents the relative size of the flows.
SOUR C ES A N D IN TER M ED IA R IES IN STR UM ENTS C HA N NE L S U SE S
$19
NE POLICY INCENTIVES
AGENCIES $14 ADAPTATION
NE
CARBON MARKET $2
RISK MANAGEMENT
REVENUES
DEVELOPMENT REDD
FINANCE INSTITUTIONS $5
$7 CARBON OFFSET FINANCE
CARBON- GOVERNMENT NE NATIONAL BILATERAL
RELATED TAXES BUDGETS $77
MULTILATERAL GRANTS $13
NE CLIMATE FUNDS
GENERAL TAX $47 LOW-COST
REVENUES $53
PROJECT DEBT
NE
NE
$23
PROJECT-LEVEL
COMMERCIAL FINANCIAL 32 MARKET RATE DEBT
$57
INSTITUTIONS $32
NE INSTITUTIONAL DIFFERENTThe Landscape of Climate Finance 2012 December 2012
CONT ENTS
1 INTRODUCTION 11
2 METHODOLOGY 12
2.1. Definitions 12
2.2. Analytical focus 14
2.3. Innovations in this year’s study 15
3 THE CURRENT LANDSCAPE OF CLIMATE FINANCE FLOWS 18
3.1 Sources and intermediaries 18
3.2 Intermediaries 32
3.3 Instruments 43
3.4 Disbursement channels 49
3.5 Uses 49
4 CONCLUSIONS AND THE WAY FORWARD 61
INDEX OF ACRONYMS 65
GLOSSARY 66
REFERENCES 68
WEBSITES 73
APPENDIX A - MAIN ASSUMPTIONS AND METHODOLOGY 75
APPENDIX B - A SUMMARY OF THE LANDSCAPE 2011 76
APPENDIX C - EXISTING CLIMATE FINANCE TRACKING DATABASES AND MAJOR ONGOING INITIATIVES 77
APPENDIX D - DETAILS ON DEVELOPMENT FINANCE INSTITUTIONS 79
APPENDIX E - DETAILS ON CLIMATE FUNDS 82
APPENDIX F - FINANCIAL FLOWS FOR REDD+ 84
10December 2012 The Landscape of Climate Finance 2012
1 Introduction • A better understanding of the recipients and
final uses of climate finance, both in terms of
Climate change is a global challenge that requires a sectoral uses and of geographical destination.
global response. Failure to comprehend the global
context of the financing challenge will undermine our This report has three main sections. Section 2 outlines
ability to accurately assess whether current investments our methodology including key definitions and differ-
are on track and made where they can deliver the great- ences compared to the Landscape 2011. Section 3, the
est impacts to limit global temperature rise to below main body, describes the current landscape of climate
two degrees Celsius. To achieve this temperature goal, finance flows along their lifecycle, from sources through
the International Energy Agency projects that incre- to intermediaries, instruments, channels, and end uses.
mental investment in the energy sector alone will need Section 4 summarizes our findings and provides brief
to reach USD 36 trillion over the period of 2012-2050 – recommendations to improve existing climate finance
or approximately USD 1 trillion each year (IEA, 2012). tracking efforts.
The aim of this study is to contribute understanding on
how much and what type of financial support is avail-
able globally to advance action on low-carbon, climate
resilient development. Ultimately, building this under-
standing is essential for ensuring that governments and
investors everywhere have the knowledge and tools to
spend their money in ways that optimize prospects for
achieving the transition.
The first Landscape of Climate Finance, published in 2011
(Landscape 2011), was the most comprehensive over-
view of the global climate finance landscape to-date.
This year’s study (Landscape 2012) aims to improve
on last year’s estimates and add deeper insight into
the nature of global climate finance. It provides a more
detailed breakdown of flows and sheds light on the
latest trends.
The Landscape 2012 aims to provide, to the extent
possible:
• An expanded geographical scope, covering
flows between developing countries (‘South-
South’), from developed to developing countries
and domestic climate finance flows;
• An expanded coverage of national, sub-
regional, regional, and international public
actors;
• A more detailed representation of private
sector climate finance flows, with a better
picture of sources and uses;
• An improved representation of climate finance
uses by sector (sectoral uses), including flows
to adaptation and to reducing emissions from
deforestation and forest degradation, “plus” the
sustainable management and conservation of
forests, and the enhancement of carbon stocks
in developing countries (known as REDD+
schemes); and
11The Landscape of Climate Finance 2012 December 2012
2 Methodology and which is typically referred to as ‘climate-relevant’
finance (see Corfee-Morlot et al., 2009, and Buchner et
This study, the Landscape 2012, aims to capture the most al., 2011).
recent annual climate finance flows supporting (1) emis-
sion reductions, (2) climate resilience, and (3) enabling Tangible versus intangible investments
environment projects.1
In the Landscape 2012, we included, to the extent pos-
Building upon the Landscape 2011, we adopt a two- sible (depending on the granularity of data available)
dimensional framework for this study: First, flows are only investment flows made toward tangible physical
categorized alongside their lifecycle (sources, interme- assets like, for instance, wind farms. We excluded, to
diaries, instruments, disbursement channels, and final the extent possible, investment in measures such as
sectoral uses / geographic destination of recipients). research and development, manufacturing, or deploy-
Second, flows are categorized depending on whether ment, because these might not ultimately result in
they originate from public or private sources (see tax- emission reductions and to reduce the risk of double
onomy section in the Landscape 2011). counting money going to specific emission reductions.2
We gathered empirical data on climate finance flows The Landscape 2012’s focus on money for emission
from a wide range of sources (main assumptions and reductions, climate resilience, and enabling environment
sources are listed in Appendix A and the References projects in the year 2010/2011 excludes future commit-
section), relying on (1) readily-available data, (2) data- ments, such as policy incentives (that are not upfront
sets we analyzed and (3) our own estimates. We also capital grants) or risk management instruments (loan
drew upon expert opinions to estimate certain flows. guarantees or insurance policies). The rationale is that
we are tracking money actually in the system, rather
2.1. Definitions than potential future amounts that may pay for things
other than investment costs (e.g. premiums for green
Climate-specific versus climate-related electricity, carbon credit purchases, payments for loan
investments defaults). 3 The objective is to avoid double counting
for example, the face value of full loan guarantees and
The lack of an internationally-acknowledged defini-
loans, or discounted expected feed-in tariff payments,
tion of what qualifies as climate finance, or even more
with the investment cost.4 The general roles of current
narrowly what qualifies as a climate project, presents a
policy mechanisms and risk management instruments
major challenge to understanding the scale of financial
are represented in the Climate Finance Flows Diagram
flows; there is no established basis for a methodology
2012 as they play a central role in the investment and
or measurement system for tracking climate finance
financing decision-making process, but we do not esti-
flows (Buchner et al., 2011a,b). This is particularly chal-
mate flow values for them.
lenging in the context of adaptation.
For the purposes of this study, finance flows are limited
to ‘climate-specific finance,’ referring specifically to
capital flows targeting low-carbon and climate-resilient
development. It can have direct or indirect greenhouse
gas mitigation or adaptation objectives/outcomes. Note 2 Examples such as Chinese solar panels that are deployed in Italy indicate
the difficulty in attributing a specific technological breakthrough or
that climate-specific finance excludes a broader set of
spillover effects to R&D expenditures in a given country or year.
capital from developed to developing countries that
3 The methodologies used in this report to calculate global finance flows are
may influence, directly or indirectly, emissions and/or
not intended to imply which (or which proportion) of these contributions
vulnerability to climate change in developing countries, to climate finance should count toward the goal to mobilize US 100 billion
per year by 2020 to assist developing countries’ climate responses, and
1 “Enabling environment projects” typically include efforts to strengthen which (or which proportions) should not. Nothing in this report is meant to
institutions, to establish policies, regulations or laws and to remove tech- infer that the goal (of mobilizing US 100 billion per year by 2020 to assist
nical, legal and administrative barriers to investment. The Landscape 2011 developing countries’ climate responses) has already been achieved.
included some climate finance targeting enabling environment projects, 4 Furthermore, there is a potential gap between what institutions report at
but was not labelled as such. The Landscape 2012, instead, explicitly cap- the time of offering risk management instruments (such as the face value
tures financing for capacity building and technical assistance measures, of a full or a partial risk guarantee, the premium collected on such instru-
such as, for instance, the financing of feasibility studies for projects, and ments, or corresponding accounting provisions) and the actual amount
the development of local financial institutions’ capacity. that may be spent in the future.
12December 2012 The Landscape of Climate Finance 2012
Incremental costs versus investment capital section 3.5 on climate finance sectoral uses specifies
this information whenever available.
Incremental cost and investment capital are
both important lenses for climate finance flows.
Mixed reporting years
Incremental cost refers to financial resources provided
to compensate for the difference between a less costly, Our estimates of climate finance are based on the most
more polluting option and a costlier, more environmen- recent data available. The Landscape 2012 uses a mix of
tally-friendly and/or climate-resilient one. Investment 2010 and 2011 data.7
capital refers to tangible investment in mitigation or
We used different sources of information to map exist-
adaptation projects. Whereas investment capital is
ing flows of climate finance. We had a choice of using
paid back to the investor, incremental costs often are
2010 data only or reporting 2011 data for a significant
not and are thus often funded with public climate
part of the Landscape (most importantly, Bloomberg
funds, either through policy support or concessional
New Energy Finance data on private flows). We selected
finance. 5 Whether incremental costs are covered by
the latter option in order to (1) highlight the most
public support often make the difference in whether the
current trends in financing despite reporting delays
private sector invests in a project. Almost all costs asso-
in some areas, and (2) provide consistency from year
ciated with REDD+ measures are incremental costs.
to year, so that the Landscape 2012 picks up where the
Our work captures mostly investment capital rather Landscape 2011 left off. Where flows span several years,
than incremental support (see previous sub-section). In we annualized them to make them compatible with
order to get to the incremental cost value of emission other data sources.
reductions, climate-resilience, and enabling environ-
ment projects, we need assumptions for baselines Commitment versus disbursement data
against which we measure the incremental cost. Such
We report committed finance rather than disbursed
baselines are project-specific and would require us to
finance. New commitment signifies the concrete
make debatable assumptions on what fair baselines
commitment of money by the means of a closure of a
would be. More efforts are needed to address this issue
financing contract, board decisions on investment, loan
in-depth.
award announcements or similar actions. Commitment
finance does not imply that money will immediately
Gross value versus net value flow as a lump sum to project developers.8 There might
Climate finance can be measured in terms of ‘gross’ be a time lag between commitments and disbursement.
or ‘net’ metrics (AGF, 2010).6 The Landscape 2012 But, while disbursement information provides a more
focuses on gross flows, which reflect the full volume of accurate picture of actual climate finance flows than
financial flows delivered through all instruments, rather commitment information, disbursement data is not as
than net flows, which provide an indication of the final universally available.9 In addition, 2010/2011 disburse-
net contribution of investors and countries. Gross flows ment data can reflect commitments spanning several
include money that has to be paid back by recipients, years for projects with long construction periods.
i.e. concessional and non-concessional loans and equity. Disbursement data would therefore require further
Nonetheless, they shed light on the level of mobilized refinement. For these reasons, we mostly use commit-
international investments and the net contribution of ment data in the Landscape 2012.10
countries.
7 Data derived from OECD’s Creditor Reporting System Aid Activities data-
More efforts are needed to break down contributions base (OECD CRS), namely public budget and the EU Institutions’ climate
by gross or net value. As a first step into this direction, finance data, refer to 2010, while the others are all 2011 data, or presenting
5 In the case of energy efficiency the additional upfront costs do need to be the fiscal year 2011 (e.g., July 2010-June 2011, depending on the accounting
paid back, but are expected to be compensated with energy savings over methodologies). Philanthropy data, instead, refer to 2008/2009.
time. Also, they can be paid for by private investors since they do get paid 8 A complicating factor is that there is a range of interpretations of what
back. commitment actually constitutes.
6 Under the approach, flows would represent the financial flows transferred 9 In “The German Landscape of Climate Finance” (CPI, 2012), the granularity
to countries in any given year (these include grants, concessional and of data at the national level allowed the authors to rely on disbursement
non-concessional loans mobilised through the bilateral and multilateral data to a greater extent.
institutions, private capital flows and flows from GHG offset projects). 10 Where available, we used disbursement figures. In the case of Climate
Under the approach, amounts repaid by the recipient countries would be Funds, we include annual commitments approved for specific projects
deducted (e.g. repayments of loan principal, repatriation of capital). rather than total pledges to the Funds which are disbursed over a number
13The Landscape of Climate Finance 2012 December 2012
Reporting currency Finance Flows Diagram 2012 (also known as the ‘spa-
ghetti’ diagram) compared to the Climate Finance Flows
All the flows in this report have been converted to USD
Diagram 2011. In particular, inflows need not match out-
billion when reported in other currencies. Appendix A
flows. For example, a development bank may have com-
provides more details on the exchange rates used.
mitted USD 3 billion in 2011 even though it only received
USD 500 million of aid contribution the same year from
2.2. Analytical focus public budgets — this doesn’t mean this bank is par-
ticularly good at leveraging money or in the opposite
The Landscape of climate finance focuses on case, that it is wasting money because the flows do not
tangible, project-level primary financing flows. capture other ownership and assets. By capturing flows
in this way, we are also able to highlight where money
may be sitting with a given actor within the landscape of
Project-level primary financing climate finance.
The gold standard in our analysis is project-level The linearity of the lifecycle of flows is however a
financing data. Project-level financing data is as close simplification. Flows are categorized alongside the
as we can get to emission reductions, enhanced lifecycle of flows (sources, intermediaries, instruments,
climate resilience, and a stronger enabling environment. disbursement channels and uses / recipients) as though
In the instrument section we therefore define “instru- the lifecycle was a linear path. In reality, pathways for
ments” as the instruments covering project costs in the finance are more complex and involve (1) feedback
reporting year, or primary financing instruments. We loops, i.e. money can go back and forth between differ-
exclude instruments that cover financing costs, that is, ent actors, (2) multiple layers and cascades of equity
secondary market instruments11. The exception to this ownership, and (3) intermediate layers of instruments,
rule relates to Development Finance Institutions, whose e.g. between government budgets and National Finance
flows can include instruments that cover committed Institutions.13
money to a specific sector, or actor.
Secondary market transactions do not represent new Ranges for estimated values
money targeting climate finance but rather money Given the uncertainty surrounding some data sources,
changing hands. Focusing on primary tangible invest- the multiple potential approaches to estimating specific
ments allows us to more accurately estimate financing climate finance flows, and the lack of agreement on
that supports low-carbon, climate-resilient activities. climate finance definitions and boundaries, we opted
to represent climate finance flows as ranges whenever
Finance flows possible, rather than conveying a single-point estimate.
This year, we have solely captured flows among actors For example, data ranges for renewable energy asset
rather than (1) any ownership or claims one actor may finance depends on data sources for non-domestic
have on another and (2) readily-available resources (net money (either Bloomberg New Energy Finance or
income, debt secured and shareholders’ equity from UNCTAD Foreign Direct Investment data). For the sake
prior years)12. of readability, the numbers reproduced on the Climate
Finance Flows Diagram 2012 correspond to mid-points.
The flow-only representation has strong implications on
what is being covered and represented in the Climate
of years. Likewise, for DFIs we include annual commitments i.e. funds ap-
proved for projects in a given budget year (UNEP 2011 presents what dif-
ferent BFIs mean as “committed” funds). Only one organization surveyed
provided disbursement data rather than commitments.
11 For example, consider a project in which a utility invests money from its
own balance sheet to finance a new onshore wind farm. With our focus on
project-level financing, we would categorize this investment as balance
sheet financing. We do not examine where the corporate money is coming
from (borrowing programmes, on-going activities, capital increase or sale
of non-strategic assets). 13 Depending on where you draw the line, you could have many layers of
12 In this sense, we are also capturing payments (or estimates of payments) source to instrument to recipient, with each recipient becoming a source
for carbon finance. itself.
14December 2012 The Landscape of Climate Finance 2012
2.3. Innovations in this year’s study light on private finance flows. In the Landscape 2011,
private flows were captured in two categories, “global
capital markets” and “private finance.” In the Landscape
The Landscape 2012 improves on the Landscape 2012, we strove to better categorize private flows. The
2011 by including a broader geographic scope that Landscape 2011 “global capital markets” category has
covers developed as well as developing countries, been broken down into “commercial financial institu-
and domestic flows; better categorization of the tions,” “institutional investors,” and “venture capital,
actors involved; a better understanding of what’s private equity, and infrastructure funds.” Likewise,
behind private finance flows; and extended “private finance” was broken down into “corporate
coverage of Development Finance Institutions. actors,” “project developers,” and “households.”
While this implies that data from Landscape 2012 We started from the global private climate finance
is not directly comparable to Landscape 2011, it numbers and broke them down in distinctive geographi-
provides more detail and sheds light on how global cal and technology subgroups to the extent possible.
finance flows match global financing needs to When we could not categorize any further, we looked
support a low-carbon, climate-resilient transition. at individual projects from a representative sample and
categorized them along three dimensions: category of
actor, geography of origin, first degree – ultimate degree
Global geographical scope ownership.14
The Landscape 2011 focused on climate finance flows We used these dimensions to create a set of weights
from developed to developing countries, and included and applied those weights to the global numbers to
some developing countries and domestic sources, obtain dollar values for different dimensions of the
although to a limited extent and independent of their global figures.
origin (domestic money, money from other develop-
ing countries or from developed countries). To shed Extended coverage of public intermediaries
more light on where we stand compared to global
The Landscape of Climate Finance 2012 covers the follow-
financing needs to stabilize average temperature to
ing Development Finance Institutions (DFIs):15
below 2 degrees, in the Landscape 2012 we extend the
geographical coverage to feature estimates of climate • Four Bilateral Finance Institutions (BFI):
finance flows to and in developed countries (domestic French Development Agency with Proparco
money, and money from other developed countries (AFD), Japan International Cooperation Agency
or developing countries). The figures identified in the (JICA), KfW Entwicklungsbank and DEG, and
Landscape 2012 should therefore not be confused with Overseas Private Investment Corporation
amounts that count towards the USD 100 billion prom- (OPIC);
ised by developed countries in the Copenhagen Accord, • Nine Multilateral Finance Institutions (MFI):
but rather as indications compared to global financing World Bank, International Finance Corporation
needs to meet the two degrees goal. (IFC); EU Institutions16, European Investment
We categorize actors providing climate finance (lenders, Bank (EIB), European Development Bank for
investors, guarantors, etc.) as domestic or foreign enti- Reconstruction and Development (EBRD),
ties and as hailing from developing or developed coun- Asian Development Bank (AsDB), African
tries using the best information available. This extended Development Bank (AfDB), Inter-American
coverage allows us to map both sources and destina- Development Bank (IDB), and Nordic
tions more precisely and to compare financing trends Development Fund (NDF);
in different regions. Domestic finance coverage was
14 In addition to small-scale asset financing, we covered 1,636 individual proj-
improved by investigating the contribution of National ects from the Bloomberg New Energy Finance database representing 82%
Finance Institutions. of the extra capacity in developed countries and 89% of the extra capacity
in developing countries (53.9 GW in total).
More detailed representation of private sector 15 We opted to refer to the broad group of institutions covered in the report
climate finance flows as Development Finance Institutions (DFI) given their development man-
dates, but we acknowledge that the term DFI is here used with a broad
With a more informative categorization of private meaning.
climate finance flows, the Landscape 2012 sheds more 16 The European Commission and EU Development Fund.
15The Landscape of Climate Finance 2012 December 2012
• Nineteen National Finance Institutions: switch project such as fuel to gas and coal to gas, and
Brazilian Development Bank (BNDES), fossil fuel based co-generation). We acknowledge the
Development Bank of Latin America (CAF), uncertainties associated with what qualifies as climate
Nacional Financiera (Nafin), Fideicomisos finance and what does not, and the “immaturity” of
Institudos en Relacion con la Agricultura (Fira), some institutions’ tracking and reporting methodolo-
Agencia Financiera de Desarollo, Development gies, which affects our understanding on the real magni-
Bank of Southern Africa (DBSA), Indian tude and nature of the climate finance delivered by
Renewable Energy Development Agency these institutions.
(IREDA), Banco del Estado de Chile, Central
American Bank for Economic Integration Extended coverage of sectoral uses
(BCIE/CABEI), Bancoldex Colombia, Black
Sea Trade and Development Bank of Greece The Landscape 2011 focused on renewable energy.
(BSTDB), China Development Bank (CDB), While we did our best to capture energy efficiency,
Caisse de Dépôt et de Gestion of Morocco energy smart technologies and infrastructure, industrial
(CDG), Eximbank Indonesia, Croatian Bank processes, transportation, and other sectors, reliable
for Reconstruction and Development (HBOR), data sources in these fields that fit within our frame-
Korea Finance Corporation (KoFC), Industrial work were limited. Some of these missing data sources
Development Bank of Turkey (TSKB), Small are now available at national levels and we therefore
Industries Development Bank of India (SIDBI), managed to include a broader sectoral coverage in the
and Vnesheconombank of Russia (VEB). Landscape 2012.18
These institutions’ climate financing data were retrieved Note that coverage for climate-resilience is even
from a blend of primary and secondary data sources. patchier due to reporting and categorization issues,
Sixteen organizations out of the 32 covered in the report which hamper our understanding of what constitutes
provided their data for mitigation and adaptation activi- adaptation finance.
ties directly, by the means of a financial survey.
Other changes
Acknowledging the challenges in determining what
qualifies as mitigation or adaptation, and to unequivo- The capital boxes in the Landscape 2011 have been
cally attribute specific investments to only one of these recategorized into “market rate project-level debt,”
two themes, mitigation and adaptation were broken “project-level equity”, and “balance-sheet financing” for
down by sectors. The choice of the sectors was guided the Landscape 2012. We also mapped primary carbon
and informed by other methodologies and account- offset flows differently, attributing flows directly to the
ing practices (e.g., OECD/CRS, UNEP-SEI, 2011). In actors involved in the acquisition of primary offsets.
those cases where respondents provided different Apart from these changes, several categories have been
sectoral breakdowns, the project/category description renamed for the Landscape 2012: government budgets
was considered for allocating data against the chosen (previous: domestic public budgets), Development
categories. In the presence of activities with multiple Finance Institutions including bilateral, multilateral,
objectives (both mitigation and adaptation), this amount and national financial institutions (previous: bilateral /
was allocated according to the weights of mitigation multilateral agencies and banks), carbon offset finance
and adaptation on the given total of climate finance17. (previous: carbon offset flows), and low-cost project-
To the extent possible, data were adjusted to exclude level debt (previous: concessional loans).
interventions not in line with our definition of climate
finance (e.g., we carved out financing for R&D, manu-
facturing or lower carbon energy generation projects,
the latter because they may have included fuel-to-fuel
17 For instance, of the USD 9.6 billion ODA marked as climate finance in the
OECD CRS database and not channelled by AFD, JICA or KfW, USD 4.2
billion is marked as mitigation only, USD 3 as adaptation only and USD 2.4
billion as both mitigation and adaptation related. We allocated the dual 18 Note that nuclear was not included in either the Landscape 2011 or in the
purpose money according to the distribution between mitigation only and Landscape 2012, as we could not identify data sources highlighting financ-
adaptation only projects (59% vs. 41%). For DFIs, e.g. in the case of EU ing directed to this type of projects. None of the DFIs surveyed included
Institutions, dual purpose money (USD 264 million) was allocated accord- in their climate finance reporting financing for nuclear projects, nor did
ing to the share of mitigation and adaptation projects (55% vs. 45%). donors in their reporting to the OECD DAC.
16December 2012 The Landscape of Climate Finance 2012
Box 1 – The Landscape 2012 compared to the Landscape 2011
CPI’s Landscape of Climate Finance 2011 represented the first comprehensive review of the global climate finance
landscape. The study focused on climate finance flows from developed to developing countries, with limited
coverage of developing countries and domestic sources.
Due to divergent definitions and data gaps, we faced a number of methodological difficulties, some of which
we were able to account for (e.g. double counting of the same flows), others less so (e.g. differing definitions
and time periods).
Based on this methodology, we estimated total global climate finance flowing to the developing world at on
average USD 97 billion a year in 2009/2010. Appendix B summarizes the Landscape 2011.
When we apply the Landscape 2011 methodology and focus to the Landscape 2012 data to highlight as much
comparability among flows as possible, total climate finance flows predominantly directed towards developing
countries in 2010/2011 is USD 112 billion. The increase is a result of the following main factors:
• a 78% increase in bilateral ODA climate finance flows from developed to developing countries in 2010
compared to 2009, partly reflecting the impact of Fast-Start finance pledges and partly the new OECD
Rio marker to track aid targeting climate change adaptation objectives;
• a 47% increase in financial flows from the Multilateral Finance Institutions considered in the Landscape
2011;
• a more than doubling of carbon offset finance reflecting almost doubled issuance of CERs in 2011
compared to 2010 (although there were lower prices) and improved data visibility on ERU issuance.
An optimist might suggest that USD 112 billion in climate finance overachieves the USD 100 billion promised
by developed countries in the Copenhagen Accord. Yet, we have to recognize that this might not be correct for
multiple reasons, mostly related to our scope. We aim to provide a comprehensive overview of all the current
financial resources for climate change action. Consequently, not all of the USD 112 billion counts as additional
climate finance from what was available prior to the Copenhagen Accord. The reality is that while climate
finance has increased quickly over the past 10 years, a significant share of the USD 112 billion provided in
2010/2011 was already committed prior to the Accord. Further, like in the Landscape 2012, the USD 112 billion
total includes some developing countries and domestic sources, although to a limited extent, and considers
both incremental cost and investment capital.
In other words, our climate finance estimates cannot, and should not be compared with the USD 100 billion
of the Copenhagen Accord. The methodologies used in both the Landscape 2011 and Landscape 2012 are not
intended to imply which (or which proportion) of these contributions to climate finance should count toward
the goal to mobilize USD 100 billion per year by 2020 to assist developing countries’ climate responses.
Nothing in this report is meant to infer that this goal has already been achieved.
17The Landscape of Climate Finance 2012 December 2012
3 The Current Landscape of These various sources have multiple connections to
each other. There is also a strong interrelation between
Climate Finance Flows public and private sources of finance.
In this section, we describe how climate finance breaks Not captured in these figures are governments’ direct
down along the lifecycle of financial flows from sources and indirect shareholdings and lending to private invest-
to end uses. For each stage of global climate finance, ment structures as well as private contributions to
we aim to highlight the key reasons and motivations International Financial Institutions (public contributions
for finance flows, ranges of finance involved, where the to Development Finance Institutions are captured only
money is coming from (geographies, specific actors, to a limited extent).
etc.), where it is going (geographies, specific actors,
In the Landscape 2012, we have highlighted the contribu-
technologies, etc.) and any issues specific to each life-
tion of several categories of private stakeholders acting
cycle stage.
in the global landscape of climate finance, namely
corporate actors, project developers, households, and
3.1 Sources and intermediaries institutional investors.19 The contribution of public and
private intermediaries (USD 110 – 120 billion) is dis-
The sum of climate finance flows from all sources cussed in section 3.2.
totals USD 343-385 billion. The dominant source
is the private sector, which provides as much as Carbon-related mechanisms
USD 250-286 billion in climate finance, or 74%
of total climate finance (out of USD 364 billion Carbon-related mechanisms are comprised of (1)
on average). Of private actors, project developers carbon market revenues and (2) all climate-related
provide USD 122 billion, or 34% of total climate taxes raised by governments (ranging from explicit and
finance, while other corporate actors provide implicit carbon taxes). Money collected from carbon
USD 75 billion, or 21% of total climate finance. markets and carbon-related taxes flows to government
Contributions from government budgets ranged budgets, though it is not clear how much is earmarked
between USD 16 and 23 billion including direct
public investments and north-south aid flows. 19 Potential future sources of climate finance discussed in international
Development Finance Institutions along with forums are not mapped in the Landscape. These include revenues from
Climate Funds provided USD 77 billion. taxation of international aviation and shipping emissions, revenues gener-
ated by removing fossil fuel subsidies, revenues generated by fossil fuel
extraction royalties/licenses, revenues from a financial transaction tax
Current sources of climate finance include: (FTT) or allocation of Special Drawing Rights, etc.
ANNUAL FLOWS OF DIRECT CLIMATE FINANCE
SOURCES & INTERMEDIARIES (*)
(2010 / 2011, USD BILLION)
Government budgets (5%) 16.0 - 22.6
Development Finance Institutions* (21%) 76.8
PUBLIC
• Climate Funds* (You can also read