Combined Solar Power & Desalination Plants for the Mediterranean Region - Deutsches Zentrum für Luft- und Raumfahrt e.V. Institute of Technical ...
←
→
Page content transcription
If your browser does not render page correctly, please read the page content below
Combined Solar Power & Desalination
Plants for the Mediterranean Region

Deutsches Zentrum für Luft- und Raumfahrt e.V.
Institute of Technical Thermodynamics
Stuttgart, Germany

Franz Trieb
• Principles of Solar Thermal Power Stations
• Applications of Solar Thermal Power Stations
• Solar Power & Desalination Performance Estimate
• Resource Assessment
• Perspectives for Euro-Mediterranean Co-Operation
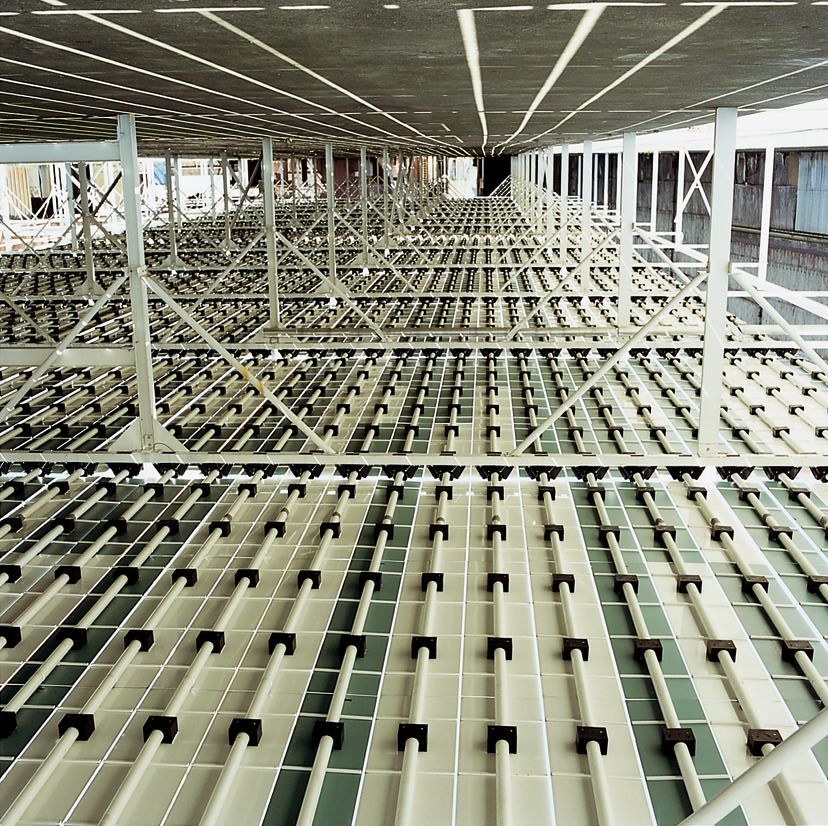
Photo: KJC
Photo: KJC
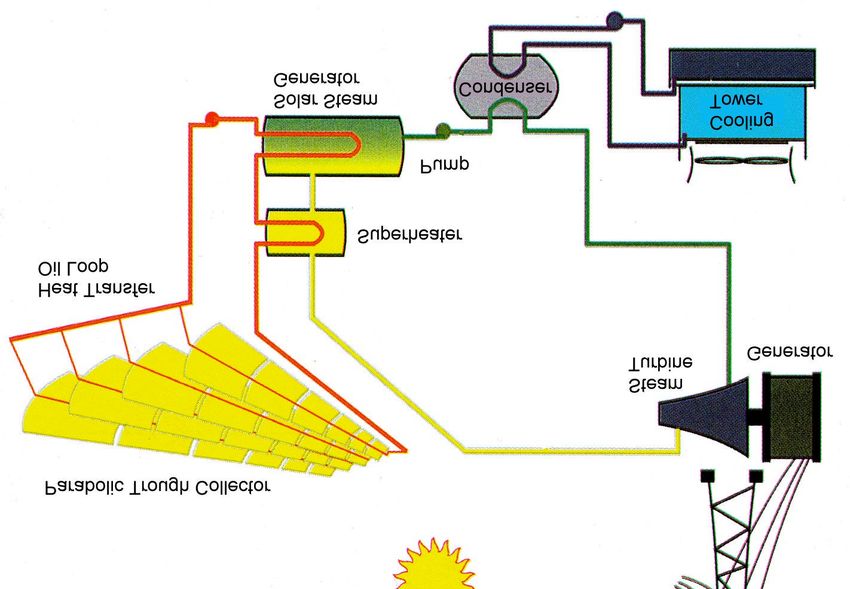
Oil (5 bar, 380 °C)
Steam (100 bar, 500 °C)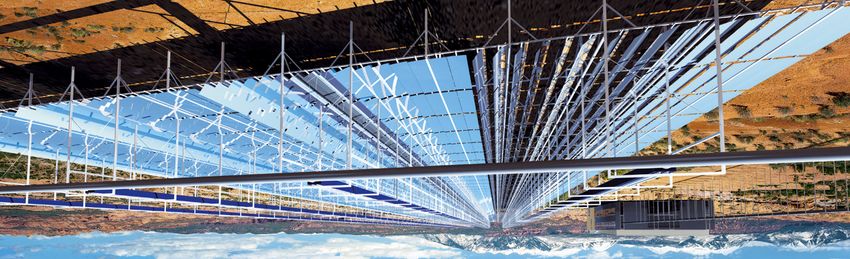
Photo: DLR

Photo: DLR

Pressurized Air (15 bar, 1200 °C)
Animation: FhG-ISE
Sunlight
Secondary
Reflector
Fresnel Reflector
Absorber Tube
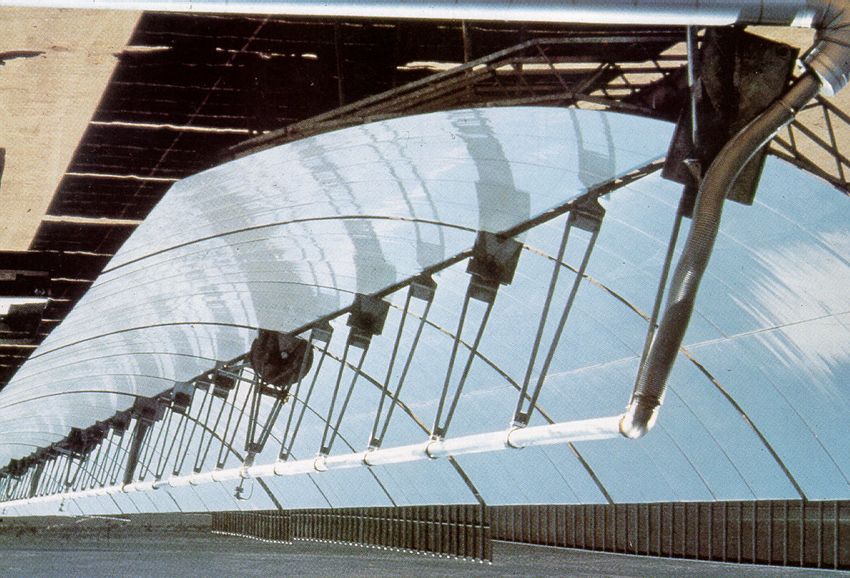
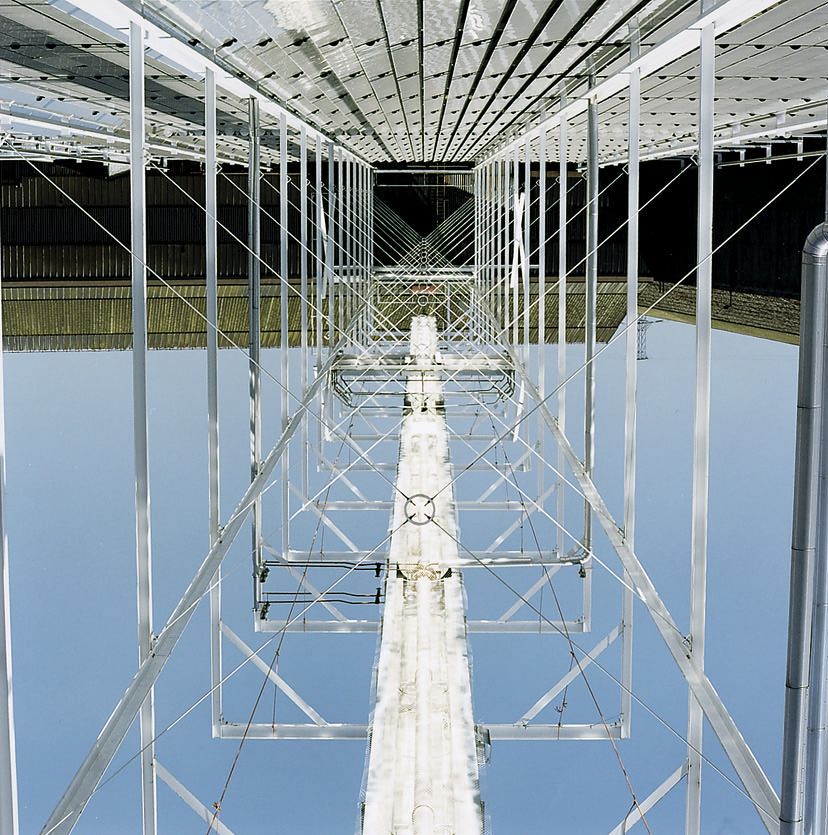
Photo: Solarmundo
Steam (100 bar, 550 °C) Fresnel System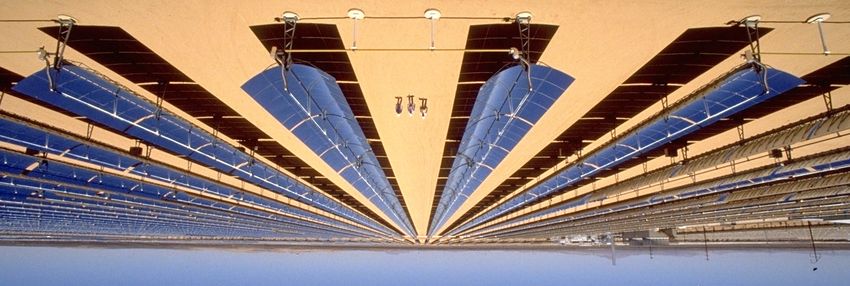
Applications

Power Generation by Steam Turbines with
Parabolic Trough or Fresnel System
Applications
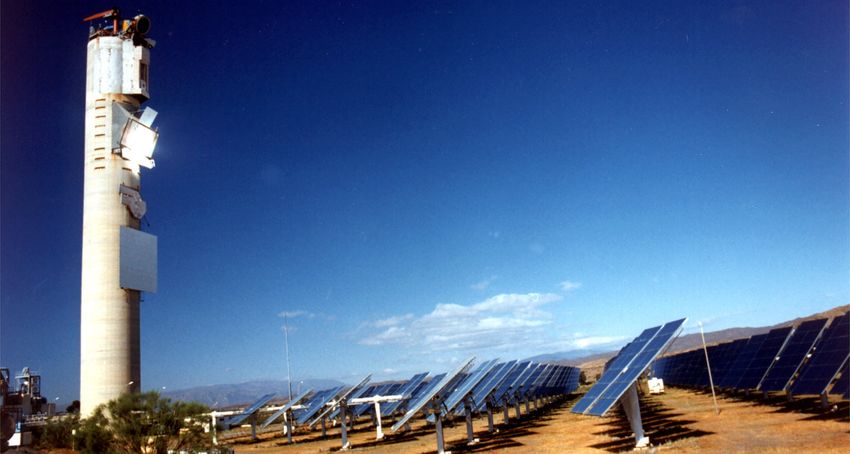
Solar Receiver Combined
unit Cycle Plant
Heliostat
Field
Gas
Turbine Steam Cycle
Power Generation by Gas Turbines or
Combined Cycles with Power Tower System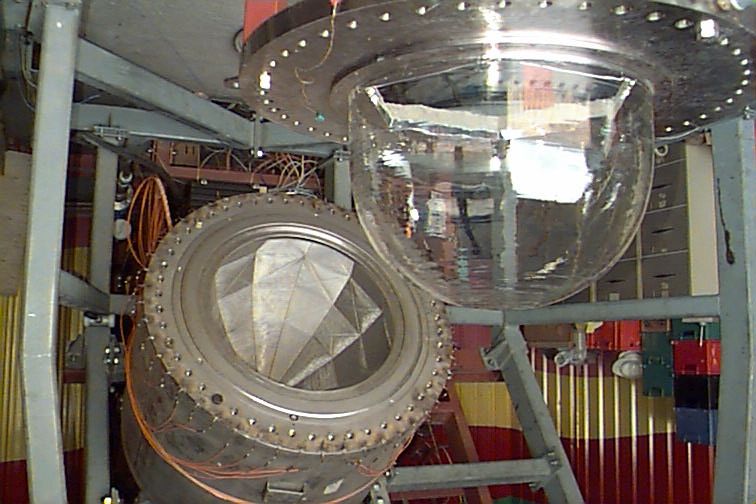
Applications

                                   View from underneath the
                                   Solarmundo Collector

                                   • Parking
                                   • Greenhouse
                                   • Market
                                   • Exhibitions
                                   • etc.

Shaded Space below the Collector Field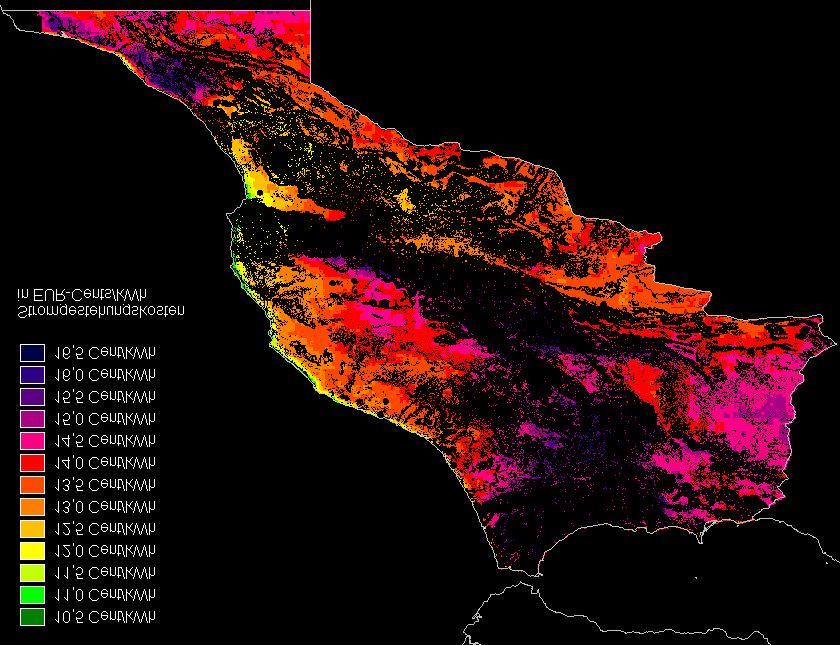
Applications

          Concentrating         Thermal
          Solar Collector       Energy
               Field            Storage
  Fuel
                     Heat
                                         Electricity
    Thermal Power
     Cycle for Co-
                           Thermal
      Generation                                Desalted
                          Desalination
                     Heat                       Water
                             Plant

Combined Power and Water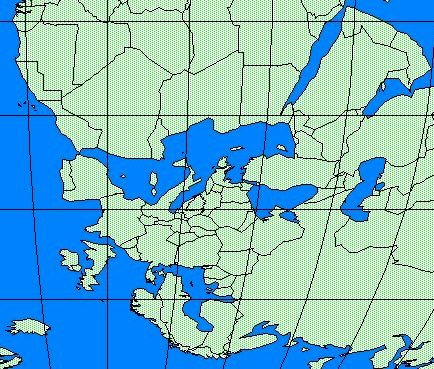
Solar Power & Desalination Performance (Parabolic Trough)

                            Power Line
                                            Freshwater-
                    Trees                   Pipeline

                       Solar Field
                                            Power Block &
           3 km

                                            Desalination Plant
                                                   Saltwater-Pipeline

                                          Salt

 Net Power: 200 MW              Water: 40 MIGD             Investment: 795 M€
 Electricity .......... 1500 Million kWh per year ....... 3.5 - 4.5 cents/kWh
 Water ................ 60 Million m³ per year .............. 0.80 - 1.50 €/m³
 By-Products ...... Wood, Agriculture, Shaded Space, Salt
Solar Radiation Intensity Land Properties Land Use
+ +
Infrastructure Natural Risks Performance Model
+ + +
Solar Electricity Cost
Economic Database
Land 3
Land 2
Morocco
Länderdatensatz für Marokko
Parameterbezeichnung Symbol Wert E in h e i t LA K S Quelle Kommentar
Kostenfaktorübergreifende Modellfaktoren
Währungsu m rechnungsfaktor rW 0,10220 EUR/DH L - - O ANDA 2001 Kassa-Wechselkurs von DH in
EUR, Durchschnitt vom 1.7.2000
bis 30.6.2001
Z i n s f u ß d e r E i g e n k a p i t a l v e r z i ns u n g ie 16,0 % (R) - - K I S T N E R und P R I C E 1 9 9 8 ; j ä h r l i c h e r R ea l z i n s s a t z
u.a.
P r e i s s t e i g e r u n g s r a t e L o h n , n a t i on a l e L, nat 0 % L - - - jährliche Rate
+
Preissteigerungsrate Material, na tional e M, nat 0 % L - - - jährliche Rate
Nach Kostenfaktoren geordnet
he
s p e zi f i s c h e
k
k
G
Pl
0 Mio. DH/qm
16,0 (D) Mio. DH/km
2,5 (V)
0 (T)
(R)
L
-
x
-
x
MINISTERIUM F . K ULTUR U . bezogen auf den Quadratmeter
K O M M U N I K A T I O N,
MAROKKO 2001;
FLACHGLAS 1994, 8-8; u . a .
Grundfläche
BR Ö S A M L E 2 0 0 0 , S . 1 0 6 entspr. 1,64 Mio. EUR/km (D)
0,26 Mio. EUR/km (V)
0 Mio. EUR/km (T)
=
Werte am ursprünglichen
B e zugsjahr:
entspr. 16,0 Mio. EUR/km (D)
2,5 Mio. EUR/km (V)
0 Mio. EUR/km (T)
che k St 1,05 Mio. DH/km L - (x) FLACHGLAS 1994 entspr. 107.400 EUR/km
sche k Nz 0,35 Mio. DH/km L - x FLACHGLAS 1994 entspr. 35.800 EUR/km
d I, nat 0 % (R) - x - vorläufiger Wert
en, national d I, L, nat 11 % L (x) (x) begründete Schätzung
o s t e n , n a t io n a l d I, M, nat 79 % L (x) (x) begründete Schätzung
n a tio n a l k Sf, nat 1104 DH/qm L - x nach T RIEB 2 0 0 1 b b e z o g e n a u f d i e A p e rt u r f l ä c h e ;
entspr. ca. 113 EUR/qm;
inte r n a t i o n a l k Sf, int 137 EUR/qm L - x nach T RIEB 2 0 0 1 b ;
FLACHGLAS 1994 Tab. 9-5
STEPS
teil d Sf, n a t 15,5 % L - - FLACHGLAS 1994 Tab. 9-5
nal K Kw, nat 38,0 Mio. DH L (x) x TRIEB 2 0 0 1 b ; FLACHGLAS entspr. 3,88 Mio. EUR und damit
1994 Tab. 9-5 11,3 % der gesamten
Kraftwerkblockkosten
n a tio n a l K Kw, int 30,4 Mio. EUR L (x) x TRIEB 2 0 0 1 b ; FLACHGLASPerspectives
EURO MED Synergetic Effects of a
Euro-Mediterranen Co-
Technological Resources
operation for the Use of
Renewable Energy
Solar Energy Resource
Sources
Financial Resources
Land Resources
Demand for Electricity
Demand for Desalination
Potential Synergetic Potential (qualitative comparison)
in Europe Potential in MEDVision of a Euro-Mediterranean Interconnected Grid
with High Renewable Energy Share
Solar
Wind
Hydro
Geothermal
EURO-MED
possible
further inter-
connections60
50
40
Power GW
30
20
10
0
25.6. 26.6. 27.6. 28.6. 29.6. 30.6. 1.7.
Date
CHP (fossil) Wind, PV Geo, Hydro, Bio Import Solar
Import Hydro, Geo Pump Storage Peak Power (fossil) Surplus Power
Electricity Mix from Renewable Energy Sources,
Cogeneration and Conventional Peak Power Plants
in a German Electricity Scenario for the Year 2050Solar Electricity Cost Estimate until 2030
12 solar share
Electricity Cost in 2000 h/a 6000 h/a
Euro-cents/kWh 10
8 Medium Load
Base Load
6 Import Europe
4
2
2000 2010 2020 2030
Year
Parameters: Parabolic Trough Technology, 200 MW Plant Units, No Subsidies nor other
Financial Support, Discount Rate 10 %/y, Economic Life 25 years, Solar Irradiation 2350
TWh/km²year, Cost of Desalted Water 1.30 €/m³. High Voltage Direct Current Transmission
to Europe: Distance 3.500 km, Transmitted Power 2.000 MW (solar only), Maximum Losses
at Full Load 15 %, Investment 1.4 Billion €More Infos and web-links at http://www.dlr.de/sokrates
You can also read