14 St Helens Creek CATCHMENT MANAGEMENT AREA REPORT - Reef Catchments
←
→
Page content transcription
If your browser does not render page correctly, please read the page content below
WATER QUALITY IMPROVEMENT PLAN 2014 - 2021

CATCHMENT MANAGEMENT AREA REPORT

        14 St Helens Creek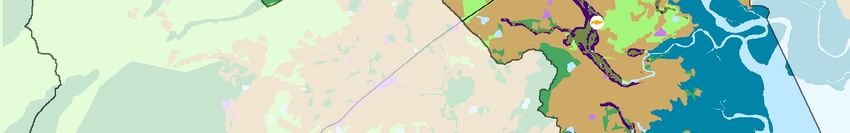
ST HELENS
YALBOROO BEACH
! !
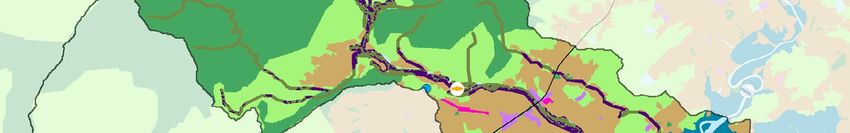
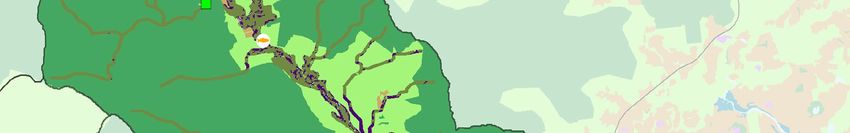
St Helens Creek: MAP 1
SUBCATCHMENT LANDUSE
Blackrock Creek
E EK
R CR
WY E
SA
CALEN
!
!
KOLIJO K
EE
C R E EK CR
L E NS IL E
IN T HE EM
SA ON
O'Connell
St Helens Creek
River
MOUNT OSSA
!
Murray Creek
Key to land use
National park or reserve
Grazing or forestry
Crop land (cane and horticulture)
Intensive use (rural residential, transport corridors)
Urban
Dam or reservoir
Wetland
Town Sugar mill
Highway Fish monitoring site
Catchment boundary WQ monitoring site
Aquaculture WQ baseline monitoring site
Weir/dam Riparian Vegetation
Sewage treatment plant Inadequate riparian vegetation Pioneer River
FINCH HATTON
Drinking water Riparian vegetation Main Channel
!
Boat ramp PINNACLE
Data:
!
0 1 2 3 4 State of Queensland (Department of
Science, Information Technology,
Kilometres Innovation and the Arts) 2014
!
MIRANI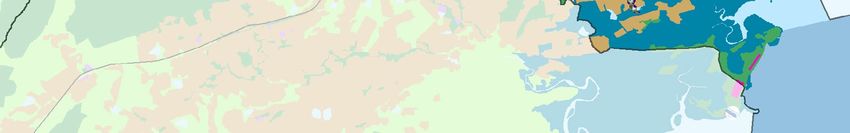
WATER QUALITY IMPROVEMENT PLAN 2014 - 2021

     CATCHMENT MANAGEMENT AREA REPORT

                              14 St Helens Creek

                                  [ St Helens Creek Ecosystem Health Rating
                                     Very Good        Good        Moderate       Poor       Very Poo r

                                                              VG

                                                                      G                           The St Helens Creek
         [ FRESHWATER
         Ecosystem Health
                                                                      M
                                                                                        M
                                                                                             [    freshwater ecosystem
                                                                                                  received an overall score of
                                                                                                  Moderate.
                                                 VP           P

                                                                                              [
                                                                                                         St Helens Creek flows from the
                                                                                                         forested highlands of Eungella National
                     [ Total Area by Landuse                                                             Park in the Clarke Range west of the
                                                                                                         township of Calen before entering
                      Urban and                   Horticulture
                                                  and Cropping                                           the coastal plain and joining the
                      Intensive Uses
                                                       9 ha                                              estuary of Murray Creek at St Helens
                          91 ha
                                                                                                         Bay. While the upper catchment
                                                                             Sugarcane                   is protected by National Park and
                                                                             Production
                                                                                                         reserves, the lowland areas have been
                      !                                                       2707 ha                    extensively cleared for grazing and
    Wetlands and                                                                                         cane production, especially along the
    Waterways                                                                                            creek flats.
     2525 ha
                                                                                                         Grazing and cane management
                                                                                                         practices that reduce nitrogen loads
                                                                                                         are the highest priority for continued
                                                                                                         improvement of event water quality.
                                                                                                         Management practices that reduce
                                                                                                         other nutrients and residual herbicides
                                                                                                         are a moderate priority.
    National Parks                                                                                       System repair actions for instream
    and Reserves
                                                                                Grazing and
                                                                                                         habitat and riparian vegetation
      9724 ha
                                                                                Forestry                 restoration and connectivity are of
                                                                                  3508 ha
                                                                                                         the highest priority to enable fish
                                                                                                         communities to gain the maximum
                                                                                                         benefits from the improvement in
                Total hectares St Helens Creek                                                           water quality.
                  18564 ha
                                           !

!
[
                   Ecosystem HEALTH

                   Table 1
                              [    Subcatchment Freshwater Ecosystem Health Indicator Score:
                                   Current Condition 2014 and Target 2021

                              Fish Community         Event Water       Ambient                                 Riparian              Barriers to
                                   Health              Quality        Water Quality         Flow              Vegetation             Migration

                                  Current Target     Current Target   Current Target     Current Target      Current Target        Current Target
                                  2014 2021           2014 2021           2014 2021      2014 2021            2014 2021             2014 2021

 [ St Helens Creek                 G        G         M        G          M          G     P        P          M        M            M       G

                                                                      Very Good          Good           Moderate        Poor           Very Poo r

       Table 1: OVERVIEW

  This index presents the indicators chosen to assess the condition of freshwater ecosystem health. The index uses a
  combination of monitored data and expert opinion to provide a score for the current condition of fish community health,
  event water quality, ambient water quality, flow, riparian vegetation, and barriers to migration for each of the region’s 33
  catchment management areas. The table also presents the target for each indicator to be reached by 2021.

                   Table 2
                              [    Event Freshwater Quality: Current Condition, Targets and Objectives

              Key Pollutant                     Current Condition         Target 2021      Objective 2050              Action              Pollutant Source

                                                            ST HELENS CREEK SUBCATCHMENT

Dissolved Inorganic Nitrogen μg/L                     302                     267                267                    HIGH                        CIU

Particulate Nitrogen μg/L                             121                     121                121                    LOW                         CIUG

Filterable Reactive Phosphorus μg/L                    26                     23                   23                   HIGH                        CIU

Particulate Phosphorus μg/L                            33                     33                   33                   LOW                         CIUG

Total Suspended Sediment mg/L                          45                     45                   45                   LOW                         CIUG

Ametryn μg/L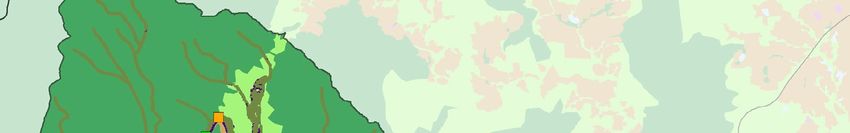
Table 3
            [ Action Targets: Ecosystem Health Management
                 L = Low, M = Moderate, H = High

                                       Condition        Planned
                                                        Activities to         Effort           $ Cost
                                         2014           2021

                                       St Helens Creek

                                                                                                                              Table 3: OVERVIEW
                Barriers                    3                 1                 L           $20,000
                                                                                                                   This table presents the on-
            (number)
                                                                                                                   ground management actions
Riparian Vegetation                                                                                                determined to be required to
       Management                      1384 ha             21 ha                H          $260,000                improve ecosystem health,
            (hectares)                                                                                             including the removal of
                                                                                                                   barriers to fish migration,
          Bank and                                                                                                 establishment of riparian
   bed stabilisation                     n/a                  9                 H          $ 919,000               vegetation, bank stabilisation,
        (kilometres)
                                                                                                                   and in-stream habitat works.
                                                                                                                   The table displays the current
  In-stream Habitat                                                                                                condition for each component,
             Works                      n/a                   3                 H          $46,000                 as well as the planned activities
            (number)
                                                                                                                   to be completed by 2021, the
                                                                                                                   level of effort required and
                                                                              Total Cost = $1,245,000              associated costs.

                                                                                                                             Tables 4: OVERVIEW

                                                         The tables below display the current level of management practices for
                                                         Sugarcane/Horticulture, Grazing, and Urban within D, C, B and A Management
                                                         Framework classifications at 2014. The table also presents the level of voluntary
                                                         adoption of management practices required to meet 2021 objectives and their
                                                                                                                         associated costs.

  Table 4
            [    Agriculture ABCD Adoption Targets

                                                   2014 Adoption %                                      2021 Adoption %                       Total Cost
                Land Use
                                                                                                                                               $ ‘000s
                                        D           C              B            A          D             C            B             A

                                                        ST HELENS CREEK SUBCATCHMENT

                             Soil           15%         24%             37%         24%        10%           15%           45%          30%       5
    Cane &
                           Nutrient         20%         22%             49%         9%         10%           15%           65%          10%     174
   Horticulture
                           Herbicide        20%         23%             43%         14%        15%           20%           50%          15%      81

     Grazing                 Soil           25%         37%             33%         5%         25%           35%           35%          5%       13

                                                           D Dated practice      C Common practice       B Best practice     A Cutting-edge practice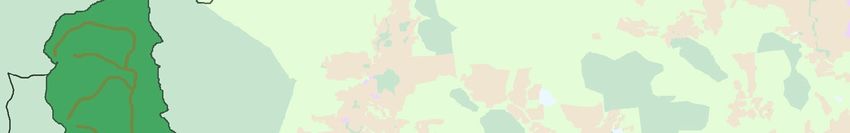
You can also read