Supplementary Materials: Blood Glucose Level Regression for Smartphone PPG Signals Using Machine Learning - MDPI

Page created by Lee Barrett
 
CONTINUE READING
Supplementary Materials: Blood Glucose Level Regression for Smartphone PPG Signals Using Machine Learning - MDPI
Supplementary Materials: Blood Glucose Level Regression for
Smartphone PPG Signals Using Machine Learning
Tanvir Tazul Islam, Md Sajid Ahmed, Md Hassanuzzaman, Syed Athar Bin Amir and Tanzilur Rahman *

                                           An overview of the experimental details is provided in Figure S1. Video data from
                                     five different subjects (aged between 22 to 35) using three different smartphones has been
                                     collected to observe the variations in acquired signal caused by the subjects and quality of
                                     data acquisition system (phone + camera). Three trials from each subject were collected –
                                     giving a total of 45 trials to test the proposed model responsible for data preprocessing
                                     and feature analysis. All the trials after converting into their respective PPG signals have
                                     gone through same preprocessing and feature analysis techniques irrespective of the sub-
                                     ject and phone camera type used in acquisition.

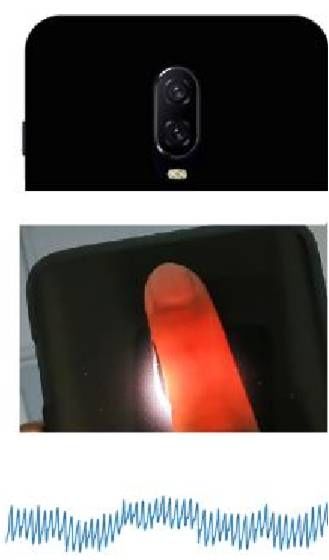
                                     Figure S1. (Left) Proposed Model Flow Diagram and (Right) Data Acquisition procedure using
                                     smartphone camera.

                                          The following Figures shows the complete preprocessing method from video to PPG
                                     conversion, then baseline correction step, smoothing step and automatic detection of
                                     peaks from the signal. The peaks function takes a one-dimensional array and finds all the
                                     local maxima by simple comparison of neighboring values in the PPG signal.

Appl. Sci. 2021, 11, 618. https://doi.org/10.3390/app11020618                                          www.mdpi.com/journal/applsci
Supplementary Materials: Blood Glucose Level Regression for Smartphone PPG Signals Using Machine Learning - MDPI
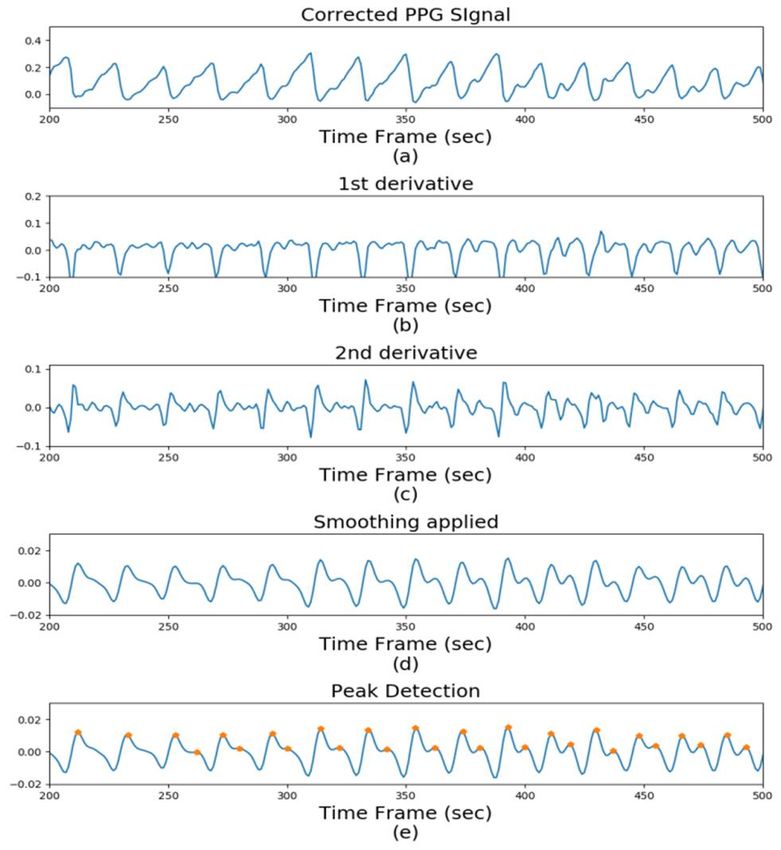
Appl. Sci. 2021, 11, 618                                                                                                         2 of 5

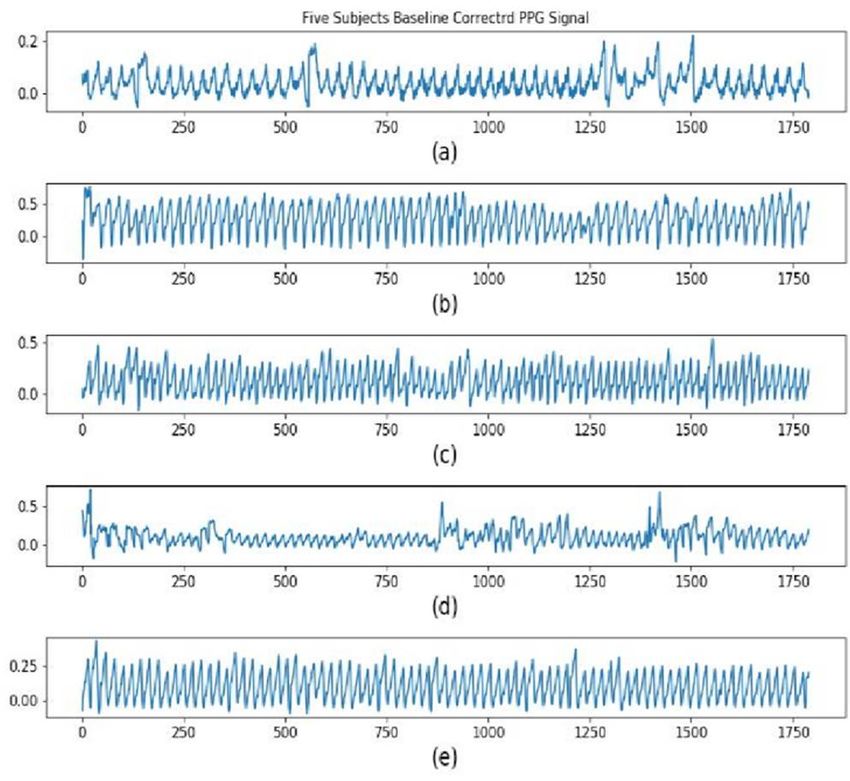
      Figure S2. (Left) Corrected baseline PPG Signal of 5 Different Subjects from SP3 (a) Sub-1 (b) Sub-2 (c) Sub-3 (d) Sub-4 (e)
      Sub-5. (Right) Complete Procedure from Raw PPG Signal to Feature Extraction; (a) Raw PPG (b) Corrected Baseline ALS
      and Savitzky-Golay filter (c) Gaussian Smoothing Applied (d) Feature Analysis (Peak-Detection).

                                  Figure S3. Feature analysis (Peak-Detection) (a) SP1 Signal Peaks (b) SP2 Signal Peaks (c) SP3 Sig-
                                  nal Peaks.

                                  Figure S4. Extracting Features(peak-detection) after being preprocessed with 1st and 2nd order
                                  derivatives.

                                        We used the baseline corrected and smoothed signal for detecting peaks. Optionally,
                                  a subset of these peaks can be selected by specifying conditions for a peak’s properties.
                                  The PPG signals were further analyzed through 1st and 2nd derivative feature extraction
                                  which proved to be key in highly accurate glucose level estimation in our previous work
                                  [1]. Figure S4 shows the peak analysis done on 1st and 2nd derivative signal of SP3. From
                                  Table S1, it can be seen the model is able to detect the 2nd derivative peak with very few
                                  misses and false positives across all the subjects.
Supplementary Materials: Blood Glucose Level Regression for Smartphone PPG Signals Using Machine Learning - MDPI
Appl. Sci. 2021, 11, 618                                                                                               3 of 5

                           Table S1. 2nd Derivative Features Extracted from PPG signals acquired (One Plus 6T).

                                                             2nd Deriva-
                                                                 tive             TP
                              Subjects          Trials                                           Miss             FP
                                                              Detected
                                                                Peaks
                                                 1st        156 out of 157       156               1               0
                              Subject 1          2nd        161 out of 161       161               0               0
                                                 3rd        160 out of 162       160               2               0
                                                 1st        160 out of 162       160               2               0
                              Subject 2          2nd        162 out of 162       162               0               0
                                                 3rd        164 out of 165       164               1               0
                                                 1st        175 out of 178       175               3               0
                              Subject 3          2nd        179 out of 179       179               0               0
                                                 3rd        188 out of 190       188               2               0
                                                 1st        144 out of 146       144               2               0
                              Subject 4          2nd        136 out of 138       136               2               0
                                                 3rd        151 out of 153       151               2               0
                                                 1st        165 out of 167       165               3               1
                              Subject 5          2nd        164 out of 168       164               4               2
                                                 3rd        165 out of 166       165               1               0

                           Figure S5. (Top Left) Intentional finger movement at 20, 30 and 40 seconds, (Top Right) PPG sig-
                           nalacquired while flash on, (Bottom Left) PPG signal acquired whilethe flash is off, (Bottom
                           Right) PPG signal acquired and extracted from Red Channel.
Supplementary Materials: Blood Glucose Level Regression for Smartphone PPG Signals Using Machine Learning - MDPI
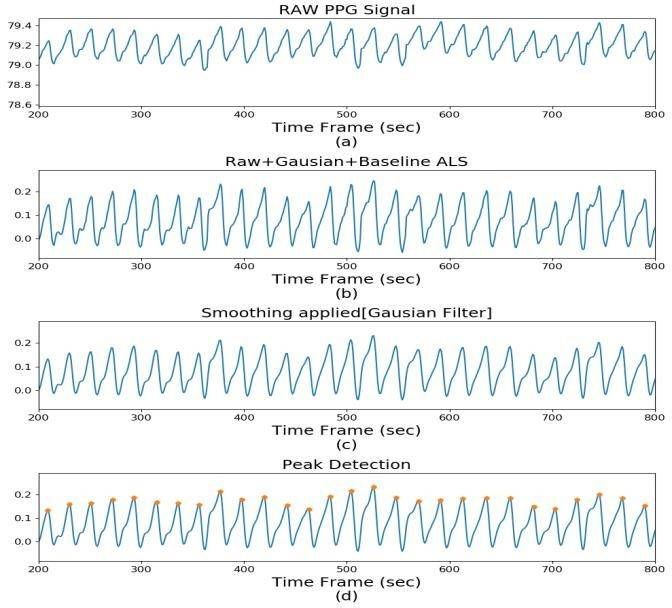
Appl. Sci. 2021, 11, 618                                                                                               4 of 5

                           Figure S6. (a) A sample Raw PPG signal with high-frequency noises and (b) its filtered version
                           through Gaussian Filter, baseline issues are still evident.

                           Figure S7. (a) A sample Raw PPG signal with high baseline variations and (b) its ALS corrected
                           version no baseline problems, high frequency noises are still evident.

                           Cross Validation (CV) Experiment
                                We performed K-Fold cross validation experiments on all the models presented in
                           the manuscript. Statistical approaches i.e., PCR and PLS models were built with different
                           feature sets for 5-fold and 10-fold cross validations. The lowest SEP among the different
                           PCR models was recorded with 35.30 mg/dL and 32.99 mg/dL for 5-fold and 10-fold CVs
                           respectively. In both cases (K = 5, 10) the minimum SEPs were found for PCR model built
                           with DelT features. As for PLS models, the lowest SEPs were recorded as 34.33 mg/dL and
                           33.82 mg/dL for 5-fold and 10-fold CVs respectively. The detail results are provided in
                           Table S2.

                           Table S2. K-Fold CV of different approaches for PCR and PLS.

                                                                         PCR                              PLS
Supplementary Materials: Blood Glucose Level Regression for Smartphone PPG Signals Using Machine Learning - MDPI
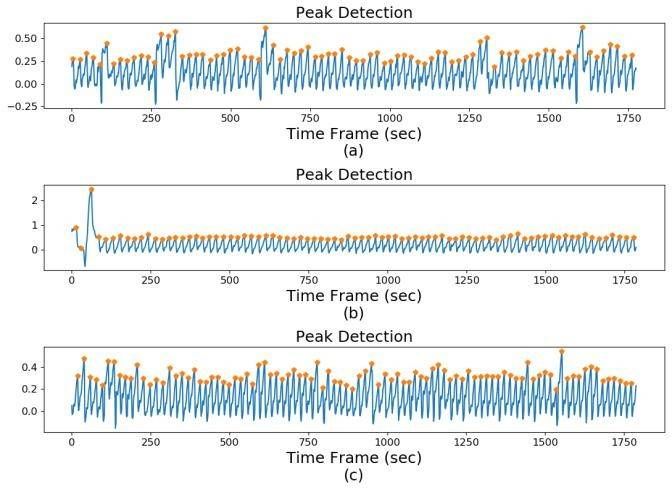
Appl. Sci. 2021, 11, 618                                                                                                5 of 5

                                  Features                        5-Fold            10-Fold       5-Fold        10-Fold
                                                SEP (mg/dL)        33.30             32.99         34.33         34.18
                                    DelT
                                                 No. of PC           3                  7            2             2
                                                SEP (mg/dL)        34.22             34.27         37.86         36.96
                               1st Derivative
                                                 No. of PC           7                 10            2             2
                               1st Derivative SEP (mg/dL)          35.36             33.91         35.80         34.87
                               Characteristics
                                                 No. of PC         2             2               2            2
                                    Points
                                2nd Deriva- SEP (mg/dL)          34.43         33.69           39.49        38.88
                                     tive        No. of PC         12           14               2            2
                                2nd Deriva- SEP (mg/dL)          33.99         33.45           34.38        33.82
                                tive Charac-
                                                 No. of PC         15           12               2            2
                               teristics Points
                                    Similar experiments were also performed on the Machine Learning Models (SVR and
                               RF). With SVR models optimized by tuning the epsilon value, we achieved lowest SEP of
                               28.99 mg/dL for the model trained with 1st Derivative features. As for RFR models opti-
                               mized through tuning the number of trees, we achieved lowest SEP of 28.5 mg/dL Results
                               are detailed in the in Table S3.

                               Table S3. K-Fold CV of different approaches for SVR and RFR.

                                                                  SVR                                  RFR
                                    Features           5-Fold              10-Fold            5-Fold          10-Fold
                                 1st Derivative         28.99               29.01              28.56           28.56
                                 2nd Derivative         39.76               39.61              36.47            36.6
                                 2nd Derivative
                                 Characteristics        39.76               39.61             38.17             37.93
                                     Points

Reference
1.    Chowdhury, T.T.; Mishma, T.; Osman, S.; Rahman, T. Estimation of blood glucose level of type-2 diabetes patients using
      smartphone video through PCA-DA. Proceedings of the 6th International Conference on Networking, Systems and Security—
      NSysS ’19, Dhaka, Bangladesh, 17–19 December 2019, 104–108, doi: 10.1145/3362966.3362983.
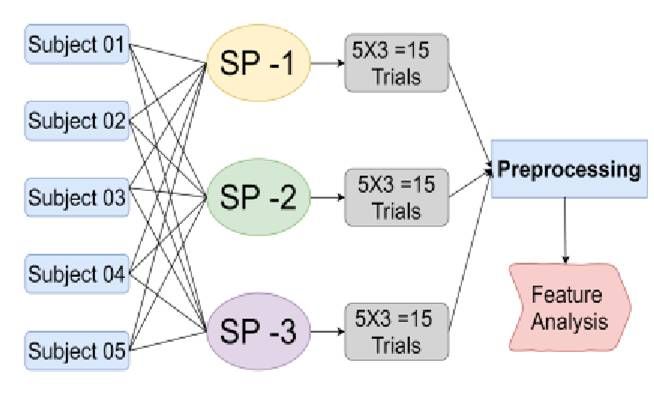
Supplementary Materials: Blood Glucose Level Regression for Smartphone PPG Signals Using Machine Learning - MDPI Supplementary Materials: Blood Glucose Level Regression for Smartphone PPG Signals Using Machine Learning - MDPI Supplementary Materials: Blood Glucose Level Regression for Smartphone PPG Signals Using Machine Learning - MDPI Supplementary Materials: Blood Glucose Level Regression for Smartphone PPG Signals Using Machine Learning - MDPI
You can also read