Company overview and latest results - Tallinn 15.08.2019 - Tallinna Sadam
←
→
Page content transcription
If your browser does not render page correctly, please read the page content below
Company overview
and latest results

Tallinn 15.08.2019
How we operate

Limited liability company, 67% state-owned

Listed in Nasdaq Tallinn SE from 13.06.2018

As a landlord port, we own:
•   Infrastructure in our 4 harbours:
     o land, quays and sea approaches;
     o superstructure provided by indipendent operators.

•   5 ferries and a multi-functional ice-breaker,
    which we also operate

•    Land for real estate development
    in the Tallinn Old City Harbour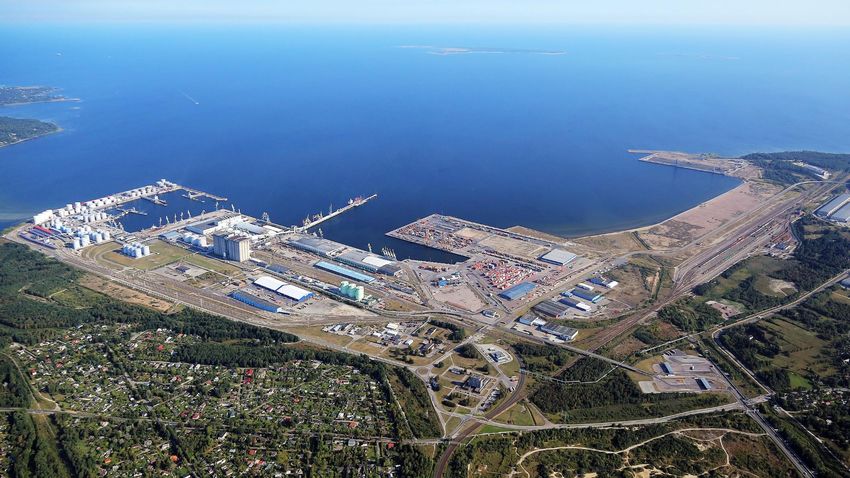
Group companies

                               AS Tallinna Sadam
                            Port services for passengers
                                     and cargo

    OÜ TS Laevad                OÜ TS Shipping
         100%
                                                           AS Green Marine
                                       100%                      51%
Ferry service to Saaremaa
                            Icebreaker Botnica charter     Waste management
       and Hiiumaa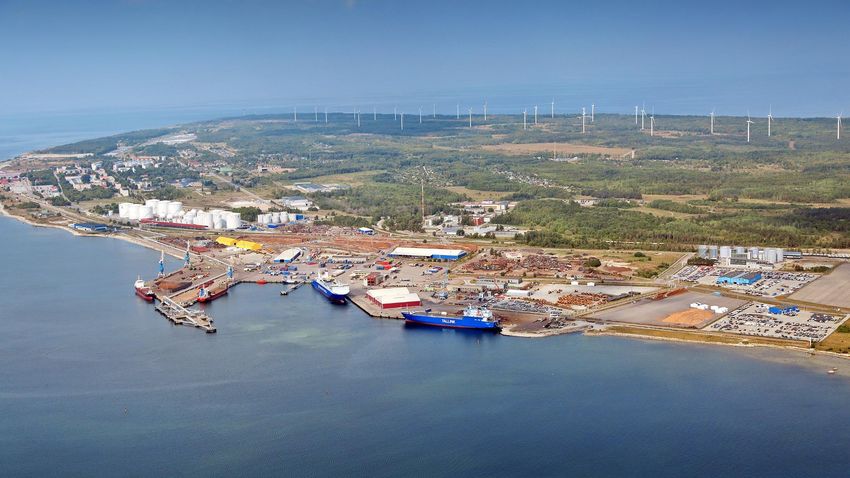
Ice-breaker
Where we operate                  Botnica
FROM HARBOURS                                   Tallinn
TO VESSEL OPERATIONS                                                 Muuga Harbour

                                                                     Old City Harbour
                                                                     Old City Marina

                                                           PaldiskiSouth Harbour
                                                  Ferry transfer to islands

                       Saaremaa
                       Harbour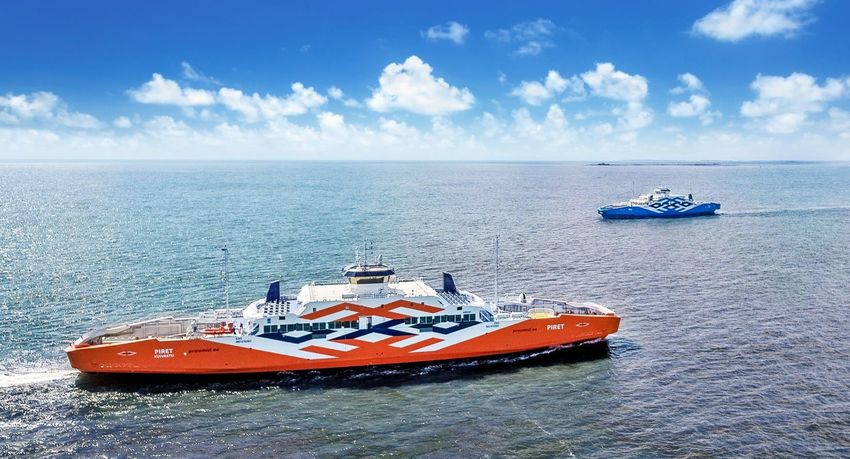
MUUGA HARBOUR                                                            TERRITORY
                                                                         AQUATORY
                                                                                      567 ha
                                                                                      682 ha
                                                            TOTAL LENGTH OF BERTHS    6,4 km
Estonia’s Biggest Cargo Harbour                                  NUMBER OF BERTHS     29
                                                                       MAX. DEPTH     18 m
                                                            MAX. LENGTH OF A VESSEL   300+ m

Containers, liquid bulk, solid bulk, general cargo, Ro-Ro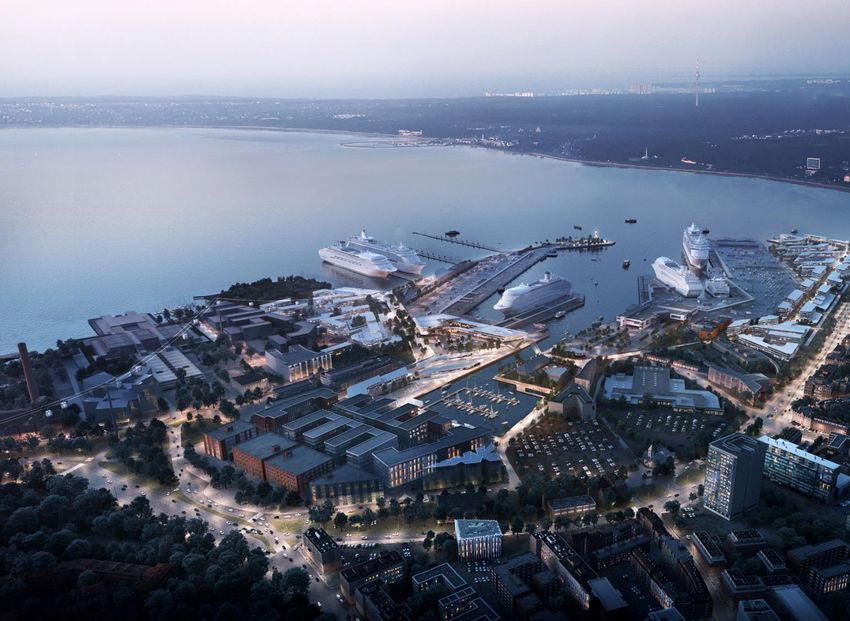
PALDISKI SOUTH HARBOUR                           Ro-Ro, general cargo,
                                                 solid bulk, liquid bulk
Port of Tallinn’s Second Biggest Cargo Harbour

             TERRITORY    119 ha
             AQUATORY     147 ha
TOTAL LENGTH OF BERTHS    1,85 km
     NUMBER OF BERTHS     10
           MAX. DEPTH     14,5 m
MAX. LENGTH OF A VESSEL   230 m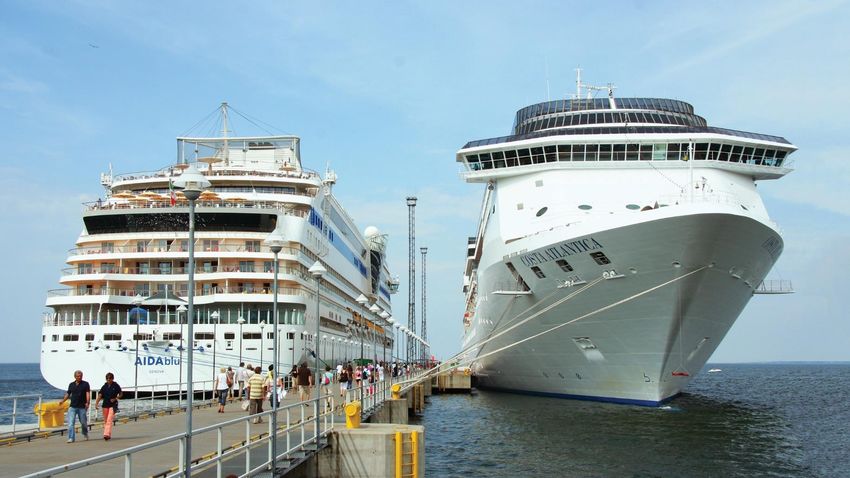
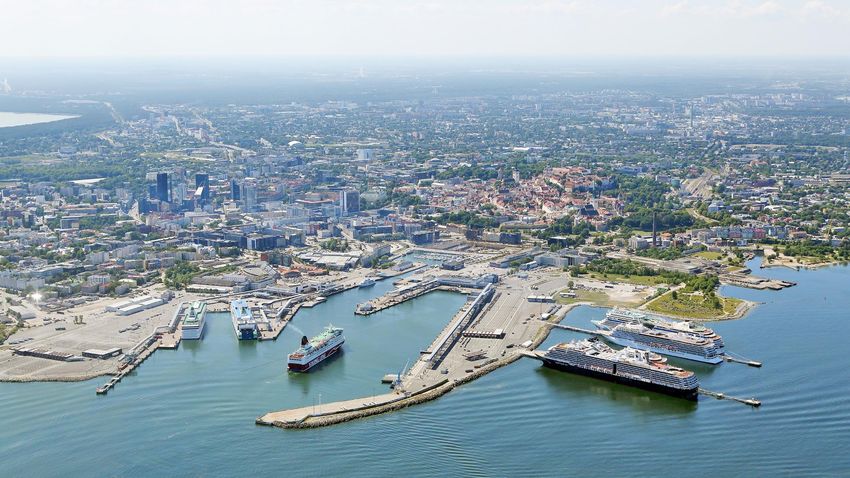
OLD CITY HARBOUR                                            TERRITORY
                                                            AQUATORY
                                                                         55.3 ha
                                                                         94 ha
Estonia’s Biggest Tourism Gateway              TOTAL LENGTH OF BERTHS    5 km
                                                    NUMBER OF BERTHS     24
                                                          MAX. DEPTH     10.7 m
                                               MAX. LENGTH OF A VESSEL   340+ m

Passengers (ferries, cruises, yachts), Ro-Ro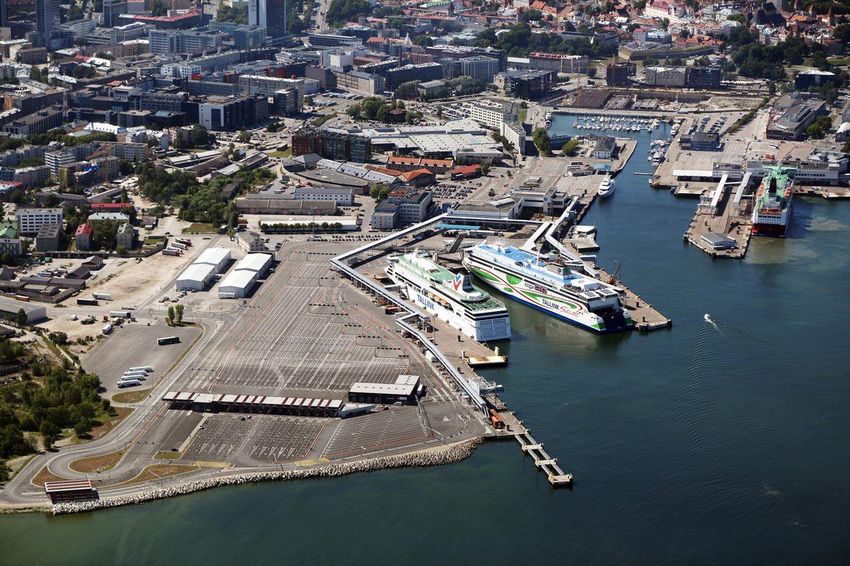
CALLS PER YEAR (2018) - 348
Cruises   PASSENGERS PER YEAR (2018) - 638 000
Business Fields

Passengers
                                                     Real Estate
   10.6 m
 passengers   Cargo         Shipping            Muuga Industrial Park 76 ha
                                                Paldiski Industrial Park 34 ha
                                5 ferries:      Tallinn Old City Harbour real
              20.6 m       2 m passengers &      estate development 16 ha
               tons           1 m vehicles;
                          Ice-breaker Botnica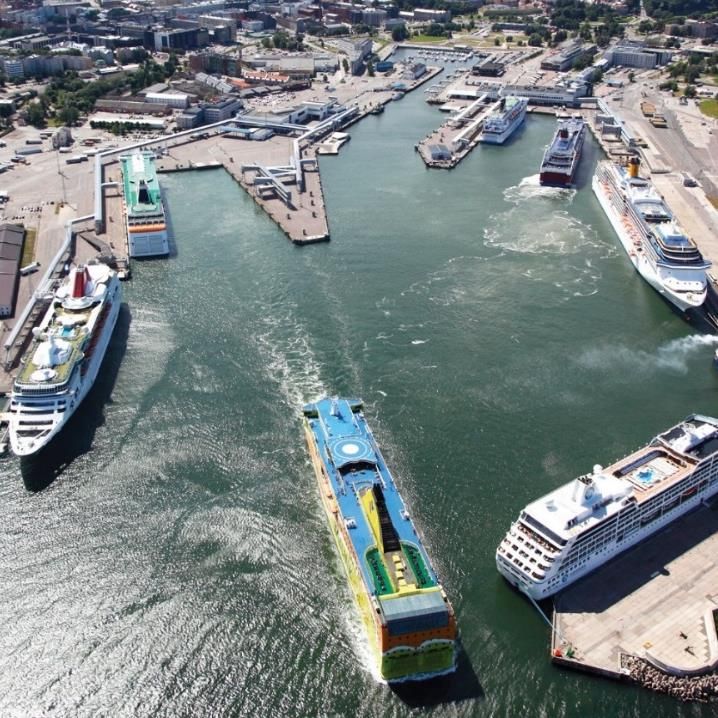
Revenue Structure & Main Customers

           Passenger harbours
                                          Revenue 2018                    Cargo harbours

  Regular lines                 Cruise                       Terminal operators                    Shipping lines
                                           38%         32%

                                                                             (2)
                                             7%       23%

                                         Adj. EBITDA 2018
                        Other                                                      Ferries

            Botnica                                                                Clients
                                                       32%
                                          44%

         Republic of Estonia                          18%                    Republic of Estonia
                                                 6%
Marine and logistics sector
Megatrends and vision
e-trade
MEGATRENDS VISION
Industry 4.0
Larger Unmanned vessels
vessels Logistics 5.0 Fully automated
terminals and
Cost efficiency multimodality
TEXT New TEXT
technologies Digital data
exchange
Digitalisation and
automation Competition Green port
Environmental Cooperation of Client experience
requirements logistic chainRevenue model
Passenger harbours
2018 Contribution
2018 Revenue Breakdown
Revenue
4%
Rental Income 38%
3% • Fixed lease income from operators using PoT’s land
3%
premises (commercial operators e.g. shops, restaurants)
Adjusted EBITDA
Cargo Charges
34% • Pre-agreed tariffs for ro-ro cargo carried on ROPAX 44%
vessels
Passenger Fees
• Passenger fees per passenger based on public price list Key Customers
Cruise
• Line and Cruise passenger fees are based on similar Regular Lines
model, but have different tariffs
Vessel Charges
55%
• Tonnage charges based on gross tonnage separately for
each call of the vessel based on public price list Cruise
• Waste fee based on vessel gross tonnage for each vessel
call, in case of passenger ships for one call per day
• Mooring charge based on the gross tonnage of the vesselRevenue model
Cargo harbours
2018 Contribution
2018 Revenue Breakdown
Revenue
32%
3%
Sales of Electricity
12% • Calculated based on the readings of customers electricity
meters Adjusted EBITDA
Rental Income 32%
22%
• Fixed lease income from operators using PoT’s land and
facilities
14% Cargo Charges
• Pre-agreed tariff based charges (volume x tariff = charge) Key Customers
Cruise
• Cargo charges agreed separately from operator to operator Terminal Operators
• Contractual penalties if terminal operators fail to handle pre-
agreed minimum amounts of cargo
50%
Vessel Charges
Shipping Lines
• Tonnage charges based on vessel gross tonnage
• Waste fee
• MooringRevenue model
Ferry business
2018 Contribution
Revenue
23%
Adjusted EBITDA
18%
Customer
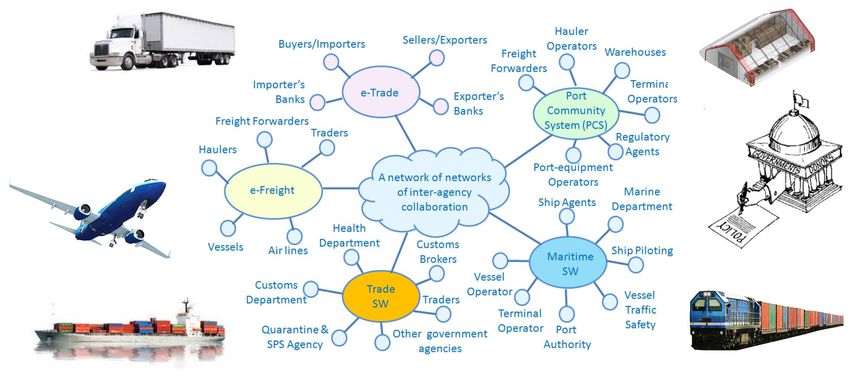
State of EstoniaSmart Port solution
Logistics X-Road & Single Window
Opportunities:                 • Line traffic and cruise business development –
                                 Muuga-Vuosaari line
Passengers                     • Asian clients
                               • Passenger terminals renovation
                               • Cruise terminal construction
                               • Smart Port and traffic management systems,
                                 automooring

OLD CITY HARBOUR
Main tourism gate of Estonia
Opportunities: • North-South direction trade increase (incl. Rail Baltica)
•
Cargo •
Chinese silk road branch (e-trade, distribution center)
LNG and container goods market growth
• Conscious development of the competitiveness of freight
corridors passing through Estonia together with other
participants of the logistics chain
• Digitalisation of the logistics chain
MUUGA HARBOUR
Largest cargo harbour in EstoniaOpportunities: Shipping TS Laevad: • third ship on Saaremaa line (for summer) • improvement of service quality • effective operation TS Shipping: • MPSV Botnica summer charter
MPSV Botnica
Subsidiary TS Shipping OÜ
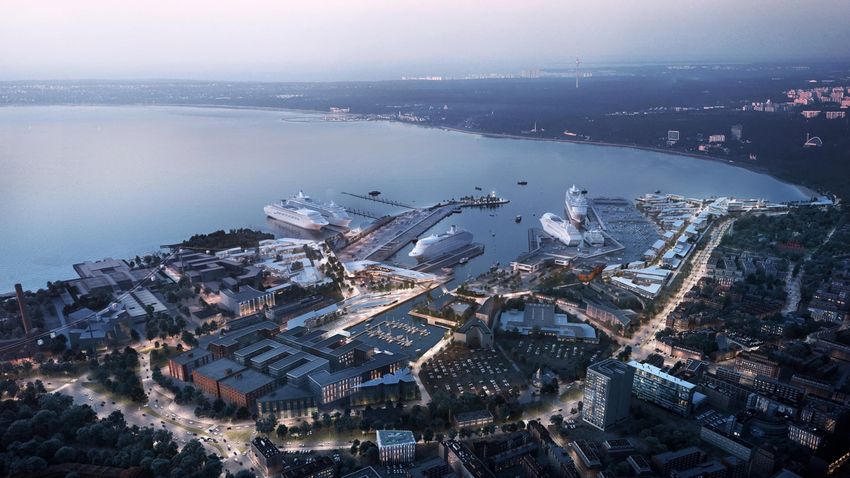
Opportunities: Real Estate
•   Execution of the Old City Harbour development plan Masterplan 2030+
•   Starting detail plans and generating business models
•   Improvement of Old City Harbour attractiveness as a tourism and main
    marine gate, excellent service experience
•   Development of the industrial parks and providing additional value
Real estate development In the Old City Harbour • Masterplan 2030 • MOU with Tallinn City • Total build-up area of 460,000 gross m2 above ground (including 160,000m2 extension possibility by land reclamation) • Detail plans are in the process of being initiated by the city
Trading of the share
First year on Nasdaq Tallinn SE
                                                                                                    Share price (EUR)
                                               2,20                                                                                                                                  1000
                                               2,15
• Market capitalisation EUR 519 mln 14.08.19   2,10
                                                                                                                                                                                     950

                                               2,05                                                                                                                                  900
                                               2,00
                                                                                                                                                                                     850
                                               1,95
• Listed since 13.06.18, 263 mln shares        1,90                                                                                                                                  800

                                                                                    09.18
                                                            06.18
                                                                    07.18
                                                                            08.18

                                                                                            10.18
                                                                                                     11.18
                                                                                                             12.18
                                                                                                                     01.19
                                                                                                                             02.19
                                                                                                                                     03.19
                                                                                                                                             04.19
                                                                                                                                                     05.19
                                                                                                                                                             06.19
                                                                                                                                                                     07.19
                                                                                                                                                                             08.19
                                                                                                    TSM1T (L)                    OMXBBGI (R)
• Free float 33%, i.e. 86.7 million shares
                                                                                    Monthly volume and turnover
                                                           12 000                                                                                                                    25

                                                                                                                                                                                          Millions
                                               Thousands
• As at 14.08.2019 share price up 16%
                                                           10 000                                                                                                                    20
                                                            8 000
                                                                                                                                                                                     15
                                                            6 000
                                                                                                                                                                                     10
  compared to offer price.                                  4 000
                                                            2 000                                                                                                                    5

  Since listing max EUR 2.18, min EUR 1.91.                     0                                                                                                                    0

                                                                                    Volume (left)                            Turnover mEUR (right)
Shareholder structure
12 500 shareholders
EST PF&IF
6% (6%) BALTIC funds
(LV, LT)
2% (2%)
TOP 5 shareholders:
EST retail
9% (7%)
1. Republic of Estonia 67.0%
2. JP Morgan Chase Bank 3.7%
3. EBRD 3.6%
State 4. SEB progressive PF 2.5%
67% (67%)
INT funds
5. LHV pension fund L 2.0%
16% (18%)
*as at 30.06.2019 compared to 12.06.2018 in bracketsDividend stock
Equity story
✓ Expectations of the State as the majority
Dividends paid (mEUR) shareholder for continuous stable dividends
120
105 ✓ Stable EBITDA and cashflow
100
80 DIVIDEND POLICY
60
48 • Min EUR 30M annually in 2019 and 2020
40 31 35 35 • starting 2021 at least 70% of net profit
20
Dividend paid in 2019 EUR 35,242M
0
2015 2016 2017 2018 2019 (EUR 0,134 per share)Successful year 2018 • IPO in May 2018 • Passengers: ✓ Record high cruise season ✓ 11th annual record in PAX numbers ✓ Smart Port solution completion ✓ Start of D terminal reconstruction ✓ Masterplan 2030, MOU with City of Tallinn
Successful year 2018
• Cargo:
   ✓ Liquid bulk growth in tight competition
   ✓ Oilseed factory cooperation agreement
   ✓ Paldiski LNG terminal MOU with Alexela
   ✓ LNG bunkering station in Muuga agreement
     with Vopak
   ✓ HHLA - new owner of Muuga container
     terminal
• Ferry: Additional ferry on Saaremaa line
• Other: Botnica agreement with Baffinland
Latest highlights In first half of 2019 • Vopak E.O.S. acquired by Liwathon • PAX vessels maintenance in Q1 decline in PAX, vessel calls and revenues • Additional ferry trips on Saaremaa line in summer • MPSV Botnica charter for summer in Baffin island • Dividend payment on 04.06.2019 (EUR 0.134 per share) • New RO-PAX ship on Muuga-Vuosaari line by Eckerö and start of PAX service by Eckerö and Tallink • New dry bulk and general cargo terminal in Muuga Harbour by PK Terminal
Cargo Volume
                by cargo type
               25,0
                      FY 2017-2018                                                                        12,0
                                                                                                                 6M 2018-2019
                                                   +7,4%                 20,6                                                      -0,8%
                                                                                                                           10,1             10,0
               20,0                    19,2                              0,6                              10,0             0,3               0,4
                                       0,6                               1,9                                               1,0               0,9
                                       1,9
                                                                         3,9                               8,0             1,8               2,0
               15,0
                                       4,1
Million tons

                                                                                           Million tons
                                                                                                           6,0
                                                                         5,3                                               2,7
                                                                                                                                             2,7
               10,0                    5,1
                                                                                                           4,0

                5,0                                                                                                        4,3
                                                                         8,8                               2,0                               4,0
                                       7,4

                                                                                                           0,0
                0,0
                                                                                                                         2018 6M           2019 6M
                                       2017                              2018

                         Liquid bulk     Ro-Ro   Dry bulk   Containers     General cargo
Number of Passengers
by routes
12000 6000
FY 2017-2018 +0,6% 6M 2018-2019
10 560 10 619 -2,7%
10000 566 100 638 90
5000
4827
4697
1013 1009 85 244 34
83 241 43
491 416
31 28
8000 4000
Thousand PAX
Thousand PAX
6000 3000
2 2
8798 8797
4000 2000 4026 3968
2000 1000
0 0
2017 2018 6M 2018 6M 2019
Tallinn-Helsinki Tallinn-Stockholm Tallinn-St.Petersburg Cruise (traditional) OtherResults of the Group In thousands 2017 2018 +/- 6M 2018 6M 2019 +/- Revenue 121 295 130 635 7.7% 62 166 61 350 -1.3% Adjusted EBITDA 66 521 74 380 11.8% 35 695 35 706 0.0% Adjusted EBITDA margin 54.8% 56.9% 2.1 57.4% 58.2% 0.8 Operating profit 40 317 52 075 29.2% 24 950 24 731 -0.9% Income tax -11 955 -26 199 119.1% -26 250 -5 764 -78.0% Profit/loss for the period 26 425 24 423 -7.6% -2 256 18 199 906.7% Investments 36 847 14 251 -60.2% 5 190 11 070 113.3%
Cash Flow and Financial Position
Cash Flow statement                                                                 Financial position
                                                              700

In thousands                          2018       6M 2019
                                                              600

Cash from operating activities          57 113       31 484   500

                                                                                          368                                351
Cash used in investing                                        400
                                       -12 325      -10 159
activities                                                            573                                   572
                                                              300
Free cash flow (FCF)                    44 788       21 325                                42                                48
                                                              200
Cash from/used in financing
                                        -9 179      -39 250   100                         214                                210
activities                                                                      8
                                                                                                                  12
                                                                      43                                    25
                                                               0
NET CASH FLOW                           35 609      -17 925         31.12.18            31.12.18       30.06.19            30.06.19
                                                                            Cash                   Other current assetes
NET DEBT (at the end of the period)    171 049      185 591                 Non-current assets     Debt
                                                                            Other liabilities      Equity
Results
on segment level (in million EUR)
FY 2017-2018 6 months 2018-2019
49,9 Passenger H 22,3
Passenger H
49,9 23,1
41,7 Cargo H 20,0
Cargo H
39,8 20,5
Ferry 30,1 Ferry 14,8
27,1 14,4
Other 8,9 Other 4,3
4,6 4,2
0 10 20 30 40 50 60 0 5 10 15 20 25
Revenue 2018 Revenue 2017 Revenue 2019 Revenue 2018
Adjusted EBITDA 2018 Adjusted EBITDA 2017 Adjusted EBITDA 2019 Adjusted EBITDA 2018Questions?
Thank
      You!
                IR related questions:
                          Marju Zirel
           Head of Investor Relations
                       m.zirel@ts.ee

portoftallinn.com • investor.ts.ee
You can also read