Company Presentation

 Capital Markets Day
      21.9.2016
←
→
Page content transcription
If your browser does not render page correctly, please read the page content below
Company Presentation
Capital Markets Day
21.9.2016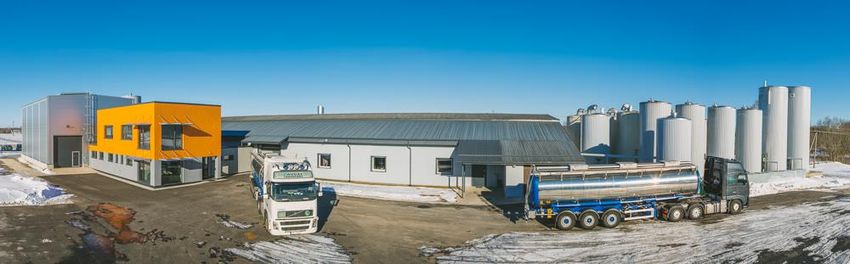
• Estonian-based company serving the beverage industry with key raw
                materials for ciders and alcopops.
The company   • AS Linda Nektar specialises in the fermenting and treatment of fruit wines
                according to their customers’ needs.
              • The company is located in southern Estonia, with easy access to all Baltic
                countries.
              • Considerable investments have been made into proprietary R&D over the
                past eight years, with a view to commercialising this know-how.

              Source: Linda Nektar

                      AS Linda Nektar September 2016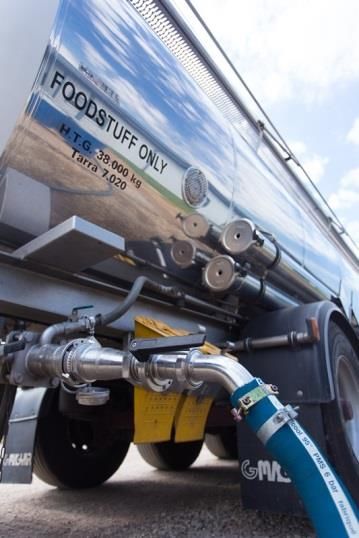
• 1993: Primalco Oy, the Finnish state alcohol monopoly purchases the
            majority of Linda Nektar’s shares.
History
          • 1998: Transfer of new tanks and equipment from Primalco’s site in
            Helsinki/Finland.
          • 2002: Fermex International becomes majority owner. End of bottling and
            consumer products. Change from B2C to B2B company takes place.

            Focus on wine fermentation starts.

                              Source: Linda Nektar

                AS Linda Nektar September 2016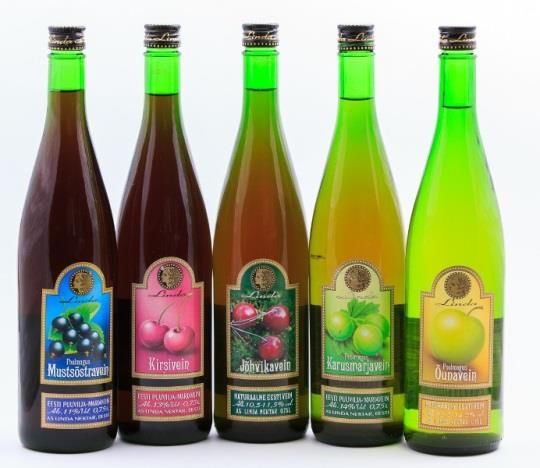
AS Linda Nektar’s focus is to constantly develop its processes and products.
                    A development programme for aroma treatment technology was initiated in 2013
   Focus on         and the commercialisation of this technology is now in its initial roll-out phase.
  development

                    In the course of Linda Nektar’s change from a B2C to a B2B company, several
                    evolutionary steps took place:
Gradual evolution   • 2004-2005: Introduction of modern cross flow filtration.
                    • 2005: First in world to install IsoMix mixers to boost and control fermentation.
                    • 2011: Additional cross flow filter capacity installed.
                    • 2012-2013: New building completed and new fermentation tanks installed.
                    • 2014: In line mixing facility completed.
                    • 2015-2016: Increased capacity in place and installation of full-scale aroma
                      treatment equipment underway.

                           AS Linda Nektar September 2016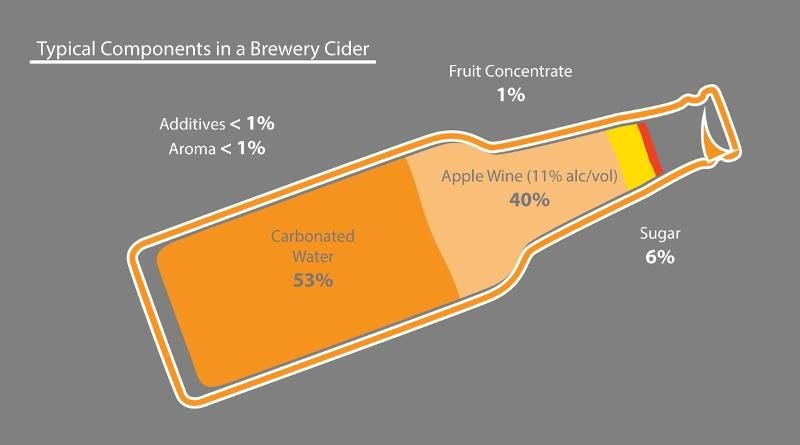
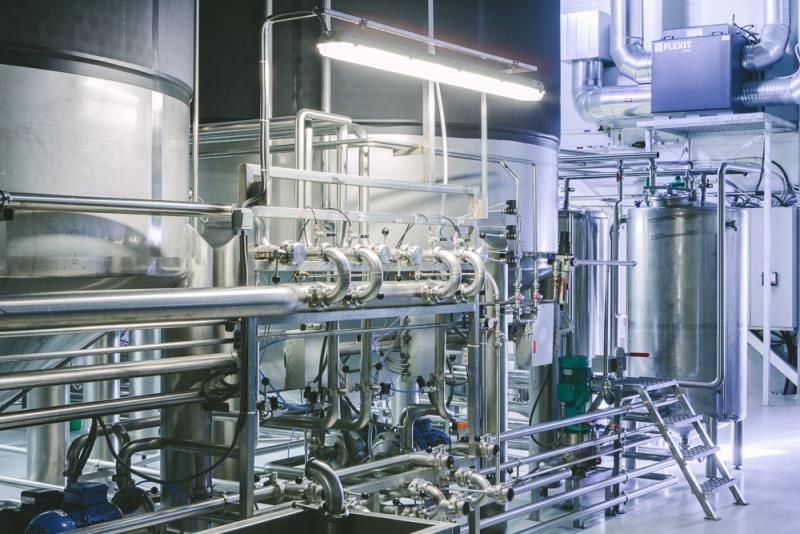
Linda Nektar’s product is fermented and treated wine, shipped in tankers to
 Production     customers.
Production

              A simplified description of the production process

                               Source: Linda Nektar

                       AS Linda Nektar September 2016
The products are used as a component in ciders and alcopops.
The customers are bottlers in the Baltic countries and Finland.
Products and
customers
Source: Linda Nektar
AS Linda Nektar September 2016Expansion
Linda Nektar continues to improve the products and processes.
Future
New Business
Development of business model in progress.
Screening of strategic partners in progress.
AS Linda Nektar September 2016Selected Interim Financial Highlights
Financial Ratios H1 2016 H1 2015
Current Ratio = Current Assets/ Current Liabilities (x) 3.96 6.61
Quick ratio = (Current Assets – Inventories) / Current Liabilities (x) 3.16 5.88
Working Capital = Current Assets - Current Liabilities (EUR) 1,340,468 1,817,296
Equity Ratio = Total Equity / Total Assets (%) 89.55 91.47
Net Profit Margin= Net Profit / Sales Revenue (%) 19.47 16.74
Debt to Assets= Total Liabilities / Total Assets (x) 0.10 0.09
Sales revenue growth:46% y-o-y during the first half of 2016.
Net profit growth: 70% y-o-y during the first half of 2016.
AS Linda Nektar September 2016Top and Bottom Line Development from 2010
Sales Revenue (EURm)
4,0
3,5
3,0
2,5
2,0
1,5
1,0
0,5
0,0
2010 2011 2012 2013 2014 2015 6 months
2016
AS Linda Nektar September 2016Top and Bottom Line Development from 2010
Net Profit (EURm)
1,0
0,9
0,8
0,7
0,6
0,5
0,4
0,3
0,2
0,1
0,0
2010 2011 2012 2013 2014 2015 6 months
2016
AS Linda Nektar September 2016Interim Results Overview
Balance Sheet (EUR) 30.06.2016 31.12.2015 30.06.2015
Assets
Current assets
Cash and cash equivalents 744 903 991 984 1 359 386
Receivables and prepayments 689 546 364 401 546 489
Inventories 359 642 339 693 235 517
Total current assets 1 794 091 1 696 078 2 141 392
Non-current assets
Receivables and prepayments 0 0 582
Property, plant and equipment 2 367 273 1 996 019 1 653 359
Intangible assets 179 193 209 860 3 911
Total non-current assets 2 546 466 2 205 879 1 657 852
Total assets 4 340 557 3 901 957 3 799 244
Liabilities and equity
Liabilities
Current liabilities
Payables and prepayments 297 766 210 703 249 984
Government grants 155 857 74 112 74 112
Total current liabilities 453 623 284 815 324 096
Total liabilities 453 623 284 815 324 096
Equity
Issued capital 1 575 109 1 575 109 1 575 109
Share premium 617 517 617 517 673 573
Statutory reserve capital 24 818 2 812 2 812
Retained earnings (loss) 1 257 938 981 564 981 564
Annual period profit (loss) 411 552 440 140 242 090
Total equity 3 886 934 3 617 142 3 475 148
Total liabilities and equity 4 340 557 3 901 957 3 799 244Interim Results Overview
01.01.2016 01.01.2015
Income Statement (EUR)
- 30.06.2016 - 30.06.2015
Revenue 2 113 661 1 446 303
Changes in inventories of finished goods and work in progress 18 642 36 743
Raw materials and consumables used -1 170 116 -700 306
Other operating expenses -173 020 -247 780
Employee expenses -174 372 -152 924
Depreciation and impairment loss (reversal) -167 848 -107 697
Other expense -1 -204
Operating profit (loss) 446 946 274 135
Other financial income and expense 46 230
Profit (loss) before tax 446 992 274 365
Income tax expense -35 440 -32 275
Annual period profit (loss) 411 552 242 090
AS Linda Nektar September 2016Disclaimer
This Presentation has been drawn up by AS Linda Nektar (‘The Company’) purely for informational and marketing purposes. It
may not, without the prior consent of the Company, be reproduced or used for any other purpose. This Presentation is not
advising nor soliciting any action based upon it.
The information made available in this Presentation has been chosen and provided by the Company at its sole discretion and it
is not aiming to be exhaustive or complete. Although every effort is made to ensure that the information contained in this
Presentation is correct and not misleading, the Company assumes no liability of whatever nature for the correctness,
comprehensiveness or completeness of the information contained herein.
This Presentation or any piece of information may not be construed as a representation or warranty of the Company or any
other person. There is no public offering of the shares of the Company or any other securities in Estonia or any other
jurisdiction, including the United States. In particular, the securities referred to herein have not been, and will not be, registered
under the United States Securities Act of 1933, as amended (the Securities Act), or under the securities laws of any state or
other jurisdiction of the United States and may not be offered, delivered or sold within the United States or to, or for the
account or benefit of, any U.S. person (as defined in Regulation S under the Securities Act) except pursuant to an exemption
from, or in a transaction not subject to, the registration requirements of the Securities Act and in compliance with any
applicable securities laws of any state or other jurisdiction in the United States.
This document contains forward-looking statements that are based on the Parties’ expectations, estimates, projections and
assumptions. Forward-looking statements involve risks and uncertainties that may cause actual results to differ materially from
those contemplated by such statements. Forward-looking statements are made and based on information available to the
Parties on the date of this document. The Parties do not assume, and expressly disclaim, any obligation to update this
information, nor do the Parties take any responsibility to guarantee any result predicted in this document to become actual.
The shares of Linda Nektar are admitted to trading on Nasdaq Baltic First North Market.
The Certified Adviser for AS Linda Nektar is AS LHV Pank
AS Linda Nektar September 2016You can also read