Index Investing: Why the devil really is in the detail - Nico Katzke - Bcisconference
←
→
Page content transcription
If your browser does not render page correctly, please read the page content below

Index Investing: Why the devil really is in the detail
Nico Katzke

May 2021

“The choice [of benchmark] will be the single most important
investment decision made in the long-only active equity space.
 The magnitude of that decision will almost always dwarf the
     importance of the manager’s active selection or any
  subsequent alpha value-add – of this there is little debate.”

           ~ Polakow, D.P. (2011). The long and active existentialist.
                         Journal of Asset Management
Index Investing: The misnomer that is “Passive”
Common misconceptions with Index / Passive investing

• Passive investing is often confused with a style agnostic investment product with the sole purpose of minimizing cost.

  • Yet Passive indices in reality often have strong active tilts (some by construction, others by virtue of constituent
    attributes) – which makes labelling index trackers as passive a misnomer.

• While index trackers are bound by construction rules (and so may exhibit consistent tilts) – active managers, in theory,
  should be able to tilt toward those factors that are currently in favour.
  • In reality, most active managers often remain style neutral and fail to tilt consistently and successfully.

• Three things are clear in our market along the active-vs-passive debate that I want to highlight today:
  • Active managers seldomly outperform Index Trackers;
  • Outperforming consistently is a rarity;
  • Index Trackers have active risk resembling active funds and often consistent and strong style tilts.

                                                                                                                             3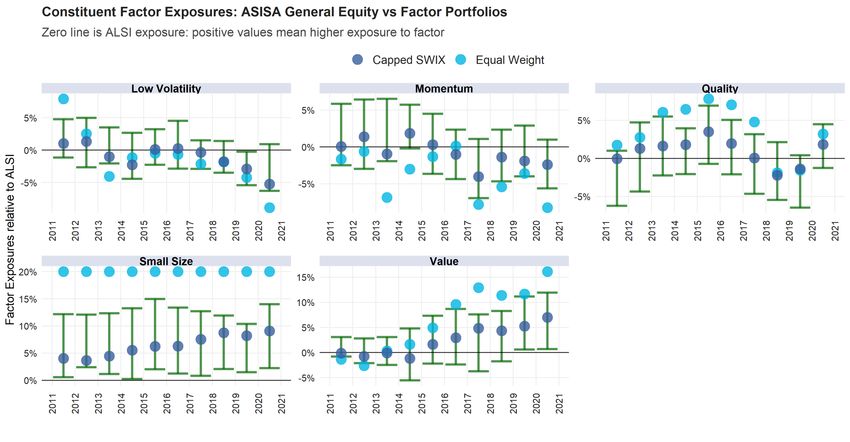
1) Active Managers: Poor performance to Index Trackers

                                                         4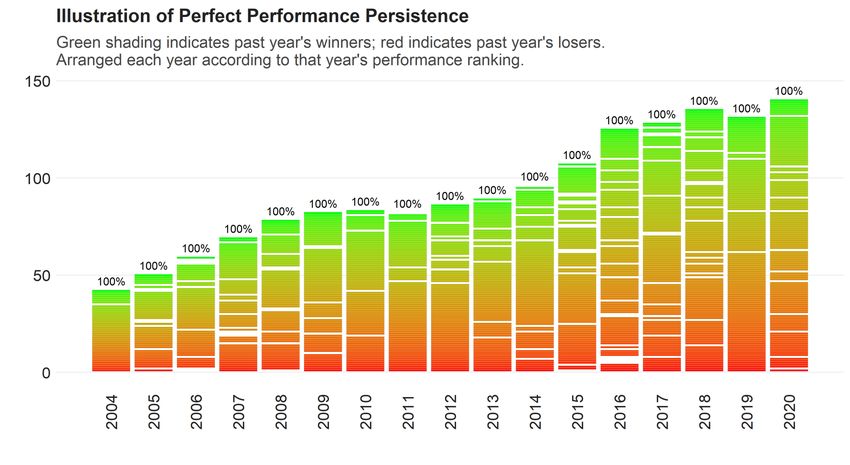
1) Active Managers: Poor performance to Index Trackers

                                                         5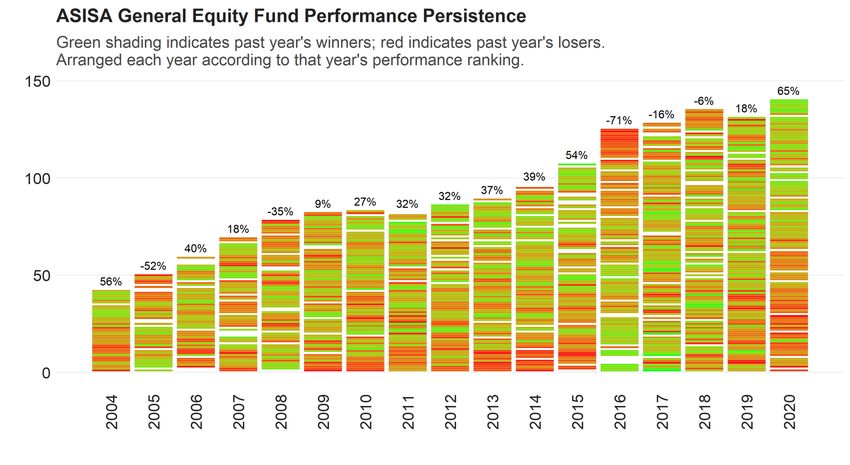
2) Active Managers: Low Persistence in Performance

Performance of retail class active funds excluding fund of funds and index funds. Source: Morningstar, FTSE/JSE & Satrix, January 2002 – December 2020
Text Above plots: Spearman rank correlation with previous year’s fund rankings                                                                           6
2) Active Managers: Low Persistence in Performance

Performance of retail class active funds excluding fund of funds and index funds. Source: Morningstar, FTSE/JSE & Satrix, January 2002 – December 2020
Text Above plots: Spearman rank correlation with previous year’s fund rankings                                                                           7
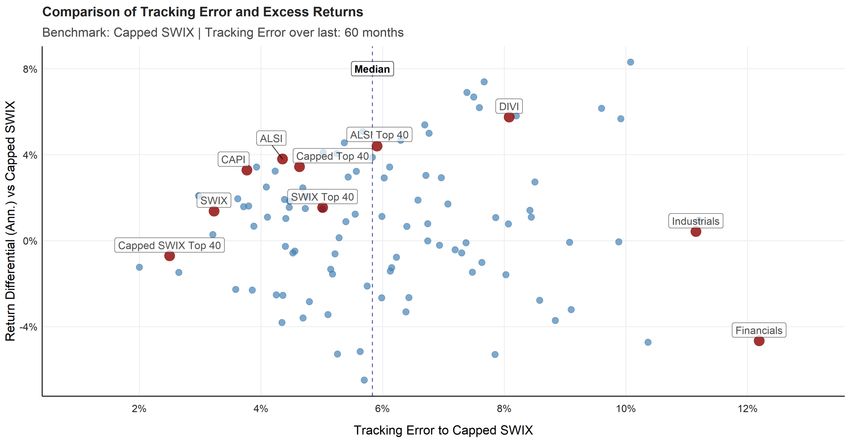
3) Passive Vehicles have high active risk

Source: Morningstar | Calculations: Own
Rolling 24 month tracking error calculated at each month for the ASISA General Equity Funds. The list of active funds is filtered to take the net of fee performance of the retail class and to exclude any index funds and fund of funds. The list
                                                                                                                                                                                                                                                      8
includes non-surviving funds. The proxy for index funds are a concatenated time series of the total return series (TR ZAR) reduced by a fee of 50 basis points.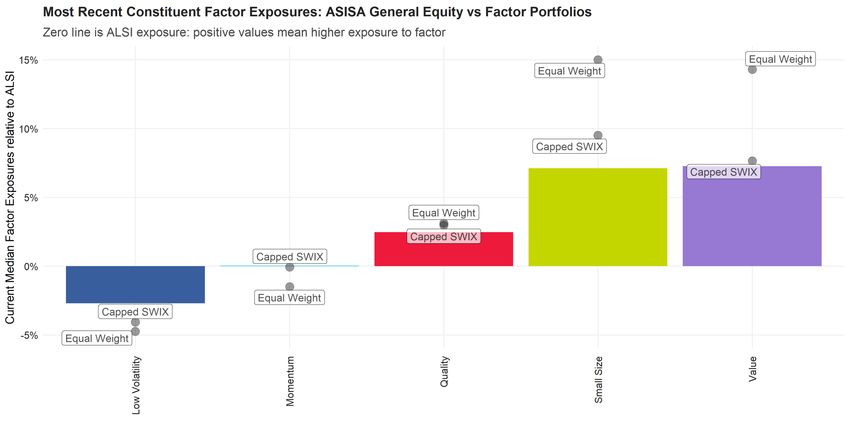
3) Passive Vehicles have high active risk

Source: Morningstar | Calculations: Own
Rolling 24 month tracking error calculated at each month for the ASISA General Equity Funds. The list of active funds is filtered to take the net of fee performance of the retail class and to exclude any index funds and fund of funds. The list
                                                                                                                                                                                                                                                      9
includes non-surviving funds. The proxy for index funds are a concatenated time series of the total return series (TR ZAR) reduced by a fee of 50 basis points.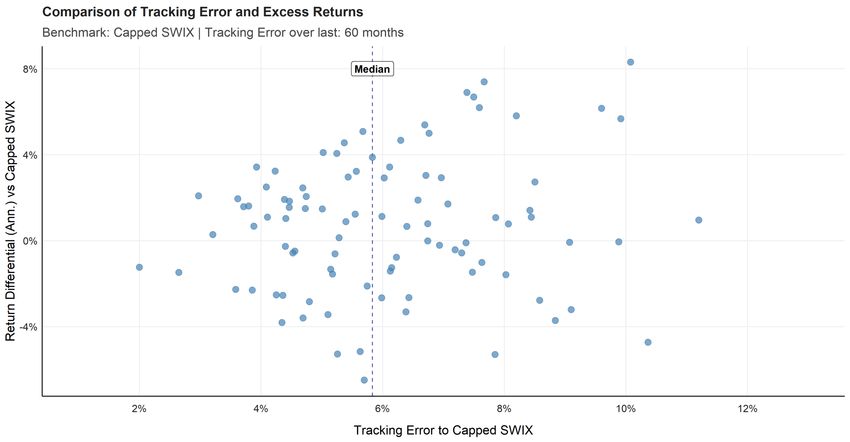
Understanding why - Splitting Alpha into Beta
α α Academically Verified Factors:
α
• Small Size
Pure alpha α
• Value (cheap) companies
• Higher Profitability (Quality)
Factors
Factors
Factors
• Positive Momentum
• Low Volatility (stable returns)
Total return
β β β
Market β
70’s 80’s 90’s 2000 2010+
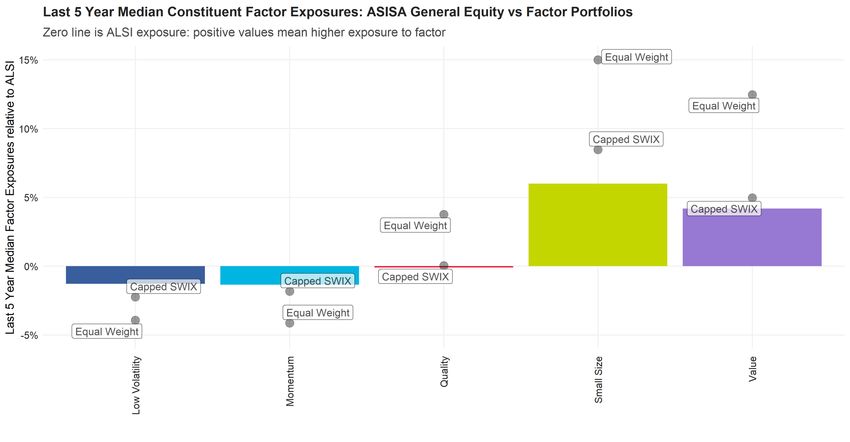
103) Active style tilts relative to ALSI
Values above line imply:
• Lower Volatility (stable returns)
• Positive Momentum
• Higher Profitability (Quality)
• Smaller Size tilt
• Better Value (cheaper) tilt
Source: Morningstar | Calculations: Own
ASISA General Equity Funds: Largest 100 funds currently listed with at least 5 years’ track record included. Holdings information collated for between 60 – 100 funds at each date.
Fund of Funds and style funds excluded. Funds with less than 10 stocks at a date excluded. Displayed exposures capped at 15% for scaling purposes. 11Active style tilts relative to ALSI Source: Morningstar | Calculations: Own Coloured bars represent 100 largest ASISA General Equity Funds’ median constituent holding style tilts. Fund of Funds and style funds excluded. Displayed exposures capped at 15% for scaling purposes. 12
Active style tilts relative to ALSI

Source: Morningstar | Calculations: Own
Coloured bars represent 100 largest ASISA General Equity Funds’ median constituent holding style tilts.
Fund of Funds and style funds excluded. Displayed exposures capped at 15% for scaling purposes.           13
Conclusion

• 3 Lessons from this presentation:
 • Passive Index Trackers are hard to beat;
 • Active managers are inconsistent in their efforts at doing so;
 • Passive vehicles (like the All-Share Index) have strong and consistent active tilts
   • The choice of passive is therefore very active.

• In terms of active tilts currently we see:
 • Median active managers have style exposures more closely resembling the Capped SWIX
 • Median managers and Capped SWIX currently have:
     • Momentum tilt in line with ALSI (negative tilt has hurt in past 5 years)
     • Strong positive Value and Quality tilts
     • Strong tilt towards more Volatile stocks
                                                                                         14
thank you
Disclaimer

Satrix Managers (RF) (Pty) Ltd (Satrix) a registered and approved Manager in Collective Investment Schemes in Securities and an
authorised financial services provider in terms of the FAIS. Collective investment schemes are generally medium- to long-term investments.
Unit Trusts and ETFs the investor essentially owns a “proportionate share” (in proportion to the participatory interest held in the fund) of the
underlying investments held by the fund. With Unit Trusts, the investor holds participatory units issued by the fund while in the case of an
ETF, the participatory interest, while issued by the fund, comprises a listed security traded on the stock exchange. ETFs are index tracking
funds, registered as a Collective Investment and can be traded by any stockbroker on the stock exchange or via Investment Plans and
online trading platforms. ETFs may incur additional costs due to it being listed on the JSE. Past performance is not necessarily a guide to
future performance and the value of investments / units may go up or down. A schedule of fees and charges, and maximum commissions
are available on the Minimum Disclosure Document or upon request from the Manager. Collective investments are traded at ruling prices
and can engage in borrowing and scrip lending. Should the respective portfolio engage in scrip lending, the utility percentage and related
counterparties can be viewed on the ETF Minimum Disclosure Document. The Manager does not provide any guarantee either with respect
to the capital or the return of a portfolio. The index, the applicable tracking error and the portfolio performance relative to the index can be
viewed on the ETF Minimum Disclosure Document and or on the Satrix website.

Performance is based on NAV to NAV calculations of the portfolio. Individual performance may differ to that of the portfolio as a result of
initial fees, actual investment date, dividend withholding tax and income reinvestment date. The reinvestment of income is calculated based
on actual distributed amount and factors such as payment date and reinvestment date must be considered.

The information does not constitute financial advice as contemplated in terms of the Financial Advisory and Intermediary Services Act, No
37 of 2002 (“FAIS”). Use or rely on this information at your own risk. Consult your financial advisor before making an investment decision.

International investments or investments in foreign securities could be accompanied by additional risks such as potential constraints on
liquidity and repatriation of funds, macroeconomic risk, political risk, foreign exchange risk, tax risk, settlement risk as well as potential
limitations on the availability of market information.

                                                                                                                                                   16
You can also read