Full Year Results Presentation - 27 July 2021 - AFIC
←
→
Page content transcription
If your browser does not render page correctly, please read the page content below

Full Year Results Presentation
27 July 2021
Disclaimer

    Australian Foundation Investment Company Limited and its subsidiary AICS (AFSL 303209), their
    related entities and each of their respective directors, officers and agents (together the Disclosers) have
    prepared the information contained in these materials in good faith. However, no warranty (express or
    implied) is made as to the accuracy, completeness or reliability of any statements, estimates or opinions
    or other information contained in these materials (any of which may change without notice) and to the
    maximum extent permitted by law, the Disclosers disclaim all liability and responsibility (including,
    without limitation, any liability arising from fault or negligence on the part of any or all of the Disclosers)
    for any direct or indirect loss or damage which may be suffered by any recipient through relying on
    anything contained in or omitted from these materials.
    This information has been prepared and provided by AICS. To the extent that it includes any financial
    product advice, the advice is of a general nature only and does not take into account any individual’s
    objectives, financial situation or particular needs. Before making an investment decision an individual
    should assess whether it meets their own needs and consult a financial advisor.

2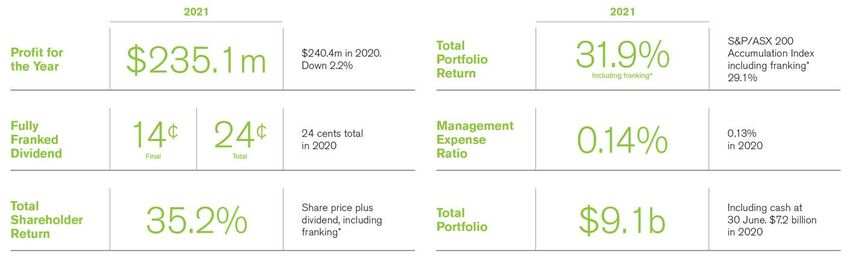
Agenda

    •   Overview and Objectives – Mark Freeman

    •   Financial Year in Summary – Andrew Porter

    •   Portfolio – David Grace and Nga Lucas

    •   Outlook – Mark Freeman

    •   Questions

3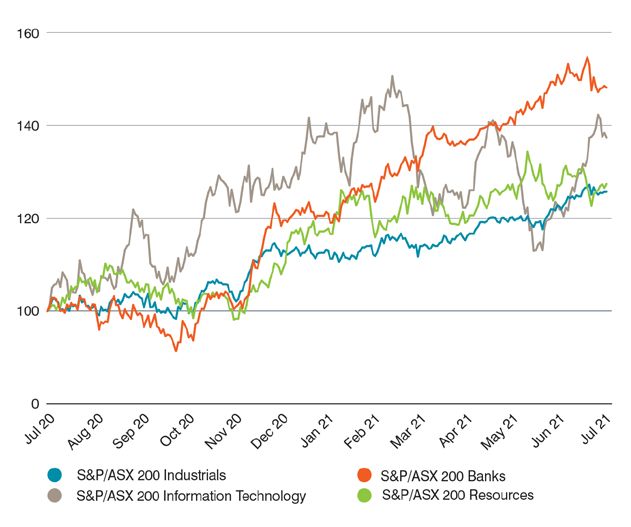
Our Company

    Invests in Australian and New Zealand companies – looking for quality for the long term.

    Largest listed investment company on the ASX at $9.1bn (also listed on NZX), 160k shareholders, full transparency
    from being listed, independent Board of Directors providing strong governance.

    Shareholders own the ‘management rights’ to the portfolio – no external funds management business deriving
    an income from the portfolio.

    Management expense ratio of 0.14% with no performance fees.

    Long term investor with low turnover – tax has less of a negative impact on shareholder returns compared with high
    turnover funds.

    Long history of growing/stable fully franked dividends.

    Team manages three other funds – Djerriwarrh, Mirrabooka and AMCIL which adds significantly to the effectiveness
    of the investment process and idea generation.

4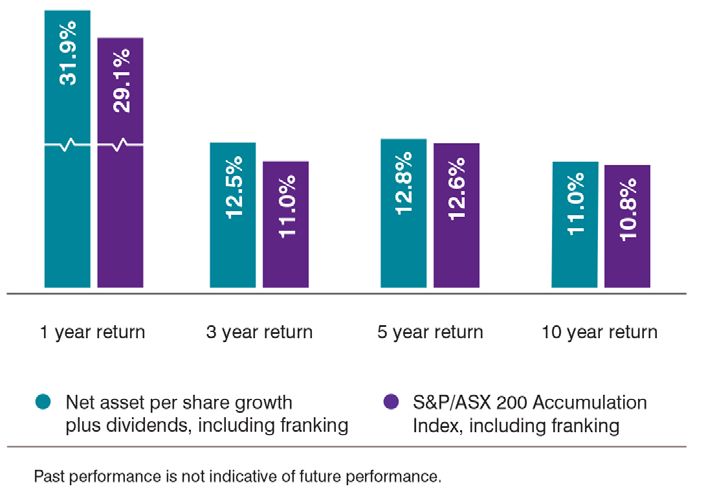
Investment Objectives

    The Company aims to provide               The Company’s primary investment goals are:
    shareholders with attractive investment
    returns through access to a growing       • to pay dividends which, over time, grow
    stream of fully franked dividends           faster than the rate of inflation; and
    and growth in capital invested.           • to provide attractive total returns over
                                                the medium to long term.

5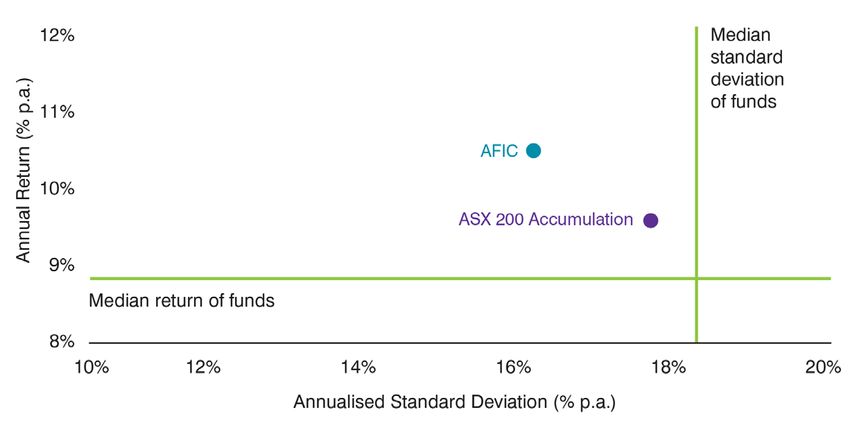
Full Year Result Summary – 12 months to 30 June 2021

    * Assumes a shareholder can take full advantage of the franking credits.

6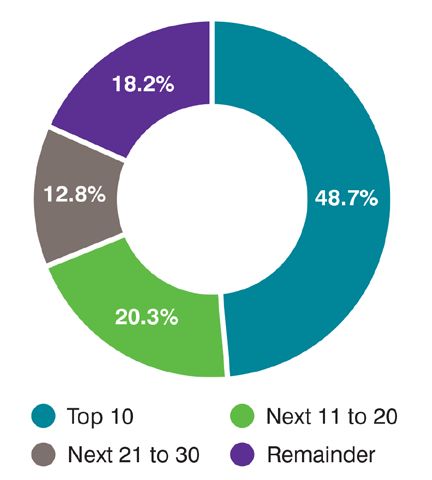
AFIC offers a diversified portfolio of quality stocks – what we look for

    Sustainable competitive   Strong management   Recurring, predictable   Financial strength
    advantage – unique        team and board      earnings are preferred   – strong cash flow
    assets producing strong                                                and balance sheet
    returns on capital

7
AFIC offers a diversified portfolio of quality stocks – what we look for
continued

       Businesses that can   Nursery stocks         Look to buy when we
       grow over the long    – developing the       see long term value
       term, producing       preceding attributes
       growing dividends

8
Market and Selected Sector Performances
S&P/ASX 200 Index Selected Sector Performance
5 Years to 30 June 2021 Financial Year 20/21
9Relative portfolio performance, including franking*
– per annum returns to 30 June 2021
AFIC portfolio returns have a lower
level of volatility (beta and standard
deviation) than the Index.
Returns include growing/stable fully
franked dividends over
a 10-year period.
AFIC share price returns have a
significantly lower level of volatility
(beta and standard deviation) than the
Index.
*assumes an investor can take full advantage of the franking credits
10Over the 3-year period to 30 June 2021 AFIC has a higher portfolio return with less volatility than the S&P/ASX 200 Index (both exclude franking) Source: Mercer Investment Performance Survey of Wholesale-Equity – Australia. Note AFIC’s return is after tax paid and costs. The universe for Wholesale-Equity – Australia returns are before tax and after fees 11
Winners and losers* - 12 months to 30 June 2021

                      Biggest Contributors   Biggest Detractors

                                                                  not held

                                                                  not held

* Percentage gain/loss over the period

12
Major portfolio changes
Purchases Sales
13Top 30 holdings – 30 June 2021
Total Portfolio 64 Holdings Rank Company % of Portfolio
(excluding international portfolio)
1 Commonwealth Bank of Australia 8.8%
2 BHP Group 7.3%
3 CSL 6.9%
4 Wesfarmers 4.9%
5 Westpac Banking Corporation 4.5%
6 Macquarie Group 3.8%
7 Transurban Group 3.8%
8 National Australia Bank 3.3%
9 Woolworths Group 2.7%
10 Australia and New Zealand Banking Group 2.7%
14Top 30 holdings – 30 June 2021 continued
Total Portfolio 64 Holdings Rank Company % of Portfolio
(excluding international portfolio)
11 Rio Tinto 2.6%
12 Mainfreight 2.6%
13 James Hardie Industries* 2.3%
14 Telstra Corporation* 2.3%
15 Amcor 2.0%
16 Reece 1.9%
17 ARB Corporation 1.7%
18 Sydney Airport 1.7%
19 Sonic Healthcare 1.6%
20 Goodman Group 1.6%
* Options were outstanding against part of the holding.
15Top 30 holdings – 30 June 2021 continued
Total Portfolio 64 Holdings Rank Company % of Portfolio
(excluding international portfolio)
21 ResMed 1.6%
22 Coles Group 1.3%
23 Seek 1.3%
24 Ramsay Health Care 1.3%
25 Carsales.com 1.3%
26 Xero 1.3%
27 Fisher & Paykel Healthcare 1.3%
28 ASX 1.2%
29 Brambles 1.2%
30 REA Group 1.0%
16Outlook
COVID-19 Low Interest Cost Inflation and Volatility likely Companies in the
rates and supply chain to increase portfolio well
valuation risks disruptions – positioned:
rising costs for
market strength
companies?
ability to absorb
rising costs
leverage
efficiencies
17Questions 18
You can also read