Company Profile June 2021 - Bayan Resources
←
→
Page content transcription
If your browser does not render page correctly, please read the page content below

Company Profile June 2021

Section 1:
Company Overview
Company Overview
One of the largest and growing integrated coal producers in Indonesia

Business / Activity Overview                                                                                                               Financial Summary
• Bayan Resources (“Bayan” or “Company”) is engaged in open cut mining of                                                                   US$MM, unless
    various coal mines located in East and South Kalimantan, Indonesia                                                                      stated otherwise
                                                                                                                                                                                         2018      2019      2020      1Q21

•   As an integrated coal producer, Bayan produces coal ranging from high CV to                                                             Production Volume (Mt)                        28.9      31.9      30.2        9.0
    sub-bituminous low-sulphur, low-ash coal                                                                                                Revenue                                     1,676.7   1,391.6   1,395.1    501.0
    − In 2020 Bayan produced 30.2 Mt of coal, a slight reduction (5%) from 31.9                                                             EBITDA   (2)
                                                                                                                                                                                         736.4     374.4     356.7     254.8
       Mt in 2019                                                                                                                            EBITDA margin                               43.9%     26.9%     25.6%    50.9%
    − In 2020 Bayan sold 36.3 Mt of coal, a 24% increase on the 29.2 Mt of coal                                                             Operating Cash Flow                          571.9      49.5     361.0     249.2
       sold in 2019. The increase is largely due to inventory built up in 2019                                                                      (3)
                                                                                                                                            Capex                                         79.6      59.5      87.7      33.2
    − With the completion of the coal hauling road to the Mahakam River in 2022,                                                                               (4)
                                                                                                                                            Free Cash Flow                               494.5     (10.0)    273.3     216.1
       the Company plans to increase production to 60+ Mtpa
                                                                                                                                            Total Debt                                   130.0     365.0     406.8
•   The Company has exclusive rights to mine through five Coal Contract of                                                                                                                                             406.3
                                                                                                                                                                       (5)
    Works (CCOWs) and 16 Mining Business Permits (IUP’s)                                                                                    Net Debt / (Net Cash)                        (99.2)    183.3      23.0    (198.5)

•   The Tabang Mine is Bayan’s flagship asset today contributing more than 80%
    of the Group’s coal production, is one of the most competitive coal assets in                                                          Capitalization and Credit Overview
    Indonesia and globally from a scale and cost perspective (1), and is uniquely
    positioned to expand capacity rapidly with very low levels of capex intensity                                                           Share Price (IDR / share) (7)                                             14,175
•   The Group’s Reserves and Resources have been independently verified and                                                                 Shares Outstanding (mm)                                                    3,333
    certified to international 2012 JORC standards                                                                                          Market Cap (US$MM)         (7)
                                                                                                                                                                                                                       3,316
    − As of 1 January, 2021, gross Resources stand at 3.61 billion tonnes, of                                                               Net Debt/(Net Cash) (US$MM)           (5)
                                                                                                                                                                                                                       (199)
       which 1.74 billion tonnes are classified as Reserves
                                                                                                                                            Enterprise Value (US$MM)                                                   3,117
•   As an integrated coal producer, the Company has its own coal loading
    infrastructure complementing the logistical needs of Bayan’s operations                                                                                                               2018      2019      2020    1Q21(8)

                                                                                                                                            Net Debt / EBITDA(2)                          -0.1x      0.5x      0.1x    (0.4x)
                                                                                                                                                                     (2)
                                                                                                                                            Total Debt / EBITDA                            0.2x      1.0x      1.1x     0.7x
    Notes
    (1)     Per Wood Mackenzie independent industry report, showcasing Tabang total cash costs and production forecasts for 2019                  EBITDA / Net Interest Expense         755.1x     39.2x       9.8x    14.9x
    (2)     EBITDA is calculated as net income before (i) interest expense (ii) income tax benefit (expenses) (iii) depreciation & amortization and (iv) impairment charges
    (3)     Capex based on cash flow statement
    (4)     Free Cash Flow = Operating Cash Flow – Capex based on cash flow statement
    (5)     31 March 2021 results: Debt $406.3m less unrestricted cash $604.8m
    (6)     US$ 1 = IDR14,250
    (7)     Share price as at 15th June 2021
    (8)     EBITDA results based on Last Twelve Months (LTM) from 1 April 2020 until 31 March 2021 of US$545.1 million                3
ESG
The Tabang Project is in the 2nd lowest quartile of emissions as assessed by Wood MacKenzie for worldwide coal producers

ESG Activity Overview                                                               Emissions
• The Tabang project, which contributes over 80% of the Company’s
    production, has been independently estimated by Wood Mackenzie to be
    in the lower portion of the second quartile in terms of CO2 equivalent
    emissions of world coal production
•   Tabang coal also has some of the lowest levels of sulphur, nitrogen and
    ash in the world resulting in a much cleaner burn in modern ultra/super
    critical boilers thereby reducing noxious pollutants
•   The Bayan Group is currently using between 1.5 – 1.7 million barrels of                                 Tabang

    diesel fuel in its operations per annum. Of this amount, 30% is biodiesel
    sourced from sustainable palm oil products
•   Out of our total concession area of 126,293 hectares, our outstanding
    disturbed areas represent only 2.9% or 3,712 Hectares of this area
•   The Company has implemented ISO 14001 Environmental Management
    Systems at the majority of its mining operations and maintains standards
    that are over and above the prevailing regulations in this regard
•   The Bayan Group has won a number of awards for the rehabilitation of its
    former mining areas and the marshlands allocated to it under its borrow-        Environment / Rehabilitation
    use forestry permits
•   The Company has established an animal conservation centre in
    conjunction with the Indonesian government at its Tabang mine site that
    is used to rehabilitate protected species that have been rescued from
    captivity such as orangutans and Sumatran tigers

                                                                                4
ESG (continued)
The Company is the largest contributor to the remote communities near its mining operations
ESG Activity Overview Community Development Activities
• The Company and its contractors currently employ over 6,000 personnel
at its operations, many of whom are sourced from the surrounding
communities
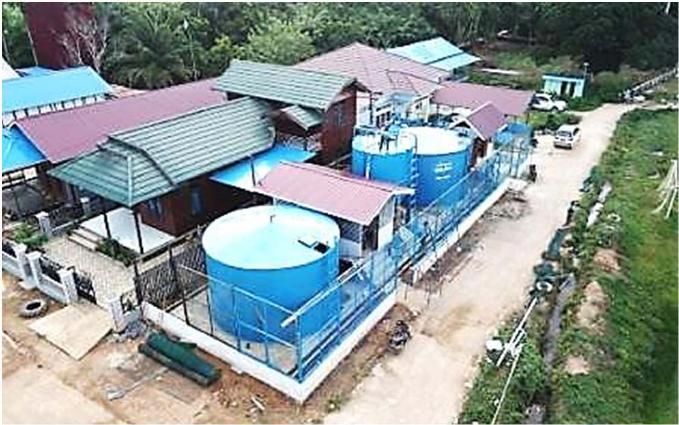
• The Company is also instrumental in providing schooling services,
scholarships, water treatment plants, electricity, business training and
opportunities and infrastructure to communities surrounding our
operations
• The Company is currently constructing a 85km public road in Kutai
Kartanegara at a cost of approximately US$22.6 million; this is one of the
largest privately-sponsored public works projects in Indonesia and will
improve access and infrastructure for the remote communities living in
the area
• The majority of the external lighting used at the Tabang camp is solar
powered and the Company has donated over 1,600 solar powered
lighting poles to the surrounding communities
• In 2020, the Company completed construction of a medical clinic at the
Tabang Project at a cost of IDR 8 billion that is used to provide free
health services to surrounding communities and mine staff
• The Group has an Emergency Response Team that has been
instrumental in assisting various disaster relief efforts throughout
Indonesia including for the Lombok earthquake and the tsunami’s that
impacted Palu, Donggala and Pantai Barat Banten in 2018 and the
Bengkulu flood and landslides in 2019. This included the contribution of
equipment, medical personnel, medicines, food and other essential
supplies
• In 2020, the Company donated funds and personal protective equipment
to various government agencies to assist in combating the COVID-19
pandemic
5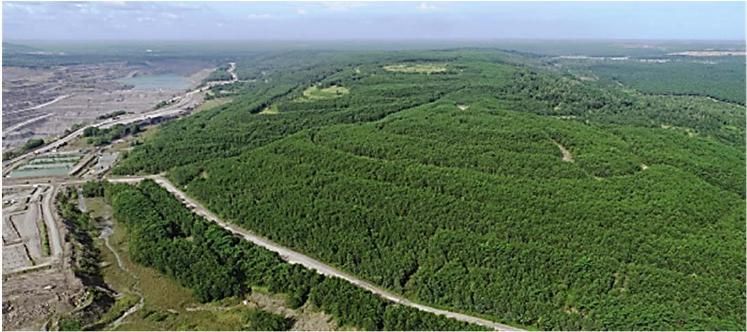
Significant Milestones
                                                                                                                                     2019: Record coal         2020: Record coal sales
    Annual Production Volume (Mt)                                            2017: Tabang Ramp-up                                    production                Bayan achieved sales of
                                                                             Achieved coal production of 21 Mt, doubled from         Expansion of the import   36.3 million tonnes
                                                                             previous year                                           jetty of BCT completed
                                                                             Tabang became the first coal mine in Indonesia
                                                                             to utilize dozer push overburden removal
                                                                             operations on a commercial scale

                                                                        2014: Tabang Start-up
                                                                        Bara Tabang achieved its first
                                                                        coal production

                                                                                                                                                                2022+: Further Expansion
                                     2008: IPO on the IDX                                                                                                       Completion of    haul    road   to
                                     Bayan went public and listed its                                                                                           Mahakam River
                                     shares on the Indonesian Stock                                                                                             Expansion to beyond 60+ million
                                     Exchange                                                                                                                   tonnes per annum

                                                                                                                        2018: Record year across all metrics
                 1997–2004: Laying the Foundation
                                                                                                                        Coal production of 28.9 Mt, EBITDA        of
                 Acquisition     of   multiple    coal                                                                  US$736.4MM, dividend of US$150MM
                 concessions and other companies,
                 including Balikpapan Coal Terminal                                                                     Reached net cash position
                                                                                                                        Consolidated interest in KRL to 100%

1997: Founding                                                                          2014 – 2016: Investing in Infrastructure to Support
Founding     shareholders                                                               Capacity Growth
acquired a   coal mining                                                                The haul road to Senyiur opened with heavy duty
concession    in     East                                                               trailer hauling commencing
Kalimantan                                                                              Completion of the second barge loader at Senyiur jetty
                                                                                        to allow for the capacity ramp up at the Tabang Project

                                                     2011: Kangaroo Acquisition
                                                     Bayan acquired 56% of the shares in Kangaroo
                                                     Resources Limited (“KRL”) and its 13 mining
                                                     concessions,  including  the   North   Pakar
                                                     Concessions

                     2004: Establishment of the Group
                     Bayan Group is established by the
                     founding shareholders
                                                                                             6
The Evolution of Bayan Resources (1/2)
Successfully developing the Tabang mine and the associated infrastructure on time and within budget has enabled Bayan to
triple its production since 2016. Growth has historically been, and will continue to be, achieved at very low levels of capex
Overview                                                                                  Coal Production and Strip Ratios
 • Bayan is committed to the development of the Tabang Concession and                      Mt                                                                           x
   associated infrastructure, repositioning itself as a low cost, low strip ratio                                            2020 production of 30.2Mt
   producer of low sulphur, low ash, sub-bituminous coal
                                                                                                     Gunungbayan                Perkasa                  Wahana
 • The commencement of mining at Bara Tabang in 2014 and subsequent
                                                                                                     Teguh                      Tabang                   Strip Ratio
   ramp-up of the Tabang concession have been instrumental in delivering                   40
   Bayan:
                                                                                                                                                 31.9
   – Production stability and tangible low capex brownfield growth with                                                                                         30.2
                                                                                                                                   28.9
         initial infrastructure development mostly completed; and                          30

   – A significant decline in average strip ratios and group cash costs,
                                                                                                                     20.9                        5.1x            4.0x
         driving EBITDA growth and some of the best EBITDA margins in the                                                          4.8x
                                                                                           20                                                    25.2
         industry                                                                                                    4.0x          22.7                          24.4

 • Any brownfield production growth at Tabang mine will be supported by                             3.4x
                                                                                                                     15.6
                                                                                                    9.7
   internally generated cash flow, and remains discretionary assuming coal                 10
   prices going forward are supportive, giving Bayan the flexibility to                              6.1
                                                                                                                                   3.5            3.4            3.2
   manage its growth                                                                                 2.0
                                                                                                                      3.0
                                                                                                                                   1.1            1.5
                                                                                                                      1.1                                        1.4
                                                                                                     1.1     0.5      1.2          1.2     0.4    1.3    0.4     1.2
 • This has been achieved despite the external challenges posed by coal                         0
                                                                                                    2016             2017         2018           2019           2020
   price uncertainty and volatility
                                                                                    Coal Sale Specifications   (1)

                                                                                    Calorific
                                                                                    Value
                                                                                                     4,843           4,706         4,689         4,712          4,623
                                                                                    (kcal/kg
                                                                                    GAR)

   Note
   (1)     Based on a weighted average of coal sold
                                                                                    7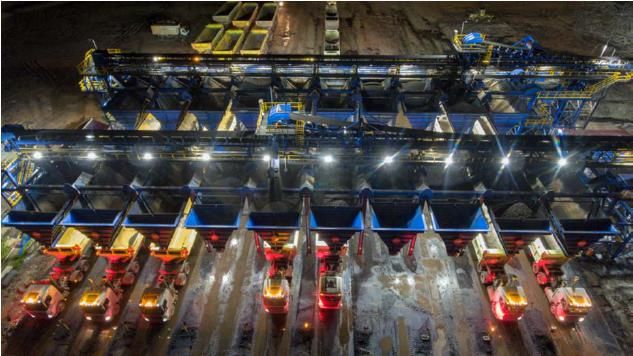
The Evolution of Bayan Resources (2/2)
Remained profitable, as well as operating and free cash flow positive despite the coal price lows, and being in the midst
of the Tabang development
Cash Margins (1)                                                                                                                         EBITDA and Margins
US$/t                                                                                                                                    US$MM

120                                  101.9                                                                                               800                                   736.4
              88.6                                                                                       88.9                            700             485.1
 90                                                        77.8                                                                          600
                                     58.5                                         60.7                                                   500
                                                           47.2                                                                                                                               374.4         356.7
 60                                                                                                      47.3                            400
        52.1                                                                      38.4                                                                                                                               254.8
                                                                                                                                         300
                                                                                                                                                          45.4%                43.9%
 30                                                                                                                                      200
                                     33.3                  34.8                                                                          100                                                  26.9%         25.6%    50.9%
              29.0                                                                28.8                   23.3
  0                                                                                                                                        0
              2017                  2018                   2019                   2020                  1Q21                                             2017                   2018          2019          2020     1Q21
          Newcastle                    ASP                 Cash Costs                                                                                                                EBITDA          EBITDA Margin

Operating Cash Flow (“OCF”)                                                                                                              Free Cash Flow (OCF – Cash Flow Based Capex)
US$MM                                                                                                                                   US$MM

600                                 571.9                                                                                                 600
                                                                                                                                                                                494.5
500          431.9                                                                                                                        500
                                                                                 361.0                                                                    395.9
400                                                                                                                                       400
                                                                                                        249.2                                                                                               273.3
300                                                                                                                                       300                                                                        216.1
200                                                                                                                                       200
100                                                        49.5                                                                           100                                                 -10.0
  0                                                                                                                                         0
              2017                  2018                   2019                   2020                  1Q21                             -100              2017                  2018         2019          2020     1Q21

   Note
   (1) As the production from Bara Tabang continues to increase, the Group ASP has recorded higher discount to the Newcastle benchmark; However, given the low cost profile of the
   Tabang concession, the Group margin has expanded
                                                                                                                              8
Overview of Key Mining Assets
Bayan owns and operates four key developed coal projects with associated infrastructure located in East and South Kalimantan
1 Tabang Concession (including
North Pakar) (5)
Location East Kalimantan
Mine Life (3) 61 years Perkasa Inakakerta (“PIK”)
4
90% FSP and BT; East
Bayan Ownership (6) Location East Kalimantan
100% for all other Kalimantan
Current Mining Method Open pit / dozer push Mamahak Mine Life (3) 16.8 years
1 Senyiur Bayan Ownership 100%
Gross Reserves 1,475 Mt
Gunung Jetty 4
Calorific Value (4) 4,127 kcal/kg GAR Sari Jetty Current Mining Method Open pit
Pakar
2020/2019 Production 24.4 Mt / 25.2 Mt Project Gross Reserves 19.5 Mt
LOM Strip Ratio 3.8x Calorific Value (4) 4,520 kcal/kg GAR
Samarinda
2 2020/2019 Production 1.2 Mt / 1.3 Mt
Indonesia
5 LOM Strip Ratio 8.2x
KFT-1 (2)
Balikpapan KFT-2 (2)
BCT (1)
1Q21 Production Contribution
2 Teguh Sinarabadi (“TSA”) / Firman
Ketaun Perkasa (“FKP”) TSA / WBM PIK
South 4% 3%
Location East Kalimantan Kalimantan FKP
Mine Life (3) 3.0 years 10%
Bayan Ownership 100% Banjarmasin 3
Current Mining Method Open pit
Gross Reserves 9.6 Mt
3 Wahana Baratama Mining (“WBM”) 5 Gunungbayan Pratamacoal (“GBP”) (7)
Calorific Value (4) 5,877 kcal/kg GAR
2020/2019 Production 3.2 Mt / 3.4 Mt Location South Kalimantan Location East Kalimantan
LOM Strip Ratio 13.8x Mine Life (3) 9.0 years Mine Life Block 2 completed in 2019 Tabang
Bayan Ownership 100% Bayan Ownership 95% 83%
Non-mining assets Current Mining Method Open pit Current Mining Method Open pit
Gross Reserves 12.1 Mt Gross Reserves Block 2 depleted 1Q21
Undeveloped coal assets (6)
Calorific Value(4) 6,760 kcal/kg GAR Calorific Value 6,454 kcal/kg GAR Production: 9.0 Mt
Suspended assets
2020/2019 Production 1.4 Mt / 1.5 Mt 2019 Production 0.4 Mt
Notes
(1) BCT refers to Balikpapan Coal Terminal
LOM Strip Ratio 13.1x 2019 Strip Ratio 14.1x
(2) KFT are our floating transfer barges
(3) Based on our remaining reserves divided by our coal production volume in 2020
(4) Calorific values are based on reserve only
(5) Includes BT, FSP and North Pakar Concessions
(6) North Pakar is held through Bayan’s 100% holding in Kangaroo Resources Ltd
(7) Based on internal estimates 9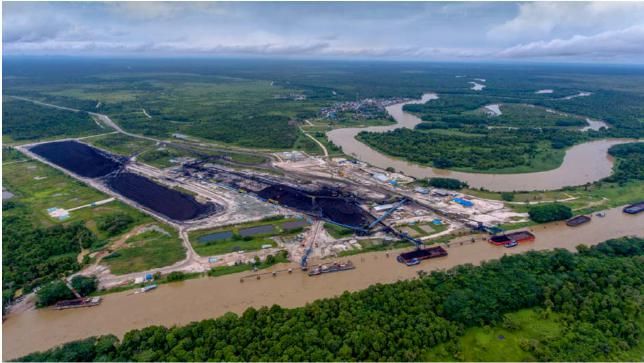
Reserves and Resources
Large reserve base, favourable IUP licensing and long remaining reserve life provides a solid growth outlook
PT. BAYAN RESOURCES TBK & SUBSIDIARIES JORC (2012) Reserves6 Mineable Pit @ $80/t (@ 6,322 GAR) used for JORC Reserves3 JORC (2012) Resources
JORC RESERVES AND RESOURCES Area Size Proved Probable Total CV TM IM Ash Total RD Quantity Stripping CV TM Ash Total Measured Indicated Inferred Total CV TM IM Ash Total RD
As at 1st January 2021 Project (Hectare) Million Tonnes Kcal/kg % % % Sulphur gr/cc Million Ratio Kcal/kg % % Sulphur Million Tonnes Kcal/kg % % % Sulphur gr/cc
GAR (ar) (adb) (adb) % (insitu) Tonnes BCM/t GAR (ar) (adb) % GAR (ar) (adb) (adb) % (insitu)
(adb) (adb) (adb)
Tabang / North Pakar Project
PT. Fajar Sakti Prima5 Tabang 3,775 82 111 193 4,340 32.7% 22.8% 5.9% 0.11% 1.28 201 5.7 4,340 32.6% 5.9% 0.12% 111 201 6 317 4,370 32.8% 21.8% 5.4% 0.12% 1.27
PT. Bara Tabang5 3,015 228 64 292 4,270 34.3% 24.3% 3.3% 0.11% 1.27 297 2.4 4,260 34.1% 3.6% 0.11% 242 78 8 328 4,275 34.3% 24.0% 3.3% 0.11% 1.27
PT. Tiwa Abadi5 4,996 286 197 483 4,180 34.5% 23.0% 4.6% 0.11% 1.28 602 4.2 4,150 34.8% 4.7% 0.11% 377 289 294 959 4,150 34.6% 22.7% 4.9% 0.11% 1.29
North
PT. Tanur Jaya5 5,000 275 115 390 3,990 37.5% 20.0% 4.9% 0.10% 1.28 447 3.7 4,000 37.4% 4.8% 0.10% 302 157 215 674 4,000 37.5% 20.2% 4.8% 0.11% 1.26
5
Pakar
PT. Dermaga Energi 3,784 80 37 117 3,680 42.8% 18.5% 5.2% 0.13% 1.28 172 2.8 3,710 42.1% 5.4% 0.13% 82 55 76 213 3,705 42.2% 18.4% 5.5% 0.13% 1.22
Total 20,570 951 524 1,475 4,129 35.7% 22.1% 4.6% 0.11% 1.28 1,719 3.8 4,110 35.9% 4.8% 0.11% 1,114 779 599 2,491 4,116 35.8% 21.7% 4.8% 0.11% 1.27
BAS & South Pakar
PT. Brian Anjat Sentosa1 BAS 4,025 - 5 5 3,520 42.6% 28.7% 7.7% 0.16% 1.24 5 4.1 3,520 42.6% 7.7% 0.20% - 18 19 37 3,850 40.3% 28.7% 4.8% 0.14% 1.24
PT. Orkida Makmur 1,061
1
PT. Sumber Api 2,364 - 5 5 3,130 46.5% 14.4% 7.1% 0.21% 1.22 5 2.6 3,150 46.5% 7.2% 0.21% - 12 9 21 3,200 46.3% 13.4% 6.3% 0.22% 1.22
PT. Cahaya Alam1 South 3,457 - 65 65 2,930 50.1% 13.5% 7.2% 0.19% 1.22 78 2.0 2,940 50.5% 7.3% 0.19% - 112 75 187 3,135 48.0% 13.3% 5.9% 0.22% 1.21
PT. Bara Sejati1 Pakar 2,981 - 147 147 2,980 50.0% 13.5% 6.8% 0.18% 1.22 156 2.0 2,980 50.0% 6.9% 0.18% - 193 45 238 3,030 49.7% 13.2% 6.0% 0.19% 1.20
PT. Apira Utama 1,714
PT. Silau Kencana 4,774
Total 20,376 - 222 222 2,981 49.8% 13.9% 6.9% 0.18% 1.22 244 2.1 2,982 49.9% 7.1% 0 - 335 148 483 3,141 48.2% 14.4% 5.9% 0 1.21
Other Mines
PT. Perkasa Inakakerta1 PIK 19,050 11 8 19 4,480 31.4% 19.4% 4.5% 1.53% 1.27 19 8.2 4,520 31.7% 4.6% 1.56% 23 81 22 126 4,475 33.1% 18.8% 4.1% 1.47% 1.27
PT. Wahana Baratama Mining (Open Pit)1 6 6 12 6,760 7.2% 4.9% 9.9% 0.60% 1.31 12 13.1 6,760 7.2% 9.9% 0.60% 47 41 3 91 6,590 7.1% 4.8% 8.9% 0.64% 1.31
2
PT. Wahana Baratama Mining (Open Pit) WBM 7,811 -
PT. Wahana Baratama Mining (Underground)4 - - - - - - - - - - - - 0.0% 0.0% 0.00% 43 125 62 230 6,809 6.1% 4.4% 9.4% 0.60% 1.33
1
PT. Teguh Sinarabadi 3,505 3 0 4 5,890 15.4% 12.6% 5.3% 0.96% 1.29 4 14.5 5,644 16.3% 5.3% 1.00% 22 43 8 73 6,070 15.7% 12.5% 4.8% 0.97% 1.30
1
TSA/FKP
PT. Firman Ketaun Perkasa 2,490 1 5 6 5,870 15.3% 12.7% 5.1% 0.96% 1.27 8 13.4 5,623 16.3% 5.2% 1.00% 23 59 17 99 5,900 17.0% 14.0% 4.7% 0.91% 1.30
PT. Firman Ketaun Perkasa - West Block FKP West 10,220
PT. Gunungbayan Pratamacoal Block I 8,365
GBP
PT. Gunungbayan Pratamacoal Block II 11,910
PT. Mamahak Coal Mining2 4,996 2 8 4 14 7,080 4.8% 2.0% 11.6% 1.62% 1.33
PT. Mahakam Bara Energi 5,000
Mamahak
PT. Mahakam Energi Lestari 5,000
PT. Bara Karsa Lestari 7,000
Total 85,347 22 19 41 5,476 20.5% 13.6% 6.2% 1.12% 1.28 44 11.1 5,448 20.7% 6.2% 1.14% 160 357 116 634 6,090 14.4% 9.7% 7.0% 0.89% 1.31
Grand Total 126,293 973 765 1,738 4,014 37.1% 20.8% 5.0% 0.14% 1.27 2,007 3.8 4,002 37.3% 5.1% 0.14% 1,274 1,471 863 3,608 4,332 33.7% 18.6% 5.3% 0.26% 1.27
Notes:
1
Reserves and Resources statement as prepared by PT. RungePincockMinarco ("RPM") to JORC (2012) standard as at 1 January 2019, long-term coal price used US$80.0 per tonne (6,322 Kcal/kg GAR). Resources are inclusive of Reserves. 2019 and 2020 Actual Production has been deducted from Proved Reserves and Measured Resources to determine
position as at 1 January 2021.
2
Statement of Open Cut Coal Resources as prepared by PT. New Resource Mine Consulting to JORC (2012) Standard as at 28 February 2015. There has been no mining on this concession since this date.
3
Mineable Pit quantities and stripping ratio are based on practical pit shell and not reserves
4
Wahana Underground Resources statement as prepared by SRK Consulting China Ltd. ("SRK") to JORC 2012 standard as at 30 September 2019.
5
Reserves and Resources statement as prepared by PT. RungePincockMinarco ("RPM") to JORC (2012) standard as at 1 January 2021, long-term coal price used US$80.0 per tonne (6,322 Kcal/kg GAR). Resources are inclusive of Reserves.
6
RPM advise that the difference between Mineable Pit quantities and Total Coal Reserves is the inclusion of Inferred category of Coal Resource. In the Total Coal Reserve estimate, Inferred Resources have been treated as waste and therefore assigned the full value of waste costs and no revenue.
7
Please refer to the Statement of Coal Resources and Statement of Coal Reserves (as at 1 January 2021) that provide more detail on the Resources and Reserves, and which include full copies of the Table 1 Reports per JORC (2012). This information can be accessed through the following hyperlink: CLICK HERE
10Key Infrastructure (1/5)
Bayan’s key vessel loading infrastructure has been the cornerstone of the Group’s growth strategy. The majority of the
development in recent years has been focused on expansion of the Senyiur Jetty to support the Tabang mine ramp-up
Key Assets Overview
One of the largest coal terminals in Indonesia; handled
more than 217 Mt of coal and loaded more than 3,864
vessels since 1995, supporting Tabang and TSA/FKP
2 x Shiploaders rated at 4,000 tph each
Current handling throughput capacity of 24.0 Mtpa
Land-
Balikpapan expanding to 40 Mtpa+ with the addition of a new out
based
Coal Terminal loading jetty, shiploader(s) and in loading capacity.
Coal Stockpile capacity of c. 1.0 Mt (across 14 stockpiles),
(“BCT”)
Terminal further expansion being completed in 2021 to c. 1.5Mt
Can fully load large Panamax vessels and partially load
Capesize vessels
Managed by Dermaga Perkasapratama, 87.4% owned by
Bayan
KFT-1 and KFT-2 currently both support Tabang coal
mining operations and are located offshore Balikpapan.
KFT-1 is able to unload / shipload 4,000 tph and has
Kalimantan
2x stockpiling capacity of 45 kt
Floating
Floating KFT-2 is able to unload / shipload 6,000 tph and has
Transfer
Transfer stockpiling capacity of 60 kt
facility
facilities Either can be moved to take advantage of location and
(“KFT”) avoid bad weather and can be positioned to load
Capesize vessels
Managed by Muji Lines / Bara Tabang
11Key Infrastructure (2/5)
The majority of the development in recent years has been focused on expansion of the Senyiur facility
Key Assets Overview
Senyiur Jetty supports the Tabang coal mining operation.
The facility has a combined capacity of 12,000 tph with 3
barge loaders and has stockpiling capacity of 1,000 kt
Has 7,000 tph crushing capacity, equivalent to 25 Mtpa
Located on the Kedang Kepala River. Connected by a 69
Barge km long coal haul road
Senyiur
Loading Has the ability to load barges (up to 300 ft; 7,500 Mt)
Jetty
Facilities Most of the year, barges directly go to BCT (368 km);
Only part of the year requires transhipment - barges travel
to the Mahakam river (94 km) where transhipment
facilities load coal to larger barges and on to the BCT (274
km) / KFT-1 / KFT-2 (256 km)
Managed and 100% owned by Bayan
Gunung Sari Jetty supports Tabang coal mining
operation. The facility has crushing capacity of 2,000 tph,
stockpiling capacity of 700 kt is able to load barges at
2,000 tph
Located on the Belayan River and approximately 24 km
Barge
Gunung from mine site by haul road
Loading
Sari Jetty Has the ability to load barges up to 230 ft (approx. 3,000
Facilities Mt)
Barges travel to the Mahakam river (181 km) where
transhipment facilities load coal to larger barges (300 ft;
7,500 Mt) and on to the BCT (288 km)
Managed by Indonesia Pratama, 100% owned by Bayan
12Key Infrastructure (3/5)
The Tabang infrastructure has been designed to allow flexibility and build in redundancy
Key Assets Overview
Coal mined is trucked to the Intermediate Crushing
Facility or ROM Pads located 2 – 7 km from mine
Coal is stockpiled, crushed (in the case of the ICF and
ROM pad 2) and reloaded onto: (1) 75 ton trucks and
transported to barge loading facility at Gunung Sari Jetty,
Intermediate Interme-
or (2) between 200 to 220 tonne trucks and transported to
Crushing diate barge loading facility at Senyiur Jetty
Facility / Coal Crushing ICF: 2,000 tph crushing capacity, stockpile capacity of 650
Facility / kt for ROM and 700 kt crushed coal
Pads Coal Pads Coal pad 2: ROM coal stockpile capacity of 550 kt; 2 x
1,500 mt/hr screening and crushing lines and 10x Truck
Loading hoppers
Coal pad 3: stockpile capacity of 200 kt;
The Company operates 3 barge transhipment facilities
(combined 3,750 tph) at the confluence points of the
Barge
Barge Mahakam and the Belayan / Kedang Kepala Rivers
Tran-
Transhipment Total capacity of approximately 15 million tonnes per
shipment annum
Facilities
Facilities These facilities are used to tranship coal from smaller
barges to larger barges or top up partially loaded barges
13Key Infrastructure (4/5)
Bayan is currently constructing a new coal haul road and barge loading facility to facilitate the next level of expansion
Key Assets Overview
In December 2019, the Company commenced
construction of a 101km all-weather coal hauling road
which will link the Tabang mine directly to the Mahakam
River
Coal Haul Road
The road will be paralleled for the majority of this distance
to Mahakam
Coal Haul by a public road that the Company is also constructing
River
Road The hauling road will have 7 bridges and over 150
(Under culverts
Construction) The Company plans to utilise 200-220 mt payload double
trailers along this road to optimise its coal production
The road is scheduled to be completed in 2022
The Company has commenced construction of the barge
loading facility on the Mahakam River
In the initial phase this will have 3 x 4,000 tph barge
loaders
The facility will also initially have 3 x Side Dump for the
Mahakam River receiving of coal trucks that will have 2 x 2000tph crushing
Barge
Barge Loading capacity each
Loading
Facilities (Under There will also be 3 x 4,000 tph 5km overland conveyors
Facilities linking the side dumps to the barge loaders
Construction)
This barge loading facility will be used to load 300’ barges
with 7,500 – 8,000 MT
The facility will also include other supporting infrastructure
including a camp, mess, workshops, fuel receiving jetty
and fuel tanks
14Key Infrastructure (5/5)
Established and Company owned infrastructure supporting sustainable operations going forward
Key Assets Overview
TSA Jetty supports TSA / FKP coal mining operation. The
facility is able to barge load 2,000 tph and has stockpiling
capacity of 100 kt ROM, 120 kt crushed coal and 1 x
Barge 1,000 tph screening and crushing facility
TSA Located on the Mahakam River and approximately 20 –
Loading
Jetty 25 km from mine site by haul road
Facilities
Has the ability to load barges (up to 300 ft; 7,500Mt)
Barging down the Mahakam River to BCT 463 km
100% owned and managed by Bayan
WBM Jetty supports WBM and 3rd party coal mining
operations. The facility is able to barge load 3,000 tph and
has stockpiling capacity of 360 kt
Coal processing plant – 520 kt crushed coal and 2 x 500
Barge tph crushing
WBM
Loading Approximately 21 – 30 km from mine site by haul road
Jetty
Facilities Has the ability to load barges (up to 300 ft; 7,500Mt)
Barging to offshore transhipment point for loading ~ 20
km
100% owned and managed by Bayan
PIK Jetty supports PIK coal mining operation. The facility
is able to shipload 4,000 tph and has stockpiling capacity
of 360 ROM, 260 kt crushed coal and 2 x 500 tph
Ship screening and crushing lines
PIK Coal haulage from mining location to the Jetty of 15 – 20
Loading
Jetty km
Facilities
Has the ability to load Handy / Panamax vessels
100% owned and managed by Bayan
15Industry Positioning
A key player in the Indonesia coal landscape
Remaining Reserves (2020) Remaining Mine Life (2020)(1)
MT Years
3,500 3,180 150 128.2
3,000 2,605
2,500
1,738 100
2,000
57.5
1,500 1,074 1,033
1,000 50 32.0 30.8
498 312 19.7 17.0 15.1
500
0 0
PTBA Bumi Bayan Adaro Golden Kideco ITMG PTBA Bayan Bumi Golden Adaro ITMG Kideco
Energy Energy
Source: Wood Mackenzie, Company Data Source: Company Filings, Company Data, Wood Mackenzie
2020 Strip Ratio 2020 Production
x MT
15 100
81.1
10.1 80
10 7.7 54.5
60
5.7 33.5 33.0
3.8 4.0 4.0 4.4 40 30.2 24.8
5 18.4
2.4
20
0 0
Tabang Adaro Bayan Golden PTBA Kideco BUMI ITMG Bumi Adaro Golden Kideco Bayan PTBA ITMG
Energy Energy
Source: Company Filings, Company Data Source: Company Filings, Company Data
Note
(1) Remaining Mine Life is calculated as Remaining Reserves divided by 2020 Production
16Industry Positioning (continued)
Some of the highest margins amongst our peers
2020 EBITDA 2020 EBITDA Margin
US$mm %
1,000 883.0 40 34.8
800
598.8 30 25.6 25.3
600
356.7 20 16.3 15.8
400 300.6 13.9 12.9
187.0 160.7 148.0 10
200
0 0
Adaro Bumi Bayan PTBA ITMG Kideco Golden Adaro Bayan PTBA Bumi ITMG Golden Kideco
Energy Energy
Source: Company Filings, Company Data Source: Company Filings, Company Data
2020 Net Profit 2020 Net Profit Margin
US$mm %
400 344.5 30 24.7
300
200 165.2 158.5 20
95.9 75.4 13.9
100 37.8 9.0
0 10 6.3 6.0
3.2
-100 Bayan PTBA Adaro Golden Kideco ITMG Bumi
Energy 0
-200 Bayan PTBA Golden Adaro Kideco ITMG Bumi
-300 -10 Energy
(293.9) (8.0)
-400
Source: Company Filings, EBITDA estimated using Company Data Source: Company Filings, Company Data
17Section 2: Key Highlights
Key Investment Highlights

                Owner and Operator of the Sizeable Tabang Mine, One of the Most
           1
                Competitive Coal Mines in Indonesia and Globally

                 2           Strong Domestic and Regional Demand Dynamics for Indonesian Coal

                                Established and Integrated Owned Mining Infrastructure Allows for Low
                     3
                                Cost, Organic Capacity Expansion

                                 Sustainable Platform with Incremental Brownfield Growth Opportunities
                         4
                                 with Minimal Capital Expenditure Required

                                Strong Relationships With a Geographically Diversified Portfolio of High-
                     5
                                Quality Customers

                         Sustainable and Attractive Dividend Payout Enabled by Robust Balance
                 6
                         Sheet and Strong Free Cash Flow Generation

               Strong Management Team Backed by Robust Corporate Governance
       7
               Policies and Supported by Reputable Shareholders

                                                     19
Owner and Operator of the Sizeable Tabang Mine, One of
1
the Most Competitive Coal Mines in Indonesia and Globally
Sizeable reserve base, established infrastructure, an “in demand” coal product, and a cost structure delivering consistently
strong margins. All operating licenses issued pursuant to the current regulatory regime, hence no license conversion risk(1)
Sizeable Reserve Base as of beginning of 2021 Bottom Quartile Global Cost Competitive Positioning (3)
Total Cash Cost – energy adjusted @ 6,322 kcal/kg (US$/t) – 2019
Reserves (Mt) Resources (Mt) IUP Term
BT Q1 Q2 Q3 Q4
FSP
BT 292 328 By 2028 (1)
North Pakar FSP 193 317 By 2035 (1) Tabang
TA (2) 483 959 By 2038 (1)
TJ (2) 390 674 By 2040 (1)
DE (2) 117 213 Exploration stage
In Demand Low-ash, Low-sulfur Product Seaborne Export Supply (Mt)
kcal/kg GAR Ash Sulphur Nitrogen
Australia Indonesia Tabang RoW
Bayan Ultra Coal (BUC) 4,000 – 4,250 ~3% typical 0.1%Owner and Operator of the Sizeable Tabang Mine, one of
1
the Most Competitive Coal Mines in Indonesia and Globally
Consistently driving down costs through management initiatives. Bayan does not own the trucks or mining equipment, hence
capital costs pertaining to equipment maintenance / replacement are borne by third-party independent mining contractors
Management Initiatives Keeping Costs Use of more efficient mining techniques, such as employing the use of geotechnical radars, dozer push
Structurally Low mining methods, and optimized road haulage of coal
Constant dialogue and
interaction with third-
party contractors
Centralized Fuel
Purchasing
Dozer Push Mining
Method
GeoTechnical Radars
Optimized Road
Haulage
212 Strong Demand Dynamics for Indonesian Coal
Domestic
Indonesia's consumption of domestic coal for power generation will continue to grow, driven by increasing electrification
to meet power demand from the growing population and government policy that favours coal-fired power generation
Electricity Consumption per Capita Electricity Capacity and Demand
MWh per Capita GW, TWh
15 452
11.0 10.9 10.1 300 386 418 510
8.7 328 357
10 7.6 275 304
6.0 200 235 253 340
4.9 4.3 110 117 128
5 2.7 88 97 104
1.6 100 63 82 170
1.0 0.8 0.5 0.3 0.2 58 42 50 55 62 74
3 8 27 34
0 55 55 55 55 55 55 55 55 55
South Brunei Japan Malaysia Thailand Indonesia Pakistan Myanmar 0 0
2017 2018 2019 2020 2021 2022 2023 2024 2025
Korea
Taiwan Singapore Hong China Vietnam Philippines Cambodia Existing Capacity (GW) Additional Capacity (GW)
Kong Electricity Demand (TWh)
Today, Indonesia uses less electricity per capita compared to Growing population, rising income per capita and a low electrification
developed countries ratio are expected to drive significant growth in electricity demand
Indonesian Electricity Generation Dominated by Coal Coal to Continue Accounting for over 50% of Fuel Type
TWh Fuel Type Projection in the Electricity Sector 2017–2025
600
Geothermal Hydro Others Hydro Others
5.8% 5.8% 0.6% 10.9% 2.0%
400 Geothermal
Oil
9.6%
8.5%
200 Oil
Other Gas 2.0% Coal
17.7%
2017 Coal 2025 50.5%
0 53.6% Other Gas
2017 2018 2019 2020 2021 2022 2023 2024 2025 17.0%
Coal Gas (Including LNG) Oil Geothermal Hydro Other renewables Import LNG
8.0% LNG
8.0%
Coal accounts for over 50% of the energy share in Indonesia
Source: Wood Mackenzie, broker research
222 Strong Demand Dynamics for Indonesian Coal
Regional
Indonesian coal is well placed to serve the growing regional markets, particularly in SEA and India. Its low-sulfur and low-
ash content also makes it highly sought after by power generators that need to meet mandated emission standards
Indonesia has Proximity to Key Regional Import Markets Indonesian Coal has Lowest Impurity Content Globally
Ash (%) Total Sulphur (%)
30% 1.32% 0.68% 2%
0.70% 0.51%
0.67% 0.30% 0.39% 17.8%
South 0.13% 0.47% 0.40% 15.2%
11.1% 11.6% 13.0%
China Korea Japan 15% 8.9% 9.6% 1%
5.0% 6.0%
3.5%
Hong KongTaiwan 0% 0%
India Tabang Indonesia ICI4 Colombia United Canada Russia FOB Australia South
Thailand Vietnam Philippines mine 4200 States Newcastle Africa
Malaysia Ash Total Sulfur
Growing Regional Markets in SEA and India
Indonesia
Global Seaborne Thermal Coal Import Demand 2017-2025E CAGR (%)
12 7.3
3.1
One of the Lowest Cost Producing Markets Globally 6 0.2
0
Average Cost of Coal Production (US$/t) (1) (6) (1.2)
(12) (7.1)
67 78 China Rest of World JKT (2) India SEA
80 62 66
58 60
49
60
32
Coal Fired Power Stations Build in Regional Markets
40
20 # of Stations
0 90
47
45 50
27 3
41 19 16 1
20 9 4 9 4 2
0
India Indonesia Vietnam Bangladesh Philippines Thailand Cambodia Myanmar
Source: Wood Mackenzie, Global Coal Plant Tracker
Construction Announced + Pre-permit + Permitted
Notes
(1) As of 2019, on energy adjusted basis, according to Wood Mackenzie independently derived seaborne coal cash cost curve.
(2) Japan, South Korea, Taiwan.
23Established and Integrated Owned Infrastructure Allows
3
for Low Cost, Organic Capacity Expansion
Tabang infrastructure is complete, with discretionary low capex brownfield growth available if the environment is supportive
Direct
69 km BCT: 368km Capacity (Mtpa)
Haul road
Barging
Tabang Barging BCT: 274 km 60+
Senyiur Jetty
Mine 94 km KFT-1 / 2: 256 km
BCT
Transshipment
KFT-1 30+
102 km KFT-2
Barging Barging
Haul road (1)
181 km BCT: 288 km
Gunung Sari Jetty Transshipment
Mahakam River
Port Facilities at Today Upside
Muara Pahu Barging
Established mine to port infrastructure owned by Bayan. Haul trucks and barges owned / operated by trusted third party contractors
Capacity (Mtpa)
20 – 25 km Barging 40+
Haul road 463 km 24
Teguh Teguh (TSA)
BCT
mine Jetty
Today Upside
8-10
21 – 30 km Barging
Wahana Haul road Wahana (WBM) 20 km
Floating crane
mine Jetty
Today
8-10
15 – 20 km
Perkasa Haul road Perkasa (PIK) Direct shiploading to Handy / Panamax Vessels
mine Jetty
Today
Notes
(1) Bayan is in the process of permitting and designing a haul road from the Tabang mine direct to the Mahakam River, which would allow Bayan to minimize its reliance on the seasonal rivers served by the Senyiur and
Gunung Sari Jetties, to barge our coal from the Tabang mine to BCT or floating transfer barges. Road construction is expected to complete in 2022.
(2) Public haul road to Gunung Sari Jetty.
244
Sustainable Platform with Incremental Brownfield Growth
Opportunities with Minimal Capital Expenditure Required
Bayan has the ability to exploit a number of brownfield opportunities at the North Pakar Concessions, and capitalize on
existing infrastructure, thus substantially reducing ancillary development and operating costs.
Further Growth Strategy Capex Intensity by Country (1)
Asphalting of the Senyiur coal haul road commenced in 2017 and has US$/t
Tabang Capacity Growth
been completed in 1Q 2021 250
60+
New coal haul road to the Mahakam River commenced construction in
218
December 2019 with scheduled completion in 2022 30+
207
New barge loading facility being built directly on the Mahakam River 200
Upgrading of inloading and export jetty at Balikpapan Coal Terminal Today Upside
175
completed in 2020 with current 24mtpa of capacity 159 161
…Unlocking tangible capacity upside
Further upgrade of stockpiling capacity at Balikpapan Coal Terminal 150
at ~US$11/ton (2)
which will be complete in 2021 130
Budgeted capital expenditure of approximately US$407MM between 110
2020 – 2023, of which US$321MM will be on expansion to produce and 96 98
handle an additional 30+ mtpa of capacity and US$86MM on sustaining 100
85
and maintenance
71
65
Includes the newly planned expansion of Balikpapan Coal Terminal to
include a second shiploading berth and additional unloading cranes, 50
50
currently anticipated to be completed by end of 2023
23
11 13
0
Source: Wood Mackenzie
Notes
(1) Capex intensity by country based on Wood Mackenzie calculations, based on 2012 real dollars.
(2) Tabang capex intensity based on Company calculations using US$320MM growth capex divided by the estimated incremental 30 Mtpa
production / sales capacity that the capital investment would provide.
25Strong Relationships with a Geographically Diversified
5
Portfolio of High-Quality Customers
High Quality Customer Base and Attractive Payment Term Key Sales Contracts
Long-term relationship with strategic long term end users in proximate jurisdictions
Major Customers(3) Shareholders
As of 31 March 2021, approximately 280Mt of total contracted sales volume from Nghison • KEPCO, Marubeni
2021 onwards the majority of which are in the 4,000 – 4,400 Kcal/kg range to • One Energy Ventures, Vietnam Electricity Group , Pacific
support the future growth of Tabang (1) V-TEC Group Corp
GN Power Kauswagan • AC Energy (Ayala Corp)
Sophisticated pricing strategy; agreed price contracts which are index linked to
reference benchmark; approximately 80% of contracted volume is linked to FOB • AC Energy (Ayala Corp), Power Partners, Aboitiz Power
GN Power Dinginin Corporation
Newcastle
VAPCO • China Light and Power, Mitsubishi
All export sales backed by letter of credit TNBF • Tenaga
80%-90% of Non-PLN Domestic sales are typically prepaid before coal is loaded (2) Sembcorp Energy • Sembcorp
Cirebon • Chubu, Marubeni, KEPCO, Samtan, Indika
No bad payment history with invoice paid within 30 business days
Our Coal is Well Suited to Customer and Market Needs Sales by Geographic Region 1Q21 (by volume)
Number of customers is expected to increase as we build new long term strategic
Malaysia
offtake relationships in frontier markets
10%
Being a long term IUP holder underpinned by a large reserve and resource base, Other
Bayan is able to meet its customer’s long-term coal supply needs Philippines
10%
24%
Bayan is well positioned to capitalize on increasing domestic and regional coal
fired capacity India
8%
Indonesian customers are expected to increase demand for Bayan coal given
design coal for Indonesian plants are aligned with coal specifications of the
Tabang mine
Indonesia
9%
China
22% South
Notes Korea
(1) Contracted volumes agreed in principle, certain long-term offtake agreements are pending finalization / signing.
(2) PLN does not prepay for coal sales prior to loading, typically paying within 60 business days. 17%
(3) Some of these major customers have contracted volumes but have not yet commenced offtake
26Sustainable and Attractive Dividend Payout Enabled by
6
Robust Balance Sheet and Strong Cash Flow Generation
We intend to focus on generating healthy operating cash flows and maintaining balance sheet strength while also returning
capital to shareholders
• Bayan distributed dividends of US$150.0MM in 2018, US$300.0MM in 2019, US$66.6MM in 2020 and US$300.0MM in 2021
• Current dividend policy is to distribute up to 60% of annual distributable profit, taking into consideration:
Dividend Policy
− Prevailing market conditions and business operational outlook
− Working capital requirements, future development capital requirements
EBITDA and Net Income Operating and Free Cash Flow
US$MM US$MM
800 736.4
750
571.9
600 485.1 524.3 431.7 494.5
397.1 361.0
338.0 374.4 356.7 344.5 249.2
400 350 273.3 216.1
234.2 254.8
177.3 49.5
200 (10.0)
-50
0 2017 2018 2019 2020 1Q21
2017 2018 2019 2020 1Q21 Operating cash flow Free cash flow
EBITDA Net Income
Cash Balance (1) Leverage Ratios (2)(3)(4)
US$MM x
8
700 604.8
600 6
500 383.8 4
400 1.0x 1.1x 0.7x
300 229.2 2 0.2x 0.2x
174.5
200 58.7 0 0.5x
100 0.1x 0.1x (0.4x)
(2) (0.1x)
0
2017 2018 2019 2020 1Q21
2017 2018 2019 2020 1Q21
Total Debt / EBITDA Net Debt (Cash) / EBITDA
Notes
(1) Excludes restricted cash and cash equivalents, which are time deposits with certain banks to secure our mine reclamation obligations to the Government and other relevant Government authorities.
(2) Total debt includes short-term bank loans, long-term bank loans and finance lease payables (excluding un-amortised debt issuance costs).
(3) Net debt (cash) calculated as total debt less cash and cash equivalents (excluding restricted cash and cash equivalents).
27
(4) 1Q21 Ratios based on Last Twelve Months (LTM) EBITDA information = US$545.1 million7 Strong Management Team and Reputable Shareholders
Major Shareholders
• Dato’ Low is the founder and majority shareholder of the Bayan Group and affiliated companies
• Dato’ Low’s business interests commenced in Indonesia in 1973 when he formed PT. Jaya Sumpiles Indonesia (“JSI”) as an
earthworks, civil works and marine structure contractor. JSI quickly became a leading contractor in Indonesia in the above
fields and remained so during the 1980’s and 1990’s. In 1988, JSI ventured into contract coal mining and was a leading mining
contractor until 1998 when Dato’ Low acquired PT. Gunungbayan Pratamacoal and PT. Dermaga Perkasapratama
• His current focus shifted to the ownership and operation of coal mines in Indonesia and the related logistics activities
Dato’ Dr. Low Tuck Kwong
President Director • Under the leadership of Dato’ Low, the Bayan Group was formed through a number of strategic acquisitions in the coal sector
Korea East-West Power
Korea Southern Power
Korea South-East Power
Korea Midland Power
Korea Western Power PT Sumber Suryadaya Prima (“SSP”)
• Each holding 4% • SSP owns 10% of the Company’s shares
• These companies are owned by KEPCO, which is an integrated electric • It operates various coal fired power plants in Indonesia
utility company, generating transmitting, and distributing electricity in
Korea and internationally
• As of December 31, 2016, KEPCO had a total of 655 generation units,
including nuclear, thermal, hydroelectric, and internal combustion units
with an installed generation capacity of 79,217 megawatts
• Listed both in KRX and NYSE with market capitalization of US$15 billion
as of December 31, 2020
• AA rated by S&P and Aa2 rated by Moody’s
287 Strong Management Team and Reputable Shareholders
Board of Directors
Dato’ Dr. Low Tuck Kwong
President Director Alastair McLeod
and Chief Executive Officer Director & Chief Financial Officer
32 24 30 17
• Appointed as Director and CFO of Bayan in 2008
• Appointed as President Director of Bayan in 2018
• Previously served as Indonesia Head of Corporate Restructuring in
• Serves as President Director at various Bayan’s subsidiaries
• Awarded Honoris Causa degree by University of Notre
23+ years of KPMG
• Holds a Diploma in Accounting from Napier College, Scoltland
Dame, Dadiangas, Philippines average industry • Chartered Accountant and member of ICAS
experience
Jenny Quantero
Director of Corporate Affairs Russell Neil
and Corporate Secretary Director & Chief Development Officer
32 24 29 18
Experienced team
• Appointed as Director of Bayan in 2004 • Appointed as Director and Chief Development Officer in 2008
• Serves as Corporate Secretary of Bayan with strong local • Has more than 27 years experience in mining industry
• Holds Diploma in Foreign Languages from ABA “PRAYOGA”,
Padang, West Sumatra, Indonesia
knowledge • Holds Bachelor in Commerce (Accounting) and Arts (Asian
Studies) from Murdoch University, Australia
Lim Chai Hock Kim Hyun Kook
Director and Chief Operating Officer Director of Risk Management
Deep technical and
32 24 2 2
execution expertise • Appointed as Director of Bayan in September 2019
• Appointed as Director of Bayan in 2007
• held several key positions during his career in Korea-South-
• Previously held executive position at Bayan’s subsidiaries
• Holds a Certificate in Land Surveying from Lembaga Jabatan
East-Power Corporation (KOSEP)
• Holds double degrees in Chinese and international business
Ukur, Malaysia
from the Hankuk University of Foreign Studies, South Korea
Low Yi Ngo
Director of Sales and Marketing
16 16
• Appointed as Director of Bayan in 2007
• Holds executive positions at various Bayan’s subsidiaries
• Holds Bachelor in Mechanical and Production Engineering
from Nanyang Technological University, Singapore
Years of Industry Experience Years with Bayan Group
297 Strong Management Team and Reputable Shareholders
Board of Commissioners
Prof. Ir. Lifransyah Gumay, Prof. Dr. H.
Purnomo S.E. Ak, M.M., CA Moermahadi
Yusgiantoro Soerja Djanegara,
M.Sc., M.A., Ph.D. Commissioner S.E., M.M., Ak.,
CA., CPA., CSFA.
President
Commissioner Independent
Commissioner
• Appointed as Commissioner on 10 • Appointed as Commissioner on 10 • Appointed as Independent
January, 2018 January, 2018 Commissioner on 19 May, 2021, and
Chairman of Audit Committee and
• Minister of Defense for the Republic of • Finance Director of PT Sumber Segara Chairman of Nomination and
Indonesia (2009 – 2014) Primadaya - PLTU Cilacap (2018 – Remuneration Committee (May 2021 –
• Minister of Energy and Mineral Present) Present)
Resources for the Republic of Indonesia • Commissioner of PT Sumber Segara • President Commissioner of PT
(2000 – 2009) Primadaya - PLTU Cilacap (2009 – Pelabuhan Indonesia II (Persero) (Mar
• Chairman of the ASEAN Defense 2018) 2021 - Present)
Ministers organization (2009 – 2014) • Member of Audit Committee at PT. • The Rector of Institut Bisnis dan
• Chairman of the ASEAN Energy Bakrie & Brothers Tbk (May 2006 – Informatika Kesatuan Bogor (2021 –
Ministers organization (2000 – 2009) 2016) and member of Risk Management Present)
Committee (2016 – 2018)
• President (2004), Secretary General • Chairman of the Audit Board of the
(2002) and Governor (1995-1998) of the • Member of Audit Committee at PT. Bank Republic of Indonesia (2017 – 2019)
Organization of Petroleum Exporting Tabungan Negara (Persero) Tbk (Aug
2005 – Sept 2011) • Board Member V of the Audit Board of
Countries – OPEC the Republic of Indonesia (2014 – 2017)
• PhD in Mineral Economics from the • Expert Staff in the field of Economics for
the Democrat Party Faction of The • Board Member I of the Audit Board of the
Colorado School of Mines, Colorado, Republic of Indonesia (2009 – 2014)
USA House of Representatives of the
Republic of Indonesia (May 2008 – April • Independent Commissioner of PT Mitra
• Masters in Economics and Engineering 2010) Rajasa Tbk. (2008 – 2009)
from the Colorado School of Mines,
Colorado, USA • Magister Management with Cum Laude • Commissioner of PT Pulau Kencana
Predicate from Sekolah Tinggi Ilmu Raya (2008)
Manajemen LPMI, Jakarta, Indonesia. • PhD in Accounting Economy from
• Bachelor Degree in Economics from Universitas Padjajaran, Bandung,
Universitas Indonesia, majoring in Indonesia
Accounting. • Magister Management from Sekolah
Tinggi Ilmu Ekonomi IPWI, Jakarta,
Indonesia
30Section 3: Financial Overview
Sales and Revenue Analysis

• Bayan has successfully         Revenue                                          Sales Volumes                                      Average Selling Price (1)
  continued the ramp up of
  the Tabang Concession,         US$MM                                            Mt                                                 US$/t
  increasing production /
                                 1,750                 1,676.6                    40                                                 80
  sales     volumes,     and
  ultimately driving top line                                                                                          36.3
  growth                                                                          35
                                 1,500
                                                             1,391.6 1,395.1

                                                                                  30                            29.2                 60                 58.5
                                                                                                         28.3
                                 1,250
                                                                                                                                                 52.1
                                                 1,067.4
                                                                                  25                                                                           47.2          47.3
                                 1,000
                                                                                                  20.1                                    40.9
                                                                                  20                                                 40                               38.4

                                  750
                                                                                  15       13.0
                                         555.5
                                                                          501.0
                                  500                                                                                         10.6
                                                                                  10                                                 20

                                  250
                                                                                       5

                                    0                                                  0                                              0

  Note
  (1 ) ASP based on coal only.

                                                                                  32
Cost Analysis
• The ramp-up of the Production Cash Cost Cash Cost per ton (1)
Tabang Concessions in
between 2016 – 1Q 2021 Mt US$MM US$/t
was instrumental in driving
cash costs lower and 35 1,250 40
ensures that Bayan will 31.9
remain profitable during 30.2 34.8
the coal price lows 30 28.9 1,047 33.3
1,017 3.3
1,000 942 30.1 4.1 0.9
30 29.0 28.8
25 3.0 0.9 5.0 2.0
3.9 0.8
1.9 4.5
20.9 23.3
1.3 4.0
750
20 5.0 2.3
4.0
0.5
583 20
3.7
15
500
391
9.7 25.6
10 9.0 23.8
22.0
10 20.2 19.8
247 16.9
250
5
0 0 0
Production Selling
Note G&A Royalty
(1 ) Based on sales volume
33Profitability and Profit Margins
Gross Profit / Gross Profit
• Bayan has been able to
drive earnings and
Margin EBITDA / EBITDA Margin Net Profit / Net Profit Margin
margins higher positioning US$MM % US$MM % US$MM %
the Company as one of
Indonesia's most profitable 1,000 60% 800 60% 600 40%
coal mining companies as 736.4 524.3
846.9 56% 35%
the impact of the ramp-up 52% 31%
of Tabang has 51% 35%
50% 51% 500 32%
materialized 800 45%
• 2020 net profit includes 600 44% 45% 30%
one-off reversal of
impairment charges on 40% 400 25%
35% 485.1
mining properties of 344.5 25%
600 338.0
US$133MM after tax. 38% 553.6 33% 30% 17%
374.4
489.4
462.9 30% 400 27% 30% 300 20%
356.7
26% 234.2
400
254.8 15%
283.1 20% 200 177.3
210.4 200 166.8 15% 10%
200
10% 100 3%
5%
18.0
0 0% 0 0% 0 0%
Gross Profit Gross Profit Margin EBITDA EBITDA margin Net Profit Net Profit Margin
34Credit Metrics
• Bayan has continued to Total Debt / EBITDA Net Debt / EBITDA
show a track record of
sustained deleveraging x x
even during times of 10 10
depressed coal prices
• The development and
ramp-up of Tabang has
5
been instrumental in 5 2.6x
2.9x
delivering this 0.5x
1.0x 1.1x 0.7x 0.1x -0.1x 0.1x -0.4x
0.2x 0.2x 0
• The Group has been
0 2016 2017 2018 2019 2020 1Q21
assigned independent
2016 2017 2018 2019 2020 1Q21
credit ratings of BB-, Ba3
and B+ by Fitch, Moody’s -5
and S&P respectively
EBITDA / Net Interest Expense Third Party Debt / Total Capital Ratio(1)
x %
800 755.1x 70% 58.7%
60%
600 50%
40% 28.6%
400 25.1% 22.2%
30%
200 20% 11.2% 11.3%
3.7x 17.4x 39.2x 9.9x 14.9x 10%
0 0%
2016 2017 2018 2019 2020 1Q21 2016 2017 2018 2019 2020 1Q21
Note
(1) Third Party Debt includes Bank Debt, Financing Leases and Derivatives divided by Total Capital (Total Liabilities plus Total Equity)
35Appendices
Ownership and Corporate Structure (1)
Dato’ Dr. Low Tuck PT Sumber Suryadarma
Prima Public Shareholder
Kwong
53.7% 10.0% 36.3%
Public and
PT Bayan Resources Tbk
Management (2)
99.9% 16.3%
PT Bayan Energy
90% 90% 99.9% 75% 75% 75% 75% 100% 95.24% 75% 75% 62.42%
0.1% 25% 25% 25% 25% 25% 25% 25%
PT Brian PT Firman PT Wahana Kangaroo PT Dermaga
PT Bara PT Fajar PT Teguh PT Perkasa PT Metalindo PT Indonesia PT Muji
Anjat Ketaun Baratama Resources Perkasa
Tabang Sakti Prima Sinarabadi Inakakerta Prosestama Pratama Lines
Sentosa Perkasa Mining Limited (4) Pratama
Tabang TSA / FKP WBM PIK 97.39%
PT Gunungbayan
Pratamacoal
99% 99% 99% 99% 99% 99% 99% 99% 99% 99% 100% 99.99%
Kangaroo
PT Tiwa PT Tanur PT Dermaga PT Silau PT Orkida PT Sumber PT Bara PT Apira PT Cahaya PT Karsa PT Sumber
Minerals Pty
Abadi Jaya Energi Kencana Makmur Api Sejati Utama Alam Optima Jaya Aset Utama
Ltd
North Pakar
99% 99% 99% 99%
Tabang Concessions PT Mahakam
PT Mamahak PT Bara PT Mahakam
Energi
Coal Mining Karsa Lestari Bara Energi
Lestari
Investment Holding Coal Mining Investment in Subsidiary Mine Contractor Shipping Coal Port Management Service and Trading
Notes
(1) Position per February 29, 2019.
(2) Management include Chin Wai Fong, Lim Chai Hock, Engki Wibowo, Jenny Quantero, Russell John Neil, Alastair McLeod and Low Yi Ngo
(3) Pro forma corporate structure post finalization of the SPA with Kangaroo Resources Limited.
37Project Locations
38Disclaimer
These materials have been prepared by PT Bayan Resources Tbk. (“Bayan Resources” or the “Company”) solely for informational purposes, and are strictly
confidential and may not be taken away, reproduced or redistributed to any other person. By attending this presentation, participants agree not to remove this
document from the conference room where such documents are provided without express written consent from the Company. Participants agree further not to
photograph, copy or otherwise reproduce these materials at any point of time during the presentation or while in your possession. By attending this
presentation, you are agreeing to be bound by the foregoing restrictions. Any failure to comply with these restrictions may result in a violation of applicable laws
and commencement of legal proceedings against you.
It is not the Company’s intention to provide, and you may not rely on these materials as providing, a complete or comprehensive analysis of the Company’s
financial position or prospects. The information contained in these materials has not been independently verified and is subject to verification, completion and
change without notice. The information contained in these materials is current as of the date hereof and are subject to change without notice, and its accuracy is
not guaranteed. The Company is not under any obligation to update or keep current the information contained in these materials subsequent to the date hereof.
Accordingly, no representation or warranty, express or implied, is made or given by or on behalf of the Company, or any of its directors and affiliates or any
other person, as to, and no reliance should be placed for any purposes whatsoever on, the fairness, accuracy, completeness or correctness of, or any errors or
omissions in, the information contained in these materials. Neither the Company, its directors, officers or employees nor any other person accepts any liability
whatsoever for any loss howsoever arising from any use of these materials or their contents or otherwise arising in connection therewith.
These materials contain historical information of the Company which should not be regarded as an indication of future performance or results. These materials
may also contain forward-looking statements that are, by their nature, subject to significant risks and uncertainties. These forward-looking statements reflect the
Company’s current views with respect to future events and are not a guarantee of future performance or results. Actual results, performance or achievements of
the Company may differ materially from any future results, performance or achievements expressed or implied by such forward-looking statements. Such
forward-looking statements are based on numerous assumptions regarding the Company’s present and future business strategies and the environment in which
the Company will operate in the future, and must be read together with such assumptions. Predictions, projections or forecasts of the economy or economic
trends of the markets are not necessarily indicative of the future or likely performance of the Company, and the forecasted financial performance of the
Company is not guaranteed. No reliance should be placed on these forward-looking statements.
39You can also read