Comparing Security and Privacy Attitudes Among U.S. Users of Different Smartphone and Smart-Speaker Platforms
←
→
Page content transcription
If your browser does not render page correctly, please read the page content below
Comparing Security and Privacy Attitudes
       Among U.S. Users of Different Smartphone and Smart-Speaker Platforms

                         Desiree Abrokwa, Shruti Das, Omer Akgul, and Michelle L. Mazurek
                                              University of Maryland

                             Abstract                                             and other potentially sensitive resources (e.g., [6, 9, 17, 33,
   Many studies of mobile security and privacy are, for sim-                      34, 38, 53, 64]). Much time and effort have also been spent
plicity, limited to either only Android users or only iOS users.                  developing and testing different smartphone authentication
However, it is not clear whether there are systematic differ-                     mechanisms (e.g., [31,37,43,49,60]). Extensive research into
ences in the privacy and security knowledge or preferences                        modern secure communication has focused on mobile mes-
of users who select these two platforms. Understanding these                      senger apps, including for example exploration of the usability
differences could provide important context about the gener-                      of authentication ceremonies [24, 28, 41, 57, 61, 62, 66].
alizability of research results. This paper reports on a survey                      In the IoT ecosystem, researchers have explored issues
(n=493) with a demographically diverse sample of U.S. An-                         ranging from concerns about unexpected listening and record-
droid and iOS users. We compare users of these platforms us-                      ing [32,36,55] to attacks requiring user interaction [29,50], to
ing validated privacy and security scales (IUIPC-8 and SA-6)                      studies of IoT privacy and security concerns more generally
as well as previously deployed attitudinal and knowledge                          (e.g., [3, 15, 56, 67]), and more.
questions from the Pew Research Center. As a secondary anal-                         In many cases, these studies have been limited — often
ysis, we also investigate potential differences among users of                    for simplicity or convenience — to only one mobile or IoT
different smart-speaker platforms, including Amazon Echo                          platform (e.g., Android or the Amazon Echo ecosystem) [5, 9,
and Google Home. We find no significant differences in pri-                       17, 29, 34, 54, 59, 61, 64, 66]. In other cases, researchers have
vacy attitudes of different platform users, but we do find that                   supported multiple platforms, at the cost of more complicated
Android users have more technology knowledge than iOS                             study instruments that must work in multiple settings [4, 36,
users. In addition, we find evidence (via comparison with                         50, 62].
Pew data) that Prolific participants have more technology                            Given this context, it it important to know whether there are
knowledge than the general U.S. population.                                       meaningful differences in privacy and security preferences,
                                                                                  beliefs, and attitudes between users of different platforms. For
                                                                                  example, Apple has recently marketed its products as more
1   Introduction                                                                  privacy-protective than alternatives [2]. In the past, iOS has
                                                                                  pioneered fine-grained permission controls, including limit-
The increasing ubiquity of mobile and IoT devices has gener-                      ing location permissions to single-use or only while an app
ated significant research and development related to privacy                      is being used [63]. In contrast, Google’s largest source of
and security tools, affordances, and preferences. For exam-                       income1 is though targeted advertising, involving extensive
ple, researchers have explored, at length, the implication of                     user data collection.
built-in permissions systems that govern mobile apps’ access                         We hypothesize that this distinction in business strategies
to location, contacts, sensors like the microphone or camera,                     could result in more privacy-sensitive consumers tending to
                                                                                  purchase iPhones, perhaps resulting in Android users who are
                                                                                  disproportionately unconcerned with privacy. Similar ques-
                                                                                  tions are also applicable to smart speaker platforms; however,
                                                                                  market positioning related to privacy is not (yet) as clear as
Copyright is held by the author/owner. Permission to make digital or hard         with smartphones. If there are indeed meaningful differences
copies of all or part of this work for personal or classroom use is granted       between users of different platforms, then extra work by re-
without fee.
                                                                                     1 https://abc.xyz/investor/static/pdf/2020Q4_alphabet_
USENIX Symposium on Usable Privacy and Security (SOUPS) 2021.
August 8–10, 2021, Virtual Conference.                                            earnings_release.pdf

                                                                              1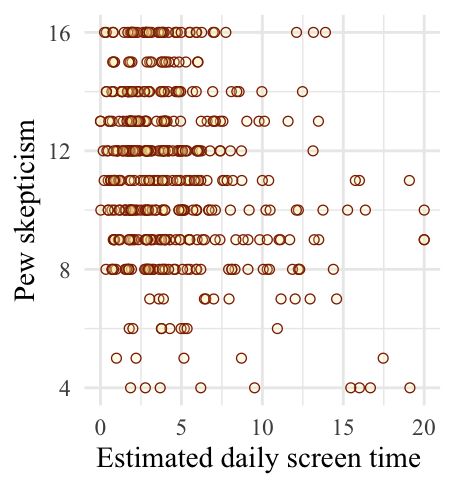
searchers to ensure their studies support multiple platforms          attitudes and preferences among various populations.
may be critical. On the other hand, if there are not meaningful
differences, then researchers can opt for simpler experimental        Privacy and security metrics            Researchers have long
designs with less concern about reduced generalizability.             sought to define metrics for privacy and security attitudes
   In this paper, as our primary objective, we address these          as well as behavior. Several developed psychometric scales
questions by surveying privacy and security attitudes among           intended to measure privacy attitudes and concern. Perhaps
users of different mobile and IoT platforms to determine if           the first such scale was the original 1991 Westin Privacy
differences exist. We use validated scales to measure security        Segmentation Index, which groups respondents into privacy
attitudes (SA-6) and privacy concern(IUIPC-8) [16, 19]. We            fundamentalists, pragmatists, and unconcerned [30]. In 1996,
also reuse questions previously used by the Pew Research              Smith et al. developed the Concern for Information Privacy
Center (henceforth: Pew) in a nationally representative sur-          (CFIP) scale, which measured privacy concern along multi-
vey to ask about skepticism toward company data practices             ple dimensions including collection, unauthorized secondary
and knowledge about digital privacy and security [1]. As a            use, and improper access [52]. This was followed in 2004 by
secondary objective, reusing these questions allows us to com-        the IUIPC, a 10-item scale that builds on the original CFIP
pare attitudes between Prolific and nationally representative         and measures three dimensions of privacy attitudes: control,
samples.                                                              awareness of privacy practices, and collection [35]. A num-
   In 2014, Reinfelder et al. addressed similar questions, com-       ber of other privacy scales have been proposed; Preibusch
paring security behaviors between Android and iOS users in            provides a comprehensive list and comparison [42].
Germany, finding that Android users were somewhat more                   Other researchers have investigated the utility and relia-
privacy- and security-conscious [48]. We revisit this question        bility of these scales. Woodruff et al. demonstrated that the
to see what has changed in the intervening years, as devices          Westin index is poorly predictive of privacy-relevant behav-
have evolved and Apple has marketed privacy more heav-                ioral intentions [65]. In 2013, Preibusch’s aforementioned
ily. In addition to smartphone platforms, we also consider            guide reviews pros and cons of each metric before finally
the increasingly important smart-speaker platform. Further,           recommending IUIPC [42]. However, Sipior et al. and Zeng
we deliberately focus on attitudes rather than behaviors, as          et al. obtain mixed results when re-validating the IUIPC, par-
we expect that behaviors are more likely to be influenced by          ticularly with respect to trust in online companies and social
different platforms’ privacy and security affordances.                networking, respectively [51, 68].
   To ensure a diverse sample, we recruit 493 participants               Most recently, Groß demonstrated that the original IUIPC-
using Prolific’s “representative” sample feature, which ap-           10 contains two poorly worded questions, without which the
proximates the U.S. population for gender, race, and age. We          scale is significantly more reliable [19]. In this work, we adopt
find no significant differences in security attitudes, privacy        the resulting IUIPC-8 scale.
concern, or skepticism toward company data practices be-                 Other scales concern security attitudes and behaviors. The
tween users of different mobile or IoT platforms. We do find          Security Behavior Intentions scale (SeBIS) by Egelman and
that Android users score slightly higher in security and pri-         Peer is intended to measure how well individuals comply
vacy knowledge than iOS users. We also compare our sample             with computer security advice from experts [14]. Faklaris et
to the representative Pew sample for the two Pew metrics,             al. created and validated the six-item SA-6 scale to measure
finding no difference in skepticism; however, our participants        security attitudes, which may differ from (intended) behav-
scored significantly higher in security and privacy knowledge,        iors [16]. Because we focus primarily on attitudes, we select
somewhat limiting the generalizability of our primary analy-          SA-6 rather than SeBIS for our study.
sis.                                                                     Security- and privacy-relevant questions also appear in reg-
   These findings have implications for the design of future          ularly administered, representative-sample surveys conducted
research exploring uses and preferences in mobile and IoT             by the Pew Research Center. The center’s 2019 American
security and privacy. For studies purely about attitudes and          Trends Panel: Wave 49 features relevant questions related to
preferences, ensuring cross-platform representation may not           Americans’ knowledge of web and internet concepts, as well
be necessary. On the other hand, for studies where knowledge          as questions related to skepticism (or trust) that companies
may play an important role — for example, in evaluating men-          will manage the data they collect appropriately [1]. We adopt
tal models of security and privacy mechanisms — ensuring              subsets of these questions that align with our research goals.
participation from both iOS and Android users may be more             Including these questions allows us to compare our results to
important.                                                            a fully representative random sample of U.S. adults.
                                                                      Comparing sample populations for privacy and
2   Related Work                                                      security      Other research has sought to compare pri-
                                                                      vacy and security attitudes among different populations.
We discuss related work in two key areas: metrics for privacy         Kang et al. compared the privacy attitudes and behaviors of
and security, and studies that compare privacy or security            U.S. Mechanical Turk (MTurk) workers with the general U.S.

                                                                  2
population, finding U.S. MTurk workers display heightened              ally, Reinfelder et al. and Mylonas et al. primarily sampled
privacy attitudes [25]. Redmiles et al. endorse the use of             young people. In contrast, we use Prolific’s “representative
MTurk workers for convenient, affordable samples. However,             sample” feature to obtain participants of diverse ages across
they highlight shortcomings when trying to generalize                  a quasi-representative U.S. sample [39, 48].
security and privacy perceptions of underrepresented groups               Other fields have also compared Android and iOS users.
(e.g. elderly, less educated) [46]. Because we employ                  Psychologists found socioeconomic factors and personality
questions from Pew, we are able to similarly compare our               traits may contribute to smartphone preferences [20].
results to the broader U.S. population [1].
   Research has also explored differences in privacy attitudes
and preferences in different countries and regions. In a lon-
                                                                       3     Methods
gitudinal study that included 25 countries, Kelley identified          To answer our research questions, we created and distributed
important regional differences in the importance people as-            a survey to measure the privacy and security attitudes and
sign to privacy, as well as whether and when it is acceptable          perceptions of participants. The survey was approved by the
for, e.g., law enforcement organizations to violate privacy            University of Maryland’s Institutional Review Board. Our
in pursuit of other goals [26]. Redmiles compared behavior             experimental approach was also preregistered with AsPre-
after Facebook security incidents in five countries, finding           dicted. 2
some cultural differences [45]. Ion et al. noticed political and
                                                                          In the following subsections we discuss the survey design,
cultural attitudinal differences in mental models related to
                                                                       our recruitment process, our data analysis approach, and the
cloud computing privacy and security between Swiss and In-
                                                                       limitations of our study.
dian communities [23]. Similarly, Harbach et al. studied more
than 8,000 Android users across eight countries. Their results
affirmed that cultural and demographic characteristics can             3.1     Survey
strongly determine security and privacy considerations [21].
                                                                       We designed a short survey measuring privacy and security
Dev et al. compared privacy concerns related to Whatsapp
                                                                       attitudes and perceptions, building on various previously used
messaging in Saudi Arabian and Indian communities, finding
                                                                       and validated constructs as described in Section 2.
likely culturally influenced behavioral differences between
                                                                          The survey included the SA-6 [16] and the IUIPC-8 [19],
populations but overall similar privacy trends when consider-
                                                                       as well as four questions about skepticism toward data use by
ing participants within each sample [12].
                                                                       companies and seven security- and privacy-relevant knowl-
   Most closely related to our work are three separate 2013-
                                                                       edge questions, all taken from Pew [1]. The original Pew
2014 studies comparing security and privacy awareness be-
                                                                       survey contained 10 digital knowledge questions; we used
tween Android and iOS users. In the first, King interviewed a
                                                                       seven that are privacy- and security-relevant. For example,
small sample of iPhone and Android users from San Francisco
                                                                       we selected questioned related to HTTPS, private browsing,
to qualitatively understand contextual design decisions that
                                                                       and phishing, while deeming a question asking participants
impact privacy-centered user experiences [27]. In the second,
                                                                       to identify a technology leader from their photo irrelevant.
Reinfelder et al. found (among German university students)
                                                                       To distinguish the two sets of Pew questions, we refer to
Android users were more likely to be security aware and pri-
                                                                       them going forward as the skepticism and knowledge metrics,
vacy conscious [48]. Finally, Mylonas et al. investigated user
                                                                       respectively. The questions chosen for the skepticism and
mental models of application installations on different plat-
                                                                       knowledge metrics are shown in Tables 1 and 2.
forms among Greeks [39]. Although not the primary research
                                                                          To ensure that the Pew skepticism questions could be added
objective, they provided evidence that Android users were
                                                                       together for use as a single consistent metric, we tested their
more security aware across multiple metrics (e.g., likelihood
                                                                       internal reliability with Cronbach’s α, using the data collected
of adopting security software).
                                                                       in Pew’s national survey. We obtained α = 0.83 for the four
   Because of the rapid changes in smartphone technology,              skepticism questions: above the 0.80 threshold for “good”
both hardware and software, over the last seven years, we              reliability [18].
wanted to evaluate whether these results would still hold, this           After providing consent, participants provided their country
time across a broad U.S. sample. Both King and Reinfelder et           of residence, as a confirmation of Prolific’s selection criteria.
al. focused on behavioral patterns, such as installing security        As we intended to recruit only U.S. participants, those who
updates, consciousness of possible malware infections, and             answered with other countries were filtered out immediately.
app permissions [27,48]. We instead focus on attitudinal ques-            Next, we asked for background information on participants’
tions, which are frequently used in studies of smartphone and          device(s) and how they use them. This included multiple-
IoT users [8, 10, 15, 44]. Further, behavioral questions about,        choice questions about how many smartphones the participant
e.g., app permissions are difficult to entangle from system            uses or owns, what purposes they use their smartphone for
design affordances and nudges that may contribute to users
of different platforms making different choices. Addition-                 2 https://aspredicted.org/gx2v9.pdf

                                                                   3
Item ID Item Text 3.2 Recruitment
PP5A Follow what their privacy policies say they will Participants were recruited through Prolific, an online crowd-
do with your personal information sourcing platform which can be expected to produce high-
PP5B Promptly notify you if your personal data has quality results [40]. Participants were required to reside in the
been misused or compromised United States and be 18 or older. The study was advertised as
PP5C Publicly admit mistakes and take responsibility being about “Technology Perceptions” to avoid self-selection
when they misuse or compromise their users’ biases related to privacy and/or attachment to different hard-
personal data ware vendors. We used Prolific’s “representative sample” tool
PP5D Use your personal information in ways you to increase the diversity of our sample. Prolific stratified our
will feel comfortable with sample to match 95% of 2015 U.S. census values for age,
gender, and race [58].
Table 1: Items related to skepticism of company data practices, Participants who completed the survey with valid responses
drawn from the Pew Research Center American Trends Panel: were compensated with $3.00. The survey took on aver-
Wave 49 questionnaire [1], that are included in our survey. In age 12.4 minutes, resulting in average compensation of of
the survey, participants are asked: How confident are you, if $14.56/hour. Responses were collected in December 2020.
at all, that companies will do the following things? Response
options are a four-point Likert-type scale from very confident
to not confident at all. The item IDs are those used by Pew. 3.3 Analysis
We analyzed our data using four linear regression models, with
dependent variables for each privacy/security metric: SA-6,
IUIPC-8, the Pew skepticism metric, and the Pew knowledge
(e.g., personal, work, other), the model and operating system metric. For SA-6, IUIPC-8, and the skepticism metric, we
of their primary smartphone, whether or not they own a smart summed participants’ Likert responses. For the knowledge
speaker (and if so, which one), how frequently they use the metric, participants were scored 0 to 7 based on how many
voice assistant on their smartphone, and how frequently they questions they answered correctly.
use their devices (e.g., multiple times a day). Participants were For all four models, the independent variables included
asked to retrieve actual time-use data from their smartphone smartphone platform (iOS or Android) and smart-speaker plat-
if applicable. Participants without a smartphone were filtered form (Amazon Echo, Google Home, other, none). Other co-
out at this point. variates included age, gender, daily estimated smartphone use
Next, participants answered the security and privacy percep- time, whether or not the smartphone was rooted/jailbroken,
tions questions, including SA-6, IUIPC-8, the Pew skepticism and how often participants give tech advice (used as a proxy
metric and the Pew knowledge metric. In keeping with their for tech savviness). For parsimony, we binned tech advice
original use, we randomized the question order and answer responses into two categories: less often (never rarely, some-
choices within the Pew segments. We also randomized the times) and more often (often, almost always). We similarly
order of the three IUIPC-8 subscales (but not the order of binned gender into men and non-men (women and other gen-
questions or answers within subscales). This section also in- ders), because very few participants reported other genders.
cluded free-response questions asking participants to explain These variables are summarized in Table 3.
their choices for two questions; these responses were used To obtain our four models, we perform model selection
primarily as attention checks, and participants who gave un- based on Akaike Information Criterion (AIC), which strikes
related or non-responsive answers to these questions were a balance between how well models explain the dependent
removed from the sample. variables and over-fitting [7]. For each dependent variable, we
fit regressions with smartphone and smart-speaker platforms
Finally, we asked some standard demographic ques- (the main variables of interest) as well as all possible com-
tions, including questions related to age, gender identity, binations of the other covariates. We report only the model
race/ethnicity, and employment status. We also asked about with the lowest AIC for each metric.
tech-savviness, measured using a Likert-type question about We aimed to recruit 500 participants. Power analysis for
how often the participant gives technology advice to others. linear regression (assuming that all our potential IVs would
The full survey text is given in Appendix B. be included) shows that 500 participants is sufficient to detect
approximately small3 effects ( f 2 = 0.032) [11].
We implemented the survey in Qualtrics. Prior to main data
We note one deviation from our preregistered analysis plan.
collection, we conducted eleven pilot tests of the survey with
We initially planned to fit eight regression models: one for
a convenience sample, to validate the questions and survey
flow, as well as to estimate the time required for completion 3 Cohen claims f 2 > 0.02 would capture “small”, f 2 > 0.15 would capture
(15 minutes). “medium” effect sizes.
4Item ID Item text Correct answer
KNOW1 If a website uses cookies, it means that the site . . . Can track your visits and activity on the site
KNOW2 Which of the following is the largest source of revenue for most major Allowing companies to purchase advertisements on
social media platforms? their platforms
KNOW3 When a website has a privacy policy, it means that the site . . . Has created a contract between itself and its users
about how it will use their data
KNOW4 What does it mean when a website has “https://” at the beginning of Information entered into the site is encrypted
its URL, as opposed to “http://” without the “s”?
KNOW5 Where might someone encounter a phishing scam? All of the above (In an email, on social media, in a
text message, on a website)
KNOW7 The term “net neutrality” describes the principle that . . . Internet service providers should treat all traffic on
their networks equally
KNOW8 Many web browsers offer a feature known as “private browsing” or A coworker who uses the same computer
“incognito mode.” If someone opens a webpage on their computer at
work using incognito mode, which of the following groups will NOT
be able to see their online activities?
Table 2: Security- and privacy-relevant digital knowledge questions, drawn from the Pew Research Center American Trends
Panel: Wave 49 questionnaire [1]. All questions are multiple-choice. The item IDs are those used by Pew.
Variable Explanation Baseline
Main variables of interest:
Smartphone OS Whether the participant is an iOS or Android user iOS
Smart speaker Whether the participant owns a smart speaker, and which Amazon Echo device
Demographic covariates:
Tech advice Whether the participant is asked for tech advice, binned into less often or more often Less often
Device rootedness Whether or not the participant’s device is rooted or jailbroken Not rooted
Screen-time estimate Self-reported hours of daily phone use –
Age The participant’s age –
Gender Gender, binned into men and non-men (women and other genders) Non-man
Table 3: Independent variables (IVs) used in our regressions, including main variables of interest (mobile and smart-speaker
platforms) as well as demographic covariates. Baselines are listed for categorical variables. Section 3.3 details the regressions.
each combination of dependent variable (SA-6, IUIPC, skep- We also added one secondary analysis not described in our
ticism metric, knowledge metric) and platform (smartphone pre-registration: We compare our participants’ responses to
OS and smart-speaker type). We made this plan because we the Pew questions to the nationally representative Pew data
assumed that relatively few participants in the initial “repre- for the same questions. This comparison allows us to explore
sentative sample” from Prolific would own smart speakers; how well the “representative” Prolific feature captured the
we intended to augment our sample with a second batch re- broader U.S. population (albeit with a time lag). For these
cruited from Prolific specifically on the basis of smart-speaker comparisons, after establishing that the data was not normally
ownership. Because we didn’t want to combine these two in- distributed (Shapiro-Wilk p < 0.001), we use non-parametric,
compatible samples, we intended to model smartphone and two-tailed Mann-Whitney U tests, one for each Pew metric.
smart-speaker platforms separately. However, we were pleas- Since the Pew scales are used in two analyses each (one
antly surprised to find that more than one third of our “rep- regression and one MWU), we adjust the relevant p-values
resentative” sample were smart-speaker owners. Rather than with Bonferroni correction.
obtain a less representative sample, we opted to use only the
initial sample and to include both platform types in our four re-
gression models. Using fewer models reduces the complexity 3.4 Limitations
of our analysis and enables holistic comparison that accounts
for all factors at once. Our study has several limitations, most of which are common
to this type of research. Although we used Prolific’s “represen-
5tative sample” 4 tool to diversify our sample, our participants Android iOS Total
are still on average more educated than the U.S. population. (%) (%) (%)
Our sample also severely underrepresents, compared to the Gender Women 50.5 51.0 50.7
U.S. population, people who identify as Hispanic or Latino; Men 48.4 47.6 48.1
the Prolific stratification does not incorporate this ethnicity Non-binary and other 1.1 1.5 1.2
information. Additionally, we compared the results for the Age 18-27 14.0 24.0 18.3
Pew scales to a representative sample of the U.S. population. 28-37 19.7 16.8 18.5
38-47 18.2 14.9 16.8
This indicated that while Prolific users have similar privacy 48-57 17.2 18.3 17.6
concerns, they have more privacy and security knowledge 58+ 30.9 26.0 28.8
than the broader population. Hispanic No 95.8 91.8 94.1
Survey responses were only collected from Prolific users in origin Yes 4.2 8.2 5.9
the United States. We focused on the United States to avoid Race White 74.0 73.3 73.7
confounds related to availability and popularity of different Black or African Amer. 15.5 11.5 13.8
devices, as well as cultural differences, inherent in comparing Asian 6.1 11.1 8.2
multiple countries. However, our results cannot necessarily Amer. Ind. or AK Native 2.7 1.8 2.3
generalize to non-U.S. populations. Nat. Hawaiian or Pac. Isl. 0.3 0.5 0.4
We use self-report metrics, which are vulnerable to biases Education Completed H.S. or below 13.0 5.3 9.7
such as social desirability and acquiescence. However, prior Some college, no degree 25.3 22.6 24.1
Associate’s degree 12.6 4.8 9.3
work suggests self-reporting can provide useful data on secu- Bachelor’s degree 27.7 36.1 31.2
rity and privacy questions [13,47]. Further, we expect these bi- Master’s degree or higher 14.4 25.0 18.9
ases to affect users of different smartphone and smart-speaker Employment Employed full-time 34.4 37.5 35.6
platforms similarly, enabling comparison among groups. status Employed part-time 13.0 13.5 13.2
Self-employed 13.0 12.5 12.8
Retired 15.8 13.9 15.0
4 Results Unemployed 7.7 6.7 7.3
Student 5.6 9.6 7.3
In this section, we first describe our survey participants. We Tech Almost always 5.6 6.7 6.1
then detail the results of our regressions comparing platform advice Often 20.3 19.2 19.9
users across each security or privacy metric. Finally, we com- Sometimes 41.4 43.3 42.2
pare our sample to the nationally representative Pew sample Rarely 28.1 24.5 26.6
for context. Overall, we found no differences across platforms Never 4.6 6.3 5.3
in privacy attitudes, but we found that Android users scored
higher than iOS users on the Pew knowledge metrics. Our Table 4: Participant demographics. Percentages may not add
sample did not differ significantly from the Pew sample in to 100% due to multiple selection and item non-response;
skepticism toward company data practices, but our partici- some categories with small percentages are elided.
pants scored higher on the knowledge metric.
of the U.S. for gender, age, and race. Other demographics,
4.1 Participants however, suffer from typical crowdsourcing biases, includ-
In December 2020, we used Prolific to recruit 500 participants ing insufficient Hispanic/Latinx representation and more ed-
currently residing in the U.S. We discarded five for off-topic ucation than the U.S. population overall5 . The plurality of
or unresponsive free-text responses, one for being outside participants report giving tech advice “sometimes.”
the U.S., and one who skipped an optional question that was Our results show some demographic differences between
required for our analysis. The remaining 493 participants smartphone users. Our Android users tend to be older and less
served as our final sample for analysis. educated than their iOS counterparts. Our iOS sample has
Of the 493 participants, 285 use Android and 208 use iOS higher proportions of Asian and Hispanic people, but a notice-
on their primary smartphone. In total, 175 participants use ably smaller proportion of Black people. There are also some
smart speakers, including 95 who only use an Amazon Echo, notable differences in educational attainment between the
54 who only use Google Home, and 26 who use some other populations, with iOS users tending to have more education.
smart speaker or use multiple brands. In addition to asking participants for their daily screen-
Demographics within our Android, iOS, and total samples time estimates, we asked participants who were able to report
are given in Table 4. Because we used Prolific’s “representa- their actual daily screen-time averages (visible under “Screen
tive sample” feature, our overall sample is fairly representative Time” settings on iOS and “Digital Wellbeing” on some An-
4 https://researcher-help.prolific.co/hc/en-gb/articles/ 5 https://www.census.gov/acs/www/data/data-tables-and-
360019236753-Representative-Samples-on-Prolific tools/data-profiles/2019
6IUIPC-8 β CI95% T-value p-value
Smartphone (vs. iOS)
Android −0.9 [ - 1.9, 0.2] −1.624 0.105
Smart speaker (vs. Amazon)
Google −1.4 [ - 3.4, 0.5] −1.418 0.157
Other −0.4 [ - 2.9, 2.2] −0.274 0.784
None 1.0 [ - 0.3, 2.4] 1.517 0.130
Covariates
Rootedness: Not Rooted 1.6 [ - 0.6, 3.7] 1.449 0.148
Screen-time Estimate −0.2 [ - 0.3, 0.0] −2.223 0.027*
Age 0.0 [ - 0.0, 0.1] 1.510 0.132
(a) SA-6 (b) Pew knowledge
Figure 1: Comparison of SA-6 and Pew knowledge metric Table 6: Final regression table for IUIPC. Adj. R2 = 0.04.
∗ Statistically significant.
responses for participants who give tech advice more and less
often. The Y-axis shows the range of possible values for each
scale; the X-axis shows the fraction of total participants with
each score. Both comparisons show a significant difference. positive attitude toward security behaviors. Overall, our par-
ticipants scored an average of 20.7 (σ = 4.2, min=7, max=30).
By definition, our final regression model (Table 5) includes
SA-6 β CI95% T-value p-value
both smartphone (Android mean=20.8; iOS mean=20.7) and
Smartphone (vs. iOS) smart-speaker platform (Amazon Echo mean=20.9; Google
Android 0.0 [ - 0.7, 0.8] 0.070 0.945 Home mean=20.8; Other mean=20.4; None mean=20.7), but
Smart speaker (vs. Amazon) neither factor is significant. Figure 2a illustrates the similarity
Google −0.4 [ - 1.8, 1.0] −0.600 0.549 between iOS and Android participants for this metric.
Other −0.9 [ - 2.7, 0.8] −1.026 0.306 The only two significant covariates were tech advice and
None −0.1 [ - 1.0, 0.9] −0.196 0.845 gender. As shown in Figure 1a, those who give tech advice
Covariates “often” or “almost always” were associated with a 2.5-point
Tech advice: More often 2.5 [ 1.7, 3.4] 5.901 < 0.001* increase in positive attitude (p < 0.001), compared to those
Rootedness: Not rooted −1.1 [ - 2.6, 0.4] −1.482 0.139 who do not. It’s intuitively reasonable that increased tech-
Gender: Man −0.9 [ - 1.7,- 0.2] −2.533 0.012*
savviness would correlate with more interest in security. This
also aligns with findings in the original SA-6 paper that the
Table 5: Final regression table for SA-6. Adj. R2 = 0.08. scale correlates with tech-savviness, confidence in using com-
∗ Statistically significant.
puters, and digital literacy [16].
In a smaller effect, men were associated with an 0.9-point
decrease in positive attitude toward security compared to non-
droid models). Self-reported daily screen time was 4.5 hours men (p = 0.012). Rootedness was also retained in the final
(σ = 3.7, min=0, max=20). Participants on average (calcu- model, but did not show a statistically significant effect.
lated from 225 participants who were able to provide both
an estimate and the smartphone report) underestimated their Privacy concern (IUIPC-8) Next, we consider responses
screen time by 27.4 minutes (σ = 147.3). This corresponds to the IUIPC-8, which measures privacy concern. Potential
to 10% error in screen-time use. Distribution of the error can scores range from 8–56, with higher scores indicating higher
be found in Figure 4 of Appendix A. levels of privacy concern. Our participants scored on average
47.7 (σ = 5.9, min=22, max=56), indicating that they tend to
be more privacy sensitive than not.
4.2 Comparing platforms As with SA-6, we see no significant differences based on
We fit four regression models, one each for our privacy and smartphone (Android mean=47.3; iOS mean=48.1) or smart-
security metrics. These models included both smartphone speaker platform (Amazon Echo mean=47.2; Google Home
and smart-speaker platform, as well as other demographic mean=45.3; other mean=46.8; None mean=48.3). Figure 2b
covariates. We report, in turn, on each of the final best-fit illustrates the similarity of responses across the two smart-
models. phone platforms and Table 6 shows the final regression model.
In fact, we find only one significant factor: estimated screen
Security attitude (SA-6) First, we analyze responses to time on the primary smartphone, depicted in Figure 5a of
the SA-6 security attitude scale. Potential scores on this scale Appendix A. Each additional 5 hours of daily screen time
range from 6–30, with higher numbers indicating a more is associated with a drop of 1.0 points in privacy concern
7(a) SA-6 (b) IUIPC-8 (c) Pew skepticism (d) Pew knowledge
Figure 2: Comparison between iOS and Android users on all metrics. The Y-axis shows the range of possible values for each
scale; the X-axis shows the fraction of total participants with each score. Only the Pew knowledge metric shows a significant
difference between platforms.
(p = 0.027). It is perhaps unsurprising that participants who Pew Skepticism β CI95% T-value p-value
spend more time on their smartphones exhibit lower privacy Smartphone (vs. iOS)
concern, possibly due to habituation. Age and whether or not Android 0.0 [ - 0.4, 0.5] 0.191 1.000
the participant had rooted their device were retained in the
final model but did not show significant effects. Smart speaker (vs. Amazon)
Google −0.4 [ - 1.3, 0.5] −0.884 0.754
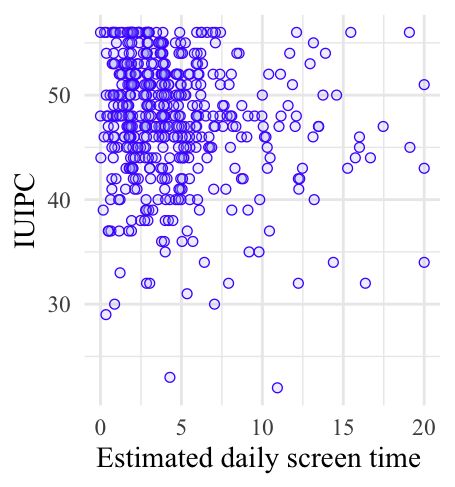
Skepticism toward companies (Pew) We next examine Other −0.6 [ - 1.8, 0.6] −0.952 0.683
participants’ skepticism toward companies’ data management None −0.3 [ - 1.0, 0.3] −1.046 0.593
practices. Potential scores on this metric range from 4–16,
Covariates
with higher scores indicating more skepticism and lower Screen-time Estimate −0.2 [ - 0.3,−0.1] −5.861 < 0.001*
scores indicating more trust. Participants scored on average Age 0.0 [ - 0.0, 0.0] −1.554 0.242
11.3 (σ = 2.8, min=4, max=16).
On this metric, also, we see no significant differences based
Table 7: Final regression table for the Pew skepticism metric.
on smartphone (Android mean=11.2; iOS mean=11.3) or
Adj. R2 = 0.06. ∗ Statistically significant. All p-values reflect
smart-speaker (Amazon Echo mean=11.5; Google Home
Bonferroni correction.
mean=11.1; Other mean=10.8; None mean=11.3) platform in
the final model (Table 7). This lack of difference is illustrated
in Figure 2c.
difference can be seen in Figure 2d, which shows more An-
As with IUIPC, the only significant factor in the model was
droid users at the high end and more iOS users at the low
screen time. Each additional five hours of screen time per day
end of scores. We found no significant differences among
is associated with a 1.0-point drop in skepticism (p < 0.001).
smart-speaker owners on this metric, either (Amazon Echo
This aligns with the similar finding for IUIPC: more screen
mean=5.1; Google Home mean=5.2; Other mean=4.5; None
time, and presumably more habituation, is associated with
mean=4.9).
less concern about data practices (Figure 5b of Appendix A).
Three demographic covariates appear as significant factors
Age is again included in the final model but not significant.
in this model. Giving tech advice “often” or “almost always”
Security and privacy knowledge (Pew) Finally, we an- (depicted in Figure 1b) correlates with an 0.4-point increase
alyzed results from the Pew knowledge metric. Participants in score (p = 0.027); this makes intuitive sense. On the other
could score from 0–7 on this metric, corresponding to the hand, each additional five hours of screen time is associated
number of questions they answered correctly. Our participants with an 0.5-point drop in knowledge scores (p < 0.001). This
scored on average 5.0 (σ = 1.5, min=0, max=7). aligns with our results on the other metrics showing that more
The final model (Table 8) estimates that Android users screen time is associated with lower privacy concern and
are likely to score 0.4 points higher on this correctness quiz skepticism.
than iOS users (p = 0.004), meaning they have somewhat We also see a small but significant effect for age: each 10
more security and privacy knowledge (Android mean=5.1; years of additional age correspond to an estimated 0.1-point
iOS mean=4.8). This difference is fairly small, but may reflect drop in correctness score (p = 0.012)6 . It is perhaps unsur-
Apple’s reputation of making products that are easy to use
even for people with very limited technological skills. This 6 The age coefficient (β) shown in table 7 and 8 is rounded down to 0.0;
8Pew Knowledge β CI95% T-value p-value
Smartphone (vs. iOS)
Android 0.4 [ 0.2, 0.7] 3.136 0.004*
Smart speaker (vs. Amazon)
Google −0.1 [ - 0.6, 0.4] −0.238 1.000
Other −0.6 [ - 1.3, 0.0] −1.917 0.112
None −0.2 [ - 0.5, 0.1] −1.136 0.513
Covariates
Tech advice: More often 0.4 [ 0.1, 0.7] 2.474 0.027*
Screen-time Estimate −0.1 [ - 0.1, 0.0] −4.588 < 0.001*
Age 0.0 [ - 0.0, 0.0] −2.753 0.012*
Gender: Man −0.2 [ - 0.5, 0.1] −1.540 0.248 (a) Pew Skepticism (b) Pew Knowledge
Table 8: Final regression table for the Pew knowledge metric. Figure 3: Comparison between Pew participants and our Pro-
Adj. R2 = 0.08. ∗ Statistically significant. All p-values reflect lific participants. The populations show significant difference
Bonferroni correction. in privacy/security knowledge.
prising that older people have on average slightly less security correlated with all of our metrics except security attitudes:
and privacy knowledge. We attribute the relatively small ef- more screen time is associated with less privacy concern, less
fect size in part to Prolific participants; in prior work, older skepticism, and less security/privacy knowledge. In a simi-
crowdworkers and digital panel participants were unusually lar result, giving tech advice more often is positively corre-
tech savvy for their age [46]. lated with positive security attitudes and more privacy/security
knowledge.
These results have several implications for future research
4.3 Comparing our participants to a nation-
into tools and interfaces for mobile and IoT privacy and se-
ally representative sample curity. It may be low-effort to incorporate users of different
An added benefit of reusing Pew questions is that we can platforms into survey or interview studies. However, cross-
compare responses from our sample to Pew’s nationally rep- platform support is more challenging for research that in-
resentative sample (n=4225) [1]. volves new tools, such as testing an agent for managing app
Figure 3a compares our sample to the Pew sample on the permissions, or field-type studies in which participants use
skepticism metric. We find no significant difference between smart devices in their homes for a period of time.
the two populations (MWU, p = 0.120). With respect to smartphones, our results suggest that studies
Figure 3b illustrates responses to the knowledge metric that chiefly involve attitudes and preferences — for example,
from the two samples. Our Prolific participants tended to studies related to app permission choices or preferences for
score higher, indicating more security and privacy knowledge potentially invasive tracking and advertising — may not need
(MWU, p < 0.001). The location-shift estimate, a measure to take differing platforms into account. On the other hand,
of effect size related to median [22], is 2.0, indicates that we did find differences in security and privacy knowledge,
our participants tend to score about two points higher out of which implies that cross-platform support may be important
seven. when a user’s knowledge is expected to be a key factor. These
could include studies evaluating knowledge or mental models
related to secure communications or tracking and inferencing,
5 Discussion as well as studies relating to adoption of various privacy- and
anonymity-enhancing technologies.
We used a survey with a quasi-representative sample to com-
Our results about screen time and tech advice also have
pare privacy and security perceptions across users of smart-
research design implications. Many researchers already tend
phone platforms (Android and iOS) as well as smart-speaker
to (at least partially) control for tech-savviness in participants.
platforms (Google Home, Amazon Echo, another platform, or
Our results support this practice, while suggesting that screen
none). We find no significant differences in attitudes toward
time may be an equally or even more important variable to
security, privacy, or company data practices. We do, however,
consider.
find that Android users are somewhat more knowledgeable
With respect to smart-speaker platforms, we found no sig-
about digital security and privacy. On the other hand, differ-
nificant differences in any of our metrics. This suggests that,
ences in smartphone screen time are significantly negatively
for now, cross-platform differences are not critical for security
when multiplied by 10, it rounds to 0.1. and privacy research on smart speakers. It remains an open
9question whether this result extends to other kinds of IoT Frontiers program under award number 1955805. The views
devices. It is similarly unclear whether this result will remain and conclusions contained herein are those of the authors
stable over time, as the market for IoT devices becomes more and should not be interpreted as necessarily representing the
mature. official policies, either expressed or implied, of NSF. Any
Our work also has implications for crowdsourced samples. mention of specific companies or products does not imply
Comparing our sample to a U.S.-representative sample from any endorsement by the authors, by their employers, or by the
Pew, we find that our participants express similar skepticism NSF.
toward data practices, but are noticeably more digitally knowl-
edgeable than the general U.S. population. The lack of dif-
ference in skepticism provides hope that the gap in privacy References
attitudes noted by Kang et al. in 2014 is shrinking as digital
habits and devices become further entrenched [25]. On the [1] American Trends Panel Wave 49, 2019.
other hand, we confirm prior results that web survey panels, https://www.pewresearch.org/internet/
even when more or less demographically representative, still dataset/american-trends-panel-wave-49.
provide participants who are disproportionately tech-savvy for [2] Data privacy day at Apple: Improving transparency and
their demographics [46]. We therefore encourage researchers empowering users. 2021. https://www.apple.com/
to continue to recognize this limitation in generalizability, and newsroom/2021/01/data-privacy-day-at-apple-
to consider alternate means of recruiting, if feasible, when improving-transparency-and-empowering-
tech-savviness is important to the research question(s) being users.
addressed.
Finally, we suggest researchers also measure other potential [3] Noura Abdi, Kopo M. Ramokapane, and Jose M. Such.
differences between the user populations we investigate in More than smart speakers: Security and privacy percep-
this study. Specifically, we emphasize the need for behavioral tions of smart home personal assistants. In Fifteenth
studies to complement our self-report data, and to explore Symposium on Usable Privacy and Security (SOUPS
differences between attitudes and behaviors that may relate 2019). USENIX Association, August 2019.
to available privacy or security affordances.
[4] Ruba Abu-Salma, Kat Krol, Simon Parkin, Victoria
Koh, Kevin Kwan, Jazib Mahboob, Zahra Traboulsi, and
6 Conclusion M. Angela Sasse. The Security Blanket of the Chat
World: An Analytic Evaluation and a User Study of
In this study, we conducted a security and privacy survey us- Telegram. In 2nd European Workshop on Usable Secu-
ing previously validated metrics in order to examine whether rity (EuroUSEC). Internet Society, NDSS Symposium,
there are important differences in attitudes between users of 2017.
different smartphone and smart-speaker platforms. Using a
quasi-representative sample, we found no differences in atti- [5] Omer Akgul, Wei Bai, Shruti Das, and Michelle L.
tudes among these groups. However, we found that Android Mazurek. Evaluating In-Workflow Messages for Im-
users tend to have more security and privacy knowledge than proving Mental Models of End-to-End Encryption. In
iOS users. We also found that more daily screen time is asso- USENIX Security Symposium, 2021.
ciated with less privacy concern, less skepticism of company
data practices, and less security and privacy knowledge. By [6] Bram Bonné, Sai Teja Peddinti, Igor Bilogrevic, and
comparing our sample to a nationally representative dataset Nina Taft. Exploring decision making with Android’s
from Pew, we can observe that our quasi-representative sam- runtime permission dialogs using in-context surveys. In
ple has similar skepticism to the general U.S. population, Thirteenth Symposium on Usable Privacy and Security
but more security and privacy knowledge. These results can (SOUPS 2017). USENIX Association, July 2017.
provide guidance for designing — and context for interpret-
ing — future studies on technology platforms. [7] Hamparsum Bozdogan. Model Selection and Akaike’s
Information Criterion (AIC): The General Theory and
Its Analytical Extensions. Psychometrika, 1987.
7 Acknowledgments
[8] Alex Braunstein, Laura Granka, and Jessica Staddon.
The authors would like to thank participants who took part Indirect Content Privacy Surveys: Measuring Privacy
in our survey as well as the anonymous reviewers for con- Without Asking About It. SOUPS 2011 - Proceed-
structive comments and suggestions. This paper results from ings of the 7th Symposium on Usable Privacy and Se-
the SPLICE research program, supported by a collaborative curity, 2011. https://dl.acm.org/doi/10.1145/
award from the National Science Foundation (NSF) SaTC 2078827.2078847.
10[9] Pern Hui Chia, Yusuke Yamamoto, and N. Asokan. Is [19] Thomas Groß. Validity and Reliability of
this App Safe? A Large Scale Study on Application the Scale Internet Users’ Information Privacy
Permissions and Risk Signals. In Proceedings of the Concern (IUIPC). PETs Symposium, 2020.
21st International Conference on World Wide Web, 2012. https://petsymposium.org/2021/files/papers/
issue2/popets-2021-0026.pdf.
[10] Erika Chin, Adrienne Porter Felt, Vyas Sekar, and David
Wagner. Measuring User Confidence in Smartphone [20] Friedrich M. Götz, Stefan Stieger, and Ulf-Dietrich
Security and Privacy. SOUPS ’12. Association for Com- Reips. Users of the main smartphone operating systems
puting Machinery, 2012. https://doi.org/10.1145/ (iOS, Android) differ only little in personality. PLOS
2335356.2335358. ONE, 2017. https://doi.org/10.1371/journal.
pone.0176921.
[11] Jacob Cohen. Statistical Power Analysis for the Behav-
ioral Sciences. Academic Press, 2013. [21] Marian Harbach, Alexander De Luca, Nathan Malkin,
and Serge Egelman. Keep on Lockin’ in the Free World:
[12] Jayati Dev, Pablo Moriano, and L. Jean Camp. Lessons A Multi-National Comparison of Smartphone Locking.
learnt from comparing WhatsApp privacy concerns Association for Computing Machinery, 2016. https:
across Saudi and Indian populations. In Sixteenth Sym- //doi.org/10.1145/2858036.2858273.
posium on Usable Privacy and Security (SOUPS 2020).
[22] Myles Hollander, Douglas A. Wolfe, and Eric Chicken.
USENIX Association, August 2020.
Nonparametric Statistical Methods, volume 751. John
[13] Serge Egelman, Marian Harbach, and Eyal Peer. Behav- Wiley & Sons, 2013.
ior Ever Follows Intention? A Validation of the Security [23] Iulia Ion, Niharika Sachdeva, Ponnurangam Ku-
Behavior Intentions Scale (SeBIS). In Proceedings of maraguru, and Srdjan Čapkun. Home is Safer than the
the 2016 CHI Conference on Human Factors in Com- Cloud! Privacy Concerns for Consumer Cloud Storage.
puting Systems, 2016. In Proceedings of the Seventh Symposium on Usable
[14] Serge Egelman and Eyal Peer. Scaling the Security Privacy and Security, SOUPS ’11. Association for Com-
Wall: Developing a Security Behavior Intentions Scale puting Machinery, 2011. https://doi.org/10.1145/
(SeBIS). In Proceedings of the 33rd Annual ACM 2078827.2078845.
Conference on Human Factors in Computing Systems. [24] Ronald Kainda, Ivan Flechais, and Andrew William
Association for Computing Machinery, 2015. https: Roscoe. Usability and security of out-of-band chan-
//doi.org/10.1145/2702123.2702249. nels in secure device pairing protocols. In Proceedings
of the 5th Symposium on Usable Privacy and Security,
[15] Pardis Emami Naeini, Henry Dixon, Yuvraj Agarwal,
2009.
and Lorrie Cranor. Exploring How Privacy and Security
Factor into IoT Device Purchase Behavior. In CHI [25] Ruogu Kang, Stephanie Brown, Laura Dabbish, and Sara
’19: Proceedings of CHI Conference on Human Factors Kiesler. Privacy Attitudes of Mechanical Turk Workers
in Computing Systems, 2019. https://dl.acm.org/ and the U.S. Public. In 10th Symposium On Usable
doi/10.1145/3290605.3300764. Privacy and Security (SOUPS 2014). USENIX Associa-
tion, 2014. https://www.usenix.org/conference/
[16] Cori Faklaris, Laura A. Dabbish, and Jason I. Hong. soups2014/proceedings/presentation/kang.
A Self-Report Measure of End-User Security Atti-
tudes (SA-6). In Fifteenth Symposium on Usable Pri- [26] Patrick Kelley. Privacy, measurably, isn’t dead. USENIX
vacy and Security (SOUPS 2019). USENIX Associa- Association, February 2021.
tion, 2019. https://www.usenix.org/conference/ [27] Jennifer King. How Come I’m Allowing Strangers
soups2019/presentation/faklaris. to Go Through My Phone? Smartphones and Privacy
[17] Adrienne Porter Felt, Kate Greenwood, and David Wag- Expectations. SSRN Electronic Journal, 2012.
ner. The Effectiveness of Application Permissions. In [28] Arun Kumar, Nitesh Saxena, Gene Tsudik, and Ersin
2nd USENIX Conference on Web Application Develop- Uzun. A comparative study of secure device pairing
ment (WebApps 11). USENIX Association, June 2011. methods. Pervasive and Mobile Computing, 2009.
[18] Joseph A. Gliem and Rosemary R. Gliem. Calculat- [29] Deepak Kumar, Riccardo Paccagnella, Paul Murley, Eric
ing, Interpreting, and Reporting Cronbach’s Alpha Re- Hennenfent, Joshua Mason, Adam Bates, and Michael
liability Coefficient for Likert-Type Scales. Midwest Bailey. Skill squatting attacks on Amazon Alexa. In
Research-to-Practice Conference in Adult, Continuing, 27th USENIX Security Symposium (USENIX Security
and Community Education, 2003. 18). USENIX Association, August 2018.
11[30] Ponnurangam Kumaraguru and Lorrie Cranor. Pri- Security, 2013. https://doi.org/10.1016/j.cose.
vacy indexes : A Survey of Westin’s Studies. 2012.11.004.
2005. https://www.cs.cmu.edu/~ponguru/CMU-
ISRI-05-138.pdf. [40] Eyal Peer, Laura Brandimarte, Sonam Samat, and
Alessandro Acquisti. Beyond the Turk: Alternative plat-
[31] Imane Lamiche, Guo Bin, Yao Jing, Zhiwen Yu, and Ab- forms for crowdsourcing behavioral research. Journal
denour Hadid. A continuous smartphone authentication of Experimental Social Psychology, 2017.
method based on gait patterns and keystroke dynam-
ics. Journal of Ambient Intelligence and Humanized [41] Adrian Perrig and Dawn Song. Hash visualization: A
Computing, 2019. new technique to improve real-world security. In Inter-
national Workshop on Cryptographic Techniques and
[32] Josephine Lau, Benjamin Zimmerman, and Florian
E-Commerce, volume 25, 1999.
Schaub. Alexa, are you listening? Privacy percep-
tions, concerns and privacy-seeking behaviors with [42] Sören Preibusch. Guide to measuring privacy concern:
smart speakers. Proc. ACM Hum.-Comput. Interact., Review of survey and observational instruments. Inter-
2(CSCW), November 2018. national Journal of Human-Computer Studies, 2013.
[33] Jialiu Lin, Bin Liu, Norman Sadeh, and Jason I. Hong.
Modeling users’ mobile app privacy preferences: Restor- [43] Lina Qiu, Alexander De Luca, Ildar Muslukhov, and
ing usability in a sea of permission settings. In 10th Konstantin Beznosov. Towards understanding the link
Symposium On Usable Privacy and Security (SOUPS between age and smartphone authentication. In Proceed-
2014). USENIX Association, July 2014. ings of the 2019 CHI Conference on Human Factors in
Computing Systems, 2019.
[34] Bin Liu, Mads Schaarup Andersen, Florian Schaub,
Hazim Almuhimedi, Shikun (Aerin) Zhang, Norman [44] Prashanth Rajivan and Jean Camp. Influence of privacy
Sadeh, Yuvraj Agarwal, and Alessandro Acquisti. Fol- attitude and privacy cue framing on Android app choices.
low My Recommendations: A Personalized Privacy As- In Twelfth Symposium on Usable Privacy and Security
sistant for Mobile App Permissions. In Twelfth Sympo- (SOUPS 2016). USENIX Association, 2016. https:
sium on Usable Privacy and Security (SOUPS 2016). //www.usenix.org/conference/soups2016/
USENIX Association, June 2016. workshop-program/wpi/presentation/rajivan.
[35] Naresh K. Malhotra, Sung S. Kim, and James Agarwal. [45] Elissa M. Redmiles. "Should I worry?" A cross-
Internet Users’ Information Privacy Concerns (IUIPC): cultural examination of account security incident re-
The Construct, the Scale, and a Causal Model. Informa- sponse. CoRR, abs/1808.08177, 2018. http://arxiv.
tion Systems Research, 2004. https://doi.org/10. org/abs/1808.08177.
1287/isre.1040.0032.
[46] Elissa M. Redmiles, Sean Kross, and Michelle L.
[36] Nathan Malkin, Joe Deatrick, Allen Tong, Primal Wi- Mazurek. How well do my results generalize? Compar-
jesekera, Serge Egelman, and David Wagner. Privacy ing security and privacy survey results from mturk, web,
Attitudes of Smart Speaker Users. Proceedings on Pri- and telephone samples. In 2019 IEEE Symposium on
vacy Enhancing Technologies, 2019. Security and Privacy (SP). IEEE, 2019.
[37] Philipp Markert, Daniel V. Bailey, Maximilian Golla,
[47] Elissa M. Redmiles, Ziyun Zhu, Sean Kross, Dhruv
Markus Dürmuth, and Adam J. Aviv. This pin can be
Kuchhal, Tudor Dumitras, and Michelle L. Mazurek.
easily guessed: Analyzing the security of smartphone
Asking for a Friend: Evaluating Response Biases in
unlock pins. In 2020 IEEE Symposium on Security and
Security User Studies. CCS ’18. Association for Com-
Privacy (SP). IEEE, 2020.
puting Machinery, 2018. https://doi.org/10.1145/
[38] Kristopher Micinski, Daniel Votipka, Rock Stevens, 3243734.3243740.
Nikolaos Kofinas, Michelle L. Mazurek, and Jeffrey S.
Foster. User interactions and permission use on Android. [48] Lena Reinfelder, Zinaida Benenson, and Freya
In Proceedings of the 2017 CHI Conference on Human Gassmann. Differences between Android and iPhone
Factors in Computing Systems, 2017. Users in Their Security and Privacy Awareness. In
Proceedings of the 11th International Conference
[39] Alexios Mylonas, Anastasia Kastania, and Dimitris on Trust, Privacy and Security in Digital Business.
Gritzalis. Delegate the smartphone user? Security Springer, 2014. https://link.springer.com/
awareness in smartphone platforms. Computers & chapter/10.1007/978-3-319-09770-1_14.
12You can also read