Competing for Survival: A Turnaround of Department Store J.C. Penney
←
→
Page content transcription
If your browser does not render page correctly, please read the page content below
Columbia) Business)School                     Caroline)Baier Jensen
Turnaround) Management                     Emma) Caroline) Jaksland
Final) Project                        Madelon)K.)Grandjean)Poulsen
Professor)Doug)Squasoni                 Mikkel Holst)Schou Hansen
December) 15,)2017                               Marc)Faarborg Toft

                         Competing for Survival:
     A Turnaround of Department Store J.C. Penney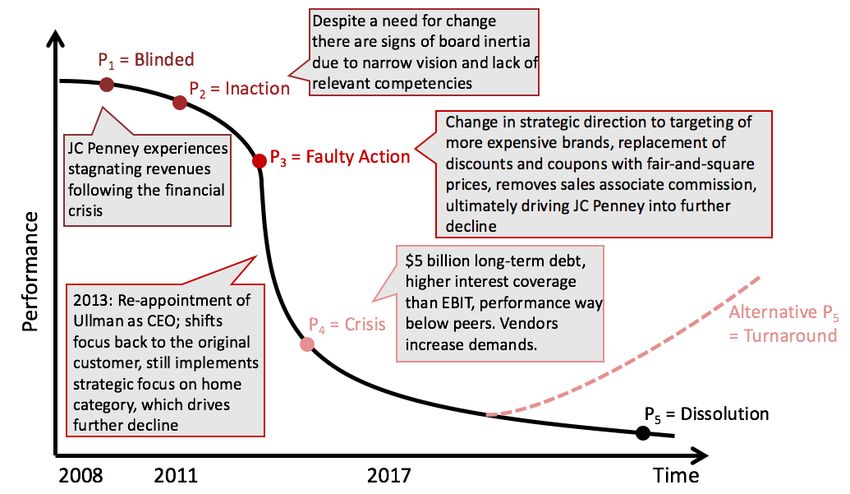
Competing for Survival:
                                                                            A Turnaround of
                                                               Department Store J. C. Penney

Executive)summary                                       Stock)price)development
This p aper is c ent ered around J.C. P enney, an      250     Index)100)in)2007
Am erican r et ailer oper ating mor e than 1,000
departm ent stor es across th e country. More          200
specifically, th e focus is on th e financial and
operation al issu es facing th e comp any which has    150
led to d eclining revenues and the incurrenc e of
losses over the past five years.                       100
The analysi s b egins with an overvi ew of the
company and th e industry within which it              50
operat es. It is evident that th e entire industry
has b een under pr essur e du e to changing             0
                                                              2007))))))))2009))))))))2011))))))))2013))))))))2015))))))2017
dynamics such as the gro wing popularity of
online shopping as w ell as a gen eral increase in      General industry decline evident from stock
competition, consequently er oding m argins and         price performance of four players. J.C. Penney
profitability. To improve the quality of any            is clearly performing the worst, approaching
suggested r ecomm end ations, both qualitative          index 7 in December 2017
and quantitative tools are u sed in the p ap er. In
the financial an alysis it is discover ed th at         Key)industry) metric)
although mo st ret ailers have felt a growing            Sales)per)retail)sq.)feet
pressur e on th eir oper ations, J.C. P enn ey seems                                                                           498)

to have b een affected th e mo st. Th e company
thereb y und erp erforms in r elation to its m ain
peers both in t erm s o f efficiency and                                                 224)           198
profitability, while simultaneou sly facing a                              121)
growing d ebt burden th at cannot b e su stain ed in
the long run. Th e cau ses for this declining
perfor manc e ar e sou ght through an ex amination
of th e compan y’s op erational and strat egic          JCP ranks significantly below its peers in terms
activities, wh er e man agem ent turbul ence and        of sales per retail square feet emphasizing the
                                                        need for store closures to improve this metric
wrongful strat egic initiatives ar e highlighted as
contributing factors to J.C. P enney’s declining
perfor manc e. A turn around strat egy is propo sed     Turnaround) strategy
with highlights b eing stor e closur es and a
growing online pr esenc e to en sure both bottomQ                                                    Distribution

and top line gro wth going forw ard. Finally,
                                                                                  Revenue            Products
sever al valuations ar e conducted t o ex amine
wheth er the company should i) be liquidated, ii)                                                    Service
                                                               EBITDA)
be sold in an M&A proc ess, or iii) continue as a            Improvement

going conc ern. Th e mo st valueQcr eating option to                                                 Costs) related) to) physical)
                                                                                                     space
debt and equity holder s is to keep th e company                                     Costs

as a going conc ern while implem enting n ec essary                                                  Inventory) management

turnaround initiatives to place J.C. Penn ey on a        Turnaround strategy aimed at increasing J.C.
trajectory of growth and profitability.                  Penney’s bottomQ and top line growth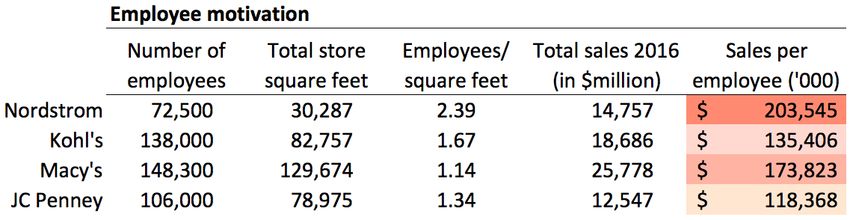
Table of Contents
1. Introduction ............................................................................................................................ 1
2. Company Overview ................................................................................................................. 2
   2.1 Key Company Facts ......................................................................................................................... 2

3. Peer Comparison ..................................................................................................................... 3
   3.1 Non-Financial Peer Analysis ............................................................................................................ 3
   3.2 Financial Comparison...................................................................................................................... 3
      3.2.1 Operational Analysis ........................................................................................................................ 4
      3.2.2 Analysis of Capital Structure and Liquidity ...................................................................................... 6

4. Causes of Decline..................................................................................................................... 7
   4.1 Management Failure ...................................................................................................................... 7
   4.2 Corporate Governance.................................................................................................................... 9
   4.3 Organizational Distress Curve ....................................................................................................... 10

5. Options Available for JC Penney ............................................................................................ 11
   5.1 Liquidation ................................................................................................................................... 11
      5.1.1 Waterfall Analysis .......................................................................................................................... 12
   5.2 Chapter 11 Filing ........................................................................................................................... 13
   5.3 Turnaround Strategy..................................................................................................................... 14
      5.3.1 Corporate Strategy ........................................................................................................................ 15
      5.3.2 Organizational Arrangements ........................................................................................................ 19
      5.3.3 Financial Changes .......................................................................................................................... 20
   5.4 Valuation ...................................................................................................................................... 21
      5.4.1 Base Case Assumptions ................................................................................................................. 21
      5.4.2 Restructuring Assumptions ............................................................................................................ 22
      5.4.3 M&A Analysis ................................................................................................................................. 24

6. Recommendation .................................................................................................................. 28
7. Conclusion ............................................................................................................................. 29
Bibliography .............................................................................................................................. 31
Exhibits ..................................................................................................................................... 35
1. Introduction
The retail landscape is projected to change more within the next five years than it has done over
the past century (MacKenzie, et al., 2013). Looking not only at department stores, but at the retail
space in general, the first seven months of 2017 saw 19 bankruptcies, surpassing the record of 18
filings during 2009 (Thomas, 2017).
Some attribute the declining performance of retailers to the growing importance of online shopping
while others view it as a market correction for those chains that were not properly equipped to
compete in the industry in today’s competitive environment. All, however, agree that the concept
of a department store as we know it, is about to change (Cohen, 2017).
The department store industry has been in decline for the past five years, and this trend is expected
to continue with revenue projected to fall at a rate of 4% annually to $156.4 billion in 2017 (Cohen,
2017). Annual growth between 2017 and 2020 is furthermore expected to fall -2.6% (Statista,
2017a). Cohen (2017) projects that the average industry profit margin will be 2.6% in 2017, a decline
of 1.4 percentage points from 2012. In addition to declining sales, brick-and-mortar stores incur high
operational cost, relative to online competitors, primarily due to salaries and retail space. Trends
among physical department stores are lower prices, higher frequency of promotions and more
funds allocated to marketing and advertising.
In the past decade, brick-and-mortar stores have followed the growth formula of opening stores to
acquire and service more customers (MacKenzie, et al., 2013). This growth strategy, however, is no
longer valid as consumer purchasing decisions have changed dramatically. Previously, a customer’s
purchase decision process started with choosing a store and then selecting a product in that store.
This is in line with the design of department stores, who choose brands relevant to their target
customer group. However, consumers now research online before going to the stores reducing the
need for assistance in the shopping process. Customers are thereby taking charge of the initial
screening of brands, making the value proposition of department stores obsolete to a certain extent.
Department stores also face the challenge of shifting consumer preferences, as shoppers de-select
traditional brands in favor of non-traditional, startup brands, which are rarely present in large
department stores (Roeder & Rupp, 2017).
In addition, customers are using their smartphones to benchmark prices, get input from social media
and friends and family - and when they are ready to buy; numerous online retailers create and
increase price transparency in the market, to the detriment of physical stores (Baird, 2017). In
addition, online retailers deliver products directly to the end consumer, often within the same day.
Going forward, five trends are considered significant in winning a dominant position in the retail
market, including demographic changes, multichannel and mobile commerce, personalized
1marketing, the distribution revolution, and emerging retail business models (MacKenzie, et al.,
2013).
All of the above elements present traditional department store retailers such as J.C. Penney
(hereinafter, JCP) with a significant challenge. Major players in the industry are Kroger, Macy´s,
Nordstrom, Kohl’s, and JCP, the latter being the subject of analysis in this paper. The following
section will give an introduction to JCP and the challenges it is facing in these turbulent times in a
challenging industry.
2. Company Overview
2.1 Key Company Facts
James Cash Penney and William Henry McManus founded JCP in 1902, and it has since then become
one of the largest department store chains in the US, operating 1,013 locations across the country
and employing 106,000 people. Currently, JCP’s headquarters are located in Plano, Texas where the
company is led by CEO Marvin Ellison. JCP targets low- and mid-income households selling
merchandise within the following segments: clothing, cosmetics, electronics, footwear, furniture,
housewares, jewelry and appliances. As a part of a recent growth strategy, the company has divided
key operations into three pillars i) beauty, ii) home refresh, and iii) special sizes. The company holds
both national- and private-label brands. As of 2016, private-label brands accounted for 44% of sales
(J.C.Penney 10K, 2016).
Over the past couple of years, JCP has experienced financial problems. Prior to 2011, the growth of
JCP was stagnating for two decades, which made the board hire Ron Johnson from Apple as the
company’s new CEO. Ron Johnson tried to implement radical changes by going away from coupons,
sales and discounts, and more towards every day “fair and square” low prices. However, this was
not received well by customers. After 16 months, with Ron Johnson as CEO, sales had declined more
than 25%, and the stock price had decreased by almost 50%. This further resulted in a round of
layoffs, with 19,000 people losing their jobs. From 2011 to 2015 JCP experienced five straight losing
years, which amounted to a $3.5bn loss in the period (Isidore, 2017).The company still faces several
challenges; revenue is declining, debt obligations amount to nearly $3,6 billion, and the company
has high operational cost relative to e-commerce competitors who continue to win market share.
Because of a liquidation of poorly selling inventory, especially in the apparel division, and the closing
of 127 of the least profitable stores, JCP managed to generate a $1 million adjusted EBITDA in 2016,
which is the first shadow of profitability in six years. This was, among other elements, a result of the
growing focus on private labels, all with a higher gross margin than brands not a part of the JCP
umbrella. This, combined with the company´s high brand awareness and a large product portfolio,
poses opportunities for the organization going forward. For a complete list of strengths,
weaknesses, opportunities and threats cf. SWOT-analysis in Exhibit 1.
23. Peer Comparison
3.1 Non-Financial Peer Analysis
Although multiple department stores are appropriate for comparison, including Sears, Target, and
Wal-Mart, the peer review is narrowed down to focus on Kohl’s, Macy’s, and Nordstrom, since these
are the most similar to JCP and frequently cited as peers in broker research. JCP considers Kohl’s its
closest competitor (Ofek, et al., 2016). However, as Chief Information Officer Therace Risch notes,
“our customers tend to be more similar to those of other mid-tier department stores, but anyone
that sells the same stuff we do is a threat” (Ibid). Kohl’s, Macy’s, and Nordstrom are the most
relevant for JCP, since they offer similar products, their customers are influenced by similar broad
economic trends, and their operations are mostly domestic. Therefore, these three peers will
provide an indication of JCP’s ability to tackle the challenges of the business in which they operate.
Comparing JCP to the three peers in terms of qualitative measures shows that JCP scores at the
bottom of the peer group, except in shopper satisfaction. Table 1 summarizes the comparison on
four parameters; overall experience, e-commerce experience, shopper satisfaction, and brand
reputation (additional parameters are found in Exhibit 2.
Table 1: Qualitative peer comparison
Overall' E.commerce' Shopper' Brand'
Experience Experience Satisfaction Reputation
Nordstrom 81 82 82 75.58
Kohl's 80 79 77 75.04
Macy's 78 79 73 72.4
JCperformance of JCP can be attributed to industry- rather than firm-specific effects? This will be
examined in the following section through an analysis of the financial performance of JCP and its
peers.
3.2.1 Operational Analysis
Table 2 illustrates the development in the net income of JCP and its peers and yields several insights.
All peers have experienced declining profits evident from a negative CAGR of around 13% to 17% in
the period 2012 to 2016 thus supporting the thesis that the entire industry is facing challenges.
However, while the other companies have managed to generate profits, JCP has incurred losses
throughout most of the period only turning a slight profit in 2016 of $1 million.
Table 2: Development in net income (USD million)
Net income 2012 2013 2014 2015 2016 CAGR
J.C. Penney (985) (1,388) (771) (513) 1 n.m.
Kohl's 986 889 867 673 556 -13.3%
Macy's 1,335 1,486 1,526 1,072 619 -17.5%
Nordstrom 735 734 720 600 354 -16.7%
To examine potential sources of this negative and declining net income it is useful to break
profitability into its subcomponents illustrated in table 3.
Table 3: Profitability ratios
Profitability ratios JCP Kohl's Macy's Nordstrom Average
Gross margin 35.67% 36.08% 39.40% 40.40% 37.89%
EBITDA margin 7.36% 12.35% 10.63% 11.08% 10.36%
EBIT margin 2.51% 7.33% 6.53% 6.71% 5.77%
Profit margin 0.01% 2.98% 2.40% 2.40% 1.95%
JCP performs the worst out of all its peers on all four profitability ratios thus indicating that the
company either has too high costs or fails to charge sufficiently high prices. From table 4 it is evident
that JCP has a cost/sales level above average in all four categories which implies that one source of
declining profitability is the company’s costs.
Table 4: Cost ratios
Cost ratios J.C. Penney Kohl's Macy's Nordstrom Average Difference from average
COGS/Sales 64.33% 63.92% 60.60% 59.60% 62.1% 2.22%
SG&A/Sales 28.35% 23.73% 28.21% 29.32% 27.40% 0.95%
D&A/Sales 4.85% 5.02% 4.10% 4.37% 4.59% 0.27%
Interest/Sales 2.79% 1.66% 1.42% 0.83% 1.68% 1.11%
4A key metric used in the retail industry is sales generated per retail square feet and as evident by
figure 1, JCP ranks significantly below all peers on this parameter.
Figure 1: Key industry metrics
Source: Factset (2017)
The company generated $121 per retail square feet in 2016 compared to Kohl’s and Nordstrom who
generated $224 and $498 respectively. This implies that JCP does not generate sufficient revenue
to justify the 1,013 stores it is currently operating, making it imperative to close down those that
fail to generate sufficient revenue and profits. The company is already in the process of closing down
stores but the low revenue per sq ft implies that additional closures are necessary to further
improve profitability beyond the minimal $1 million.
In terms of the efficiency of JCP’s activities the focus is on the company’s asset turnover as well as
its inventory management. There tends to be a trade-off between efficiency and profitability as
companies are either high-margin, low-volume businesses or the opposite. Due to the lower
margins of JCP, one would expect the firm to outperform its peers in terms of efficiency. JCP,
however, ranks below average in terms of asset turnover which is the sales generated per unit of
assets. This is in line with the low revenue per store, and the company could therefore improve its
efficiency by closing down inefficient shops. In terms of inventory management the company has
112 days inventory outstanding which is below that of Macy’s but above its two other peers,
Nordstrom and Kohl’s. The decision to remove sales and implement ‘fair and square’ low prices had
a negative effect on the company’s sales and might have resulted in the firm being left with obsolete
inventory.
Table 5: Efficiency ratios
Efficiency ratios J.C. Penney Kohl's Macy's Nordstrom Average
Asset turnover 1.26 1.33 1.23 1.74 1.39
Inventory turnover 3.23 3.28 3.03 5.13 3.67
Days inventory 112.97 111.24 120.60 71.11 103.98
5To summarize the operational performance of JCP, the company appears to be lacking behind its
peers both in terms of the efficiency and the profitability of its operations.
3.2.2 Analysis of Capital Structure and Liquidity
The liquidity of JCP has also been analyzed to examine whether the company faces any short or
long-term risks as a result of its capital structure. The firm has a decent current-ratio but this ratio
could be distorted by obsolete inventory. The company’s quick ratio is, however, also above those
of Macy’s and Kohl’s only lagging behind that of Nordstrom, and these ratios do therefore not raise
any substantial concerns. The interest coverage ratio of 0.90 is, however, highly problematic as it
implies that the company’s interest payments are almost as large as its operating profit thus
increasing the risk of breaking covenants or triggering a bankruptcy filing. JCP ranks far behind the
ratios of its peers and reducing the level of debt of the company must therefore be emphasized.
JCP’s extensive interest payments are caused by a significant accumulation of debt, and this is first
of all reflected in a long-term debt ratio of 51% compared to the industry average of 38%. JCP
furthermore has a debt/equity ratio of 3.11 compared to an average of 1.80 implying that the
company is mainly financed by debt rather than equity thus increasing the risk of bankruptcy.
Table 6: Short- and long-term liquidity ratios
ST liquidity ratios J.C. Penney Kohl's Macy's Nordstrom Average
Current ratio 1.79 1.93 1.45 1.44 1.65
Quick ratio 0.48 0.39 0.39 0.70 0.49
Interest coverage 0.90 4.40 4.59 8.11 4.50
LT liquidity ratios J.C. Penney Kohl's Macy's Nordstrom Average
LT debt ratio (LTD/TA) 51% 33% 34% 35% 38%
D/E ratio 3.11 0.80 1.48 1.79 1.80
TA/TL 1.19 5.03 1.30 1.24 2.19
Cash ratios J.C. Penney Kohl's Macy's Nordstrom Average
CFO to current liabilities 14.4% 77.1% 32.0% 57.7% 45.3%
Cash / current assets 26.6% 19.6% 21.0% 17.3% 21.1%
Cash/current liabilities 47.7% 37.9% 30.4% 24.9% 35.2%
Cash /total liabilities 13.3% 12.8% 10.6% 10.4% 11.8%
To avoid focusing solely on accruals it is sensible to examine the company’s ability to generate cash
and the probability of any cash shortages occurring. A frequently used measure in this category is
the cash flow from operations to current liability ratio, and this also is illustrated in table 6. A
benchmark for a healthy mature firm is around 40% which both Kohl’s and Nordstrom satisfy (Wiel,
et al., 2012). JCP and Macy’s, however, have ratios far below this benchmark with JCP performing
the worst implying that the company is not generating sufficient cash to satisfy its liabilities. In
6contrast, upon examination of the other cash ratios, JCP appears to have a high level of cash on its
balance sheet with a higher cash as a percentage of assets and liabilities than all its peers.
A key takeaway from the financial analysis of JCP is that although the company currently has a
reasonable asset base and a substantial level of cash to service interest payments, the high level of
leverage and correspondingly high interest payments, almost exceeding the company’s EBIT, are
not sustainable in the long run.
4. Causes of Decline
4.1 Management Failure
Mike Ullman headed the company from 2004 to 2011 (Ofek, et al., 2016). Towards the end of his
tenure, JCP was underperforming materially relative to its peers. The company performed
significantly below all peers in terms of ROA, ROE, EBITDA margin, profit margin, and interest
coverage ratio in 2011 as illustrated in Exhibit 3.
Activist hedge fund managers Bill Ackman and Steven Roth acquired 27% of the company in 2010.
Both were given seats on JCP’s board, and Ackman prompted the firing of long-time CEO Mike
Ullman (Subramanian, 2015). He endorsed his replacement, Ron Johnson, in 2011, to then re-hire
Ullman sixteen months later and then, again, push for his replacement. The following presents an
analysis of the leadership of JCP starting with the arrival of Ron Johnson.
Within a year of taking over as CEO, Ron Johnson had replaced the chief financial officer, chief
operating officer, chief technology officer, chief marketing officer, and chief talent officer (Bhasin,
2012). It is certainly advisable for a turnaround manager to scan the existing management team for
members who unceasingly work against the new agenda, but a complete switch-up of the C-suite
could eliminate valuable experience and insight, and feed alienation between the new strategy and
the remainder of the existing organization.
One of Johnson’s strategic fiascos was the replacement of frequent price discounts and promotions
without prior testing on how the existing customer base would respond. In 2012, the average
discount on sold products reached 60 percent (Ofek, et al., 2016) Discounts were replaced with
everyday low pricing through the ‘Fair and Square’ campaign, and higher-end product lines and
designer collaborations were added. Johnson removed sales commissions with the intention of
increasing customer focus and decreasing focus on sales (and, one could speculate, to increase the
distressed bottom line), a step which frustrated many employees (Ibid).
Despite double-digit decreases in sales, stores which had been updated according to Johnson’s
strategy performed relatively better than those which had not. Some have since argued that the
strategic overhaul, which catered to a rather different customer, was not given enough time to
cultivate properly (Ofek, et al., 2016). Ackman, who hired Johnson to replace Ullman, cited ‘too
7much change too quickly without adequate testing on what the impact would be’ as the reason
behind the failure of Johnson’s strategy, which Ackman described as ‘very close to a disaster’
(Wapner, 2013). Strategic failure under Johnson appears to have been an issue of inhabiting the
wrong focus: while Johnson certainly showed exceeding competence in past endeavours, he was
steel-set on a focus on the wrong customer – a move, which culminated in confusion among existing
customers about what JCP stood for.
While strategic failure may have contributed greatly to JCP’s demise under Johnson, several sources
suggest that a lack of buy-in from the organization also affected the turnaround process adversely.
Johnson had a very clear group of a few executives whom he confided in. Employees complained
about lack of communication and transparency from Ron Johnson’s management team. As an
example, store managers only had access to their own sales numbers whereas relative store
performance was kept under wraps. Bhasin (2013a) points towards Johnson’s past at Apple, a
company where confidentiality is key for very sensible reasons, as a potential part of the
explanation. But at JCP, the move towards opacity resulted in loss of trust in management.
According to Covert (2013), Johnson and eight other executives continued Ullman’s practice and
commuted from their homes in other states to JCP’s headquarters by corporate jet. Johnson was
rarely in town for the entire workweek, and stayed at the Ritz-Carlton hotel on the company’s bill
when he was. The use of corporate jets and luxury hotels during times of cutbacks and lay-offs
creates a vivid contrast and may signal that top management has no interest in “sharing the pain”.
The perceived distance created as a result likely hurt buy-in from the rest of the organization which,
due to the issues of lacking transparency, were already subject to a stark communicational
hierarchy. The rapid spread of rumors (surrounding, among other things, new rounds of lay-offs,
eliminations of certain positions, and shut-downs of divisions and stores) also ultimately created an
environment of uncertainty, distrust, and insecurity. Lastly, Tuttle (2013) notes that Johnson had
difficulties relating to and appeared to have little respect for JCP’s existing customer base. For
example, he publically suggested that customers needed to be ‘educated’ when they did not
respond well to the new ‘fair and square’ pricing strategy. Mike Kramer was carried over from Apple
by Ron Johnson, taking the position as COO at JCP. Kramer was quoted in in the Wall Street Journal
in 2013, describing the JCP culture at the beginning of his tenure: ‘I hated the JC Penney culture, it
was pathetic’ suggesting that JCP’s headquarters were ‘overstaffed and underproductive’ (Bhasin,
2013b). The demeaning rhetoric with which the new C-suite described the JCP culture was another
likely source of alienation between “old” and “new”.
When Ullman returned in 2013, he moved the focus back to the preceding JCP customer and
reinstated hefty discounts. Large losses were incurred again in 2013, when Home Stores, as
overhauled by Johnson at higher price points, were established and did not resonate well with
customers (Ofek, et al., 2016). In 2015, Ullman handed over the reins to current CEO Marvin Ellison
marking the transition towards better management practices. Ellison makes a point out of visiting
JCP stores as often as possible, and all senior management is expected to do the same. When visiting
8stores, they are required to dress in the company’s clothing lines to eliminate visual culture clashes
(Ibid). Ellison tells the tale of his childhood in a blue-collar family, where the bi-annual visit to JCP
was something the entire family looked forward to (Wahba, 2016). Ellison appears to relate to and
target the present JCP customer, while making a clear point of attempting to elicit buy-in from all
levels of the organization by being present and available and compelling all top management to do
the same.
On July 10th, it was announced that JCP’s CFO Edward Record would step down (Rupp, 2017). CFO
resignation is often a red flag in distressed companies, taken to imply that things may be headed for
the worse. His replacement, Jeffery Davis, is the seventh person inhabiting the CFO role (including
interim) in the past six years.
Figure 2: CEO and CFO turnover, 2000-2017
2000 2004 2011 2012 2013 2014 2015 2016 2017
Allen(Questrom
CEO Mike(Ullman
Ron(Johnson
Marvin(Ellison
Robert(Cavanaugh
Michael(
CFO Ken(
Dastugue Edward(
Hannah Jeffrey(Davis(
Record
Interim(CFO:( Interim(CFO:(
Mike(Kramer Andrew(S.(Drexler
4.2 Corporate Governance
Past board member and activist hedge fund manager Bill Ackman largely received the blame as
catalyst for the decline that followed the implementation of Ron Johnson’s strategy. But in a 60-
Minutes interview, he highlighted that all other board members were unavoidably complicit, too.
When Ron Johnson took over in 2011, the composition of JCP’s board certainly had room for
improvement in terms of the relevance of their competencies. With an overweight within
electronics, technology, and logistics, none had extensive direct experience within the retail sector
(JCP, 2011). Narrow vision on their areas of expertise could be to blame for their inaction and limited
involvement.
Under the absence of a poison pill, Roth and Ackman were only required to disclose their acquisition
of 27% of the company in 2010 within 10 days of the acquisition as per SEC rules (Subramanian,
2015). In 2013, the company instituted a poison pill with a 10% threshold, which was extended and
lowered to 4.9% in 2014. The move was intended to prevent hostile takeovers and ensure
preservation of the company’s net operating loss carryforwards (NOLs) of $2.2 billion (Wahba &
9Cavale, 2014; JCP, 2016). If the company’s best shot at survival turns out to involve putting itself up
for sale, the poison pill would of course have to be altered. Potential loss of NOLs is an important
consideration in any scenario where a change of control may occur.
4.3 Organizational Distress Curve
Often a catalyst for the initial decline of a company is the simultaneous occurrence of negative
internal and external forces. In the case of JCP, the internal factors largely revolve around
management failure consisting of high CEO turnover and faulty strategic initiatives coupled with
declining financial performance, ultimately leading to a company split into separate layers that do
not work together. The negative external impact on JCP is attributed to the increased pressure on
all department stores because of fierce competition and the growth in online retail. The shifting
business dynamics have affected department stores across the industry, however, it is JCP’s inability
to adjust to this external pressure that has resulted in its decline, which others have mitigated
through swift and efficient strategic responses. The organizational distress curve is a useful tool for
highlighting different stages of JCP’s lifecycle and emphasizing those factors that pushed the
company another stage down the curve.
Figure 3: Organizational Distress Curve
As highlighted previously, it was a general decline and pressure on the entire industry that initiated
JCP’s move down the distress curve. Failure to adapt properly to external shocks (inaction) thereby
resulted in deteriorating profitability, while the appointment of new management, i.e. action, led
to the implementation of value distorting strategies which can be interpreted as faulty action. Today
the company is to some extent in a stage of crisis with extensive leverage and low profitability. To
prevent entering the stage of dissolution several steps are needed, including the definition of a
feasible corporate strategy, appropriate organizational arrangements as well as an adequate
financial structure which can bolster acceptance from capital markets. The following sections
10highlight some of the options available to JCP and evaluate whether the company is worth more
dead (through a bankruptcy filing and liquidation) than alive (as a going restructured concern).
5. Options Available for JC Penney
5.1 Liquidation
The following liquidation analysis is based on balance sheet data from January 2017 (i.e. fiscal year
2016), as these are the most current numbers. Data is not projected, as this would not make sense
during a fire sale. Debt holdings are based on data obtained from JCP’s 10K, 2016. There will most
likely be discrepancies between present day and January asset account figures but these differences
are not assumed to alter the conclusions of the below liquidation analysis materially.
Table 7: Liquidation Analysis
ASSETS (in millions ) Jan. 17 % of BV Valued
Cash Only 887 100% 887
Inventories 2,854 35% 998.9
Other Current Assets 356 30% 106.8
Total Current Assets 4,097 1992.7
Property, Plant & Equipment - Gross 4,599 45% 2069.55
Total Investments and Advances 13 7% 0.91
Intangible Assets 540 10% 54
Other Assets 65 5% 3.25
Total PPE, Intagibles and Others 5,217 2127.71
Total Assets 9,314 4,120
The following presents the assumptions made in the liquidation analysis.
Cash - It is assumed that all cash is recoverable and available for creditors.
Accounts Receivable – Remarkably, JCP has not had any accounts receivable the past three years,
hence the account is not present in the above valuation of the company´s assets.
Inventory - Inventory has been assigned 35% of book value, as inventory is assumed to consist of
clothes, technology and home appliance-products, which tend to be highly seasonal and become
obsolete quickly. JCP holds inventory for “only” 117 days on average which is lower than some of
its peers. In addition, the company’s inventory does not consist of specialized products, meaning
that there would be a large market of potential buyers.
Other Current Assets - No clear information is available for the characteristics of other current
assets, hence a conservative percentile of 10% is implemented.
PPE - The recovery rate for PPE is based on the following considerations: Property is considered the,
by far, largest account among Property, Plant & Equipment. JCP owns 417 of its department stores
and leases the rest. However, the selling price is highly dependent on finding a buyer who is active
within an industry where a lot of retail square footage is required. Cf. introduction, this could
currently pose a problem as the general retail industry currently in decline. Plant and equipment
11should not take up a large proportion of the PPE account, as JCP does not manufacture products
itself. Equipment is merely considered to be cash registers, pallet trucks etc. all deemed to be of
little to no salvage value. On the other hand, Statista, (2017) finds that brick-and-mortar stores will
account for 85% of US retail in 2025, supporting a slightly stronger recovery rate for PPE. It is also
assumed that JCP´s property is located in fairly populated areas which should be attractive for
potential customers, supporting the overall recovery rate. The recovery rate is set at 45%, as it
seems likely that a dominant market player would find many of JCP´s locations attractive.
Total Investments and Advances - Retrieving investments and advances are deemed uncertain,
hence a very conservative percentile of 7% is set for the recovery rate. Some advances could,
however, be attributable to subsidiaries, supporting a rate above 0%.
Intangible Assets – It is assumed that the trademark of JCP and its in-house brands will still have
some value after a liquidation, hence the retrieval rate is set to be 10%.
Other Assets - No clear information is available for the characteristics of other current assets, hence
a conservative 5% recovery rate is applied.
5.1.1 Waterfall Analysis
The purpose of a waterfall analysis is to sort creditors according to their seniority. Further, it
provides an overview of what each creditor could expect to receive in the event of a liquidation,
assuming the pecking order of the absolute priority (AP) rule holds. Creditors in the same group
must be treated equally, according to the pari passu principle, and no one lender can be unfairly
discriminated against relative to its peers. The analysis commences at the top of the seniority ladder,
as per January 2017. JCP has two first lien creditors with a combined claim of $2.16 billion, which
would be satisfied completely in a liquidation. The claim of second lien debt holders is $1.45 billion,
all with different maturities, with the closest upcoming due date in 2018. All second lien creditors
will also recover 100% of their face value. JCP holds $1.04 billion in senior subordinated debt - an
obligation the company will not be able to meet completely in the case of an immediate liquidation.
12Table 8: Creditor Overview and Waterfall Analysis
Creditors Recovery rate Recovery Value Assets Left
First lien Debt
2016 Term Loan Facility $ 1,667 100% $ 1,667
5.875% Senior Secured Notes Due 2023 $ 500 100% $ 500
Total Superprioty and first Lien $ 2,167 $ 2,167 1,953
Seond lien debt
5.75% Senior Notes Due 2018 $ 265 100% $ 265
8.125% Senior Notes Due 2019 $ 400 100% $ 400
5.65% Senior Notes Due 2020 $ 400 100% $ 400
6.375% Senior Notes due 2036 $ 388 100% $ 388
Total Superprioty and secured $ 3,620 $ 1,453 $ 500
Senior Subordinated Debt
7.95% Debentures Due 2017 $ 222 48% $ 106
7.125% Debentures Due 2023 $ 10 48% $ 5
6.9% Notes Due 2026 $ 2 48% $ 1
7.4% Debentures Due 2037 $ 313 48% $ 150
7.625% Notes Due 2097 $ 500 48% $ 239
Total debt $ 4,667 $ 500 $ 0
Less cash and Equivalants $ 887
Net debt $ 3,780
Equity Market Value $ 1,354
Total Enterprise Value 5,134
In the liquidation simulation, first lien- and second lien creditors are satisfied. Senior subordinated
debtors will, however, only retrieve 48% of the face value of their investment. Only equity holders
would be left completely without recovery. Nevertheless, one would expect that senior
subordinated debtors would push for a restructuring before a liquidation, as retrieving less than
50% would not an optimal solution for anyone who perceives that the company could potentially
be saved.
5.2 Chapter 11 Filing
When a company is in distress there are strategic considerations involved in filing for voluntary
Chapter 11. The threat of a bankruptcy alone can be effective: the ‘take it or get nothing’ threat can
be an effective bargaining tool for when creditors, suppliers and employees threaten to exercise
their claims (George, et al., 2012).
While an in-court restructuring has multiple negative implications for a company, there can be
significant benefits to gain from the ability to restore operating cash flows to sustainable levels.
Since any new obligations are given superiority to all other debt obligations under a Chapter 11, JCP
would have easier access to credit. This cash boost can have significant impact on the ability to turn
13operations around (George, et al., 2012). However, management actions may be remarkably
constrained due to court scrutiny, despite the time gained to make decisions and propose a solution
(Ibid).
Besides high costs, lack of control, and the potential of publicizing sensitive information of an in-
court restructuring, what makes a Chapter 11 filing less attractive for JCP is the affiliated
reputational risk that gives rise to skepticism from both downstream and upstream stakeholders.
Vendors are likely to become reluctant to supply products or materials in the fear of not getting
paid, while consumers may be less inclined to buy products that potentially cannot be returned or
serviced in the future. Expensive products with long expected lives which have after-sales service
and embedded guarantees attached will be particularly affected by this reputational risk. Customers
looking for products such as home appliances which are meant to be used for years will likely be
acutely reluctant to buy from a firm in distress, which would be expected to have a discouraging
effect on sales.
An examination of the financials of JCP will facilitate answering the question of whether the firm’s
level of distress indeed qualifies a bankruptcy filing as absolutely necessary. The essential questions
to ask are whether the company faces liquidity problems, and if so, when it will be unable to service
its debt. The next three repayments debt include a debenture of $220 million in 2017, $265 million
of Senior Notes in 2018, and $400 million of Senior Notes in 2019. A quick look at the cash situation
considering the debt levels and performance projections suggests that JCP may be unable to service
the Senior Notes in 2019. However, JCP has already mitigated the threat through a recent
renegotiation of the Wells Fargo revolver of $4 billion, which provides JCP with a temporary option
to use its cash holdings to finance maturing debt, and the revolver to finance operations. But
financing operations through incurring more debt is certainly not a sustainable solution in the long
term. JCP must be able to organically finance their operations through net income growth.
In summary, a strategic Chapter 11 filing would be more appropriate in a situation where cash was
significantly and urgently constrained. Due to the inherent reputational risks bankruptcy could pose
to the JCP brand, bankruptcy should be a last resort. JCP’s current financial situation does not yet
merit the drastic measure. The company should instead assess the probability of a successful out-
of-court turnaround strategy. If the company concludes that another turnaround is unlikely to
succeed, or that industry deterioration is ultimately likely to drive the company into dissolution,
liquidation under Chapter 7 may be more relevant.
5.3 Turnaround Strategy
To convert JCP from a firm in distress into a well-performing entity, three ingredients are needed: i)
a feasible corporate strategy, ii) appropriate organizational arrangements, and iii) acceptance by
14capital markets (Harrigan, 2012). The impact of the following strategic elements on the financials of
JCP are elaborated in section 5.4.
5.3.1 Corporate Strategy
The objective of the turnaround strategy is to bring JCP back to profitability with a strategy that
secures sustainable profits and firm survival in a dynamic market. Included in a feasible corporate
strategy are improvements in operations which involve both cost cutting and revenue generating
initiatives. An important point to keep in mind is that a firm cannot cut its way to growth; it is instead
necessary to invest in top-line growth to make the turnaround sustainable. Elements that improve
JCP’s chances of survival and increase profitability both in the short and long term are suggested.
The turnaround strategy includes actions to both increase revenue and decrease costs, with the
shared purpose of improving the company’s bottom line.
Figure 4: Strategic actions to improve EBITDA
Action
Online(channel Increase(focus(on(online(sales(and(the(omni2channel(experience(
Private(Label( Increase(focus(on(the(Private(Label(to(reap(higher(profit(margin(and(exploit(
Revenue
focus successful(core(segment
Customer( Prioritize(customer(service(to(compete(with(peers(through(sales(associate(
EBITDA( service training(and(optimized(incentive(structure
Improvement
Costs(related(to( Close(unprofitable(stores,(reduce(floor(space,(renegotiate(rental(price(per(
physical(space square(feet,(and(increase(subleasing(rent(price(for(store2within2store(shops((
Costs
Inventory( Improved(inventory(management(to(decrease(inventory(levels(and(
management ultimately(improve(net(income(through(lower(COGS
5.3.1.1 Revenue Generating Actions
For JCP to secure its long-term survival trough growth it should prioritize three revenue generating
initiatives moving forward, which may build and sustain competitive advantage; i) further
development of its Omni-channel, ii) focus on private label product lines, and iii) improvement of
the JCP customer experience.
First, the shift in consumer preferences from physical to digital shopping experiences emphasizes
the need for JCP to develop its online presence. Digital consumers, and e-commerce in general, are
on the rise; US e-commerce sales have increased by 13.75% since 2015 and US smartphone
penetration is 68.9% while expected to hit almost 81% by 2020 (Statista, 2017b). As technology will
continue to increase the sophistication of consumers, JCP must create a seamless shopping
experience where digital solutions support the in-store experience, for instance through mobile
payments and ease of search (MacKenzie, et al., 2013) .The expansion of its online presence has
three immediate implications: i) it requires investment in online infrastructure, ii) it must be
15executed systemically across channels, and iii) marketing efforts must be aligned accordingly. First,
the capital to invest in a technology-driven infrastructure should be freed up through the closing of
a number of current stores, which will be elaborated below. Secondly, key to the success of
expanding its online presence is to execute systemically across channels. Products ordered online
should be available for pick up in the nearest JCP, to save the customer shipping costs and to
encourage spontaneous purchases. The company must also be consistent in terms of the quality,
price and product selection it offers in-store and online to streamline its offering.
Third, JCP should leverage physical stores as a marketing tool to maintain brand awareness and
achieve higher online sales volumes. Some of JCP’s current locations could serve as storage unit
leases for its e-commerce business to support growing volume through this channel. Through its
substantial network of storage units, i.e. old department stores, JCP would potentially be able to
offer shipping deals comparable to Amazon both in speed and price, which are important value
drivers for consumers (Gulisano, 2017). However, the firm can extract cheaper solutions by renting
or buying square feet in less attractive shopping areas and by centralizing distribution in larger hubs.
The conversion of physical store space should therefore only support online purchases with in-store
pick up, whose need for space must be evaluated continuously. Additionally, JCP should leverage
the immense amount of data available through its online platforms to personalize marketing.
An enhanced focus on private label brands should be undertaken as well, as this product line already
performs well and exhibits significant sales volume potential for JCP. Private label products show
higher gross margin potential relative to distributed products due to the absence of double-margins.
The below three segments are recommended as targets for R&D and promotional efforts going
forward:
• Millennials, the first group who grew up with the internet, social media and mobile phones,
is aged be-tween 13-30, and makes up 15% of the US consumers. The segment is expected
to account for 1/3 of total spending in the US by 2020 (MacKenzie, et al., 2013).
• Baby Boomers, approximately 47 million households in the US alone, are projected to
account for the largest spending proportions within categories such as housewares (73%)
and apparel (56%) in the coming years. The sheer size of the segment underlines the
importance of targeting the group going forward. However, shopping patterns need to be
evaluated, as the segment is expected to spend a larger proportion of their income on
experiences relative to off-the-shelf-products (MacKenzie, et al., 2013).
• Hispanics spending is expected to double over the next ten years and account for one fifth
of total spending in the US (MacKenzie, et al., 2013). In addition to growing buying power,
their shopping patterns are interesting for department stores, as the segment spends 1.5
times more on children’s apparel, footwear, and fresh food than non-Hispanic consumers -
providing substantial opportunities for department stores and brands that succeed in
targeting the segment.
16As a part of a private label strategy, stores across the country should be designed to promote and
showcase private label products in more optimal ways relative to distributed brands. In relation to
an increased focus on the private label product portfolio, private brands not owned by JCP would
and should not be ditched, as these products drive traffic to JCP stores. By implementing the
initiatives above, JCP will ‘shoot where the ducks are’ (Whitney, n.d.), i.e. continue its focus on its
core business, while also initiating targeting of new segments, adapting to the future.
Finally, JCP should prioritize an improvement of its customer experience due to growing competition
for survival in the industry where experience is a driver of repeat purchases. As shown in Table 1,
JCP performs worst in overall customer experience relative to its peers, and in the low end in
relation to shopper satisfaction only beating Macy’s who also happen to have a lower number of
employees per square feet. Two main drivers for an improved customer experience should be
considered: i) the physical space and ii) the service provided by employees. First, the tidiness of the
physical space is important for a stimulating shopping experience, with messy tables and low in-
store inventories currently discouraging sales (Loeb, 2016). A way to improve efficiency is to
eliminate narrow job descriptions and train every employee in the store to assist and check out
customers, to restock, and to maintain tidy store spaces. Second, since in-store employees are the
ones interacting with customers, customer service constitutes a crucial part of the experience.
Excellent customer service can drive immediate and repeat purchases. JCP should stimulate intrinsic
motivation through i) increased and continuous employee training, ii) moving away from task
specialization and towards area specialization, and iii) job advancement opportunities. Continuous
training and area specialization will make employees more competent in the provision of
exceptional customer service, stimulate personal learning aspirations, and increase the degree to
which they feel valued by company through its willingness to invest in them. Job advancement
opportunities should increase employee commitment to JCP and will in the long-run result in cost
savings, as re-training of existing employees is typically cheaper than training new personnel. As
such, JCP should aim at changing the people, rather than changing the people.
5.3.1.2 Cost Cutting Actions
Although a company cannot cut its way to growth, reducing unnecessary costs can do wonders to a
strategically viable company’s profitability. For JCP, two things in its operating costs stand out: i) the
high number of physical stores and ii) a need for improved inventory management.
JCP has a large number of stores both relative to their peer group and in when considering that the
retail industry is showing a clear shift from physical to online shopping. The overall declining
performance of department stores resulting from shifting consumer preferences away from physical
and towards online retail, merits a discussion of the outlook for demand and an assessment of how
JCP may strategically reposition itself in the altered market. JCP must acknowledge that reaching
17past revenue levels may be impossible in the future, simply because overall demand for physical
department stores is shrinking. Accepting this potential truth about the future market would
suggest a need to follow a strategy of ‘shrinking selectively’ (Harrigan, 1980). Looking at a company
like Nordstrom, which turns a profit with approximately a third of the number of stores JCP has and
31% fewer employees, one could infer that closing JCP stores could be an ingredient for the
turnaround recipe for profitability. However, a strategic consideration to keep in mind is the higher
exclusivity of the brands Nordstrom distribute: A limited number of stores is well-aligned with an
image of exclusivity. For JCP who targets a lower income segment than Nordstrom, imitating
Nordstrom’s store strategy too extensively could backfire. We recommend that JCP supplements
the decrease in physical store space with an increased focus on the visibility and quality of their e-
commerce offering as discussed above in section 5.3.1.1.
Decreasing rent expenses can be achieved through four actions as illustrated in figure 5 below. JCP
must decrease their price per square foot, either through a renegotiation of their leasing contracts
with landlords for rented stores, or by increasing the rent charged for store-within-store space such
as their Sephora stores. Since the overall retail industry is in decline, and building on JCP’s large size,
the company should have material leverage to successfully renegotiate rent terms. Additionally, JCP
can decrease their rent expense through a reduction in square feet, either through a reduction in
the number or the size of their stores. Considering the outlook of the retail industry, JCP should
close a number of stores altogether, by strategically identifying unprofitable and declining stores,
customer reach, and proximity to other stores. The closing of physical stores and lower rent
expenses will allow JCP to invest the freed up cash in improvement of the remaining stores and
development of their online presence.
Figure 5: Decrease of rent expense
Renegotiation)with)landlord
Price)per)square)
feet
Subleasing)of)floor)space
Rent)expense
Number)of)stores:)closing
Square)feet
Size)of)stores:)reduction
Next, with mediocre performance on inventory turnover and days of inventory compared to peers,
along with the proposed increased focus on their private label operations, JCP has room for
improvement in inventory management. Improved inventory management will result in lower
inventory levels and a consequently lower COGS. This will ultimately lead to an improvement of the
bottom line, i.e. net income. Furthermore, JCP should leverage their improved inventory
management in their price discount strategy; with a history of an excessive number of promotional
sales events (Ofek, et al., 2016), JCP could learn from brands such as Uniqlo, which use inventory
18levels to determine price discounts (Yen, 2016). With sophisticated inventory management systems
in place, JCP could quickly respond to product popularity and discount slow selling products.
5.3.2 Organizational Arrangements
Considering JCP’s history of C-suite turnover, current management should be kept stable during the
turnaround to prevent further confusion and alienation among employees. Ellison appears more
adept at motivating and relating to the workforce than his predecessor. His efforts to emphasize his
presence throughout the organization and his enforcement of heightened transparency to counter
insecurity induced by previous management teams should support management’s ability to
maintain organizational cohesiveness throughout the turnaround process.
The second ingredient in a successful turnaround strategy is appropriate organizational
arrangements (Harrigan, 2012). An internal force affecting the decline of JCP are employees and
their level of motivation. Buy-in from employees at all organizational levels and in all functions is
crucial to a successful turnaround.
Looking at compensation, JCP sales associates earn around $9 an hour, indicating that JCP is paying
in-store employees close to minimum wage, which ranges between $7.25 and $11 an hour in US
states (DeSilver, 2017). Paying such a low wage can directly demotivate employees.
Figure 6: Hourly salary comparison
Hourly'salary'comparison'
Position JC'Penney Kohl's Macy's Nordstrom Average
Cashier 8.9 * 9.18 * 9.04
Sales'Associate 9.02 8.74 9.17 11.37 9.575
Sources: (Glassdoor, 2017a; Glassdoor, 2017b; Glassdoor, 2017c; Glassdoor, 2017d)
Additionally, studies show that 56% of near minimum wage workers only have a high school
education or less (DeSilver, 2017). Limited education restricts job opportunities for the individual,
and the key motivational factor behind the choice to work at JCP will likely be the paycheck for quite
a few employees. This may make it even more challenging for JCP management to motivate
employees intrinsically and encourage them to take ownership over and responsibility for the
customer experience they provide.
The current level of motivation among employees can be analyzed as sales per employee relative
to JCP’s peers. As table 9 shows, JCP has the lowest sales per employee, indicating relatively low
employee motivation.
19You can also read