Conference Programme CIE Australia Lighting Research Conference 2021
←
→
Page content transcription
If your browser does not render page correctly, please read the page content below
CIE Australia Lighting
 Research Conference 2021
 February 9, 2021
 Online only, by Zoom

 Conference
 Programme

 Version 1.1
 Note: subject to change

 CIE Australia
 The Australian National Committee of Registered as CIE Australia Inc.
the International Commission on Illumination Associations Registration No: A0022976Z
 www.cie.org.au ABN: 32 301 390 692
CIE Australia Lighting Research Conference 2021 - Conference Programme Page 2 of 25

 THE CIE
The International Commission on Illumination – also known as the CIE from its French title, the
Commission Internationale de l´Eclairage – is devoted to worldwide cooperation and the exchange
of information on all matters relating to the science and art of light and lighting, colour and vision,
photobiology and image technology. More information can be found from the CIE website:
http://www.cie.co.at/.

The CIE is comprised of six scientific Divisions which carry out its technical work:
 Division 1: Vision and Colour
 Australian Division Member: Wendy Davis
 Division 2: Physical Measurement of Light and Radiation
 Australian Division Member: Tony Bergen
 Division 3: Interior Environment and Lighting Design
 Australian Division Member: Veronica Garcia Hansen
 Division 4: Transportation and Exterior Applications
 Australian Division Member: Gillian Isoardi
 Australian Alternate Division Member: Kevin Monaghan
 Division 6: Photobiology and Photochemistry
 Australian Division Member: Urbain du Plessis
 Division 8: Image Technology
 Australian Division Member: Alp Durmus

CIE Australia is the Australian National Committee of the CIE, which represents the interests of the
CIE in Australia and represents the interests of Australia in the CIE. For more information see:
http://www.cie.org.au/.

CIE Australia National Committee Executive:
 • President: Tony Bergen
 • Vice President: Jennifer Long
 • Treasurer: Eric Southgate
 • Secretary: Gillian Isoardi

CIE Australia Lighting Research Conference 2021 Scientific Committee:
 • Tony Bergen (Chair)
 • Jennifer Long
 • Mark Schier

Any mention of organisations or products in this programme or by the speakers does not imply
endorsement by the CIE or by CIE Australia.
CIE Australia Lighting Research Conference 2021 - Conference Programme Page 3 of 25

 PROGRAMME
 All times are Australian Eastern Daylight Time (AEDT, UTC/GMT +11 hours).

 Tony Bergen President, CIE Australia
 09:10 Welcome
 Peter Blattner President, CIE
 Session 1. Office Lighting and Daylighting
 09:20 Crispin Rock Australia Abrupt transitions in lighting around a threshold
 09:40 Kieu Pham Australia Monitoring manual blind use in large open plan offices
 10:00 Francisca Australia Refining the thresholds of perceived luminous variability in a virtual reality
 Rodriguez experiment
 10:20 Marta Poland View out evaluation according to EN17037 – a comparison of the objective
 Waczynska and subjective assessment
 10:40 Jennifer Australia Workshop: Visual ergonomics and digital display use: progress on the
 Long development of technical report CIE TC 3-58
 11:10 Break
 Session 2. Colour and Vision
 11:40 Dorukalp USA Reporting variation in melanopic and photometric measures
 Durmus
 12:00 Joelene Australia The detectability of vertical light intensity differences
 Elliott
 12:20 Mariana R C Australia The effect of adaptation time on chromaticity perception
 Papa
 12:40 Break
 Session 3. Photobiology and Wellbeing
 13:40 Sean Cain Australia Evening home lighting adversely impacts the circadian system and sleep
 14:00 Sung-Woo South Studies and clinical trials on the effects of 480nm light on humans during the
 Choi Korea day and night
 14:20 Ruth Genevieve Australia Factors that influence night lighting conditions in patient rooms
 Ong
 Session 4. Obtrusive Light and Sky Glow
 14:40 Mike Jackett New Is CCT really the best spectral index for predicting sky glow?
 Zealand
 15:00 Adrian Cupitt Australia Standardising artificial light at night surveys
 15:20 Break
 Session 5. Product Performance and Measurement
 15:50 Anders Denmark Measurement of temporal light modulation and calculation of temporal light
 Thorseth artefacts
 16:10 Steve Coyne Australia A matter of life and stress: predicting the lifetime of led lighting products
 16:30 Tony Bergen Australia Challenges in measuring ultraviolet radiation
 16:50 Mei Ying Australia Estimating illuminance when viewing a virtual reality scene on the oculus
 Boon quest using the unreal engine
 17:10 Concluding comments

 17:15 Close

 18:00 Virtual afterparty
CIE Australia Lighting Research Conference 2021 - Conference Programme Page 4 of 25

 ABSTRACTS

 Session 1

 Office Lighting and
 Daylighting
CIE Australia Lighting Research Conference 2021 - Conference Programme Page 5 of 25

ABRUPT TRANSITIONS IN LIGHTING AROUND A THRESHOLD

Crispin Rock1, Wendy Davis1, Wenye Hu1,
1 School of Architecture, Design and Planning, The University of Sydney, Australia
Correspondence: croc5716@uni.sydney.edu.au
A psycho-physical experiment was conducted to investigate the occupant acceptability of areas where there is an abrupt
transition in brightness with the adjacent space and if the existence of a threshold changes the level of acceptability.
Previous studies about abrupt transitions in brightness have concentrated on the partition between internal artificially lit
spaces and the external daylit area [1-3]. Results show that less abrupt transitions when walking between differently
spaces are more acceptable. Other research has focussed on occupant comfort near to windows in commercial office
spaces [4, 5]. The real-world situation of these studies has involved many different factors that have produced differing
conclusions, however the addition of artificial light to the interior adjacent to windows is generally preferred as is a
window view especially if it is more natural.
This experiment was conducted in a laboratory. Twenty-nine participants were placed in an area and exposed to five
different lighting conditions that simulated varying abrupt transitions in brightness. Horizontal illuminance ranged from
320 lux to 7000 lux. Each condition was scored on a series of sematic scales. The experiment was repeated with a
physical threshold at the abrupt transition.
Results showed that in conditions with illuminance levels similar to those found in a typical office daylight harvesting
scenario, perception of comfort, brightness, naturalness and task clarity was less than a condition with more uniform
illuminance.
It was also shown that the introduction of the threshold made the space feel more expansive in less uniform lighting
conditions.
References
[1] Lasagno, C. M., Pattini, A. E., Rodriguez, R. G., & Colombo, E. M. (2011). Developing a modelling factor index for transition
 spaces: A case study approach. Architectural Science Review, 54(3), 215-224.
[2] Lasagno, C. M., Issolio, L. A., Pattini, A. E., & Colombo, E. M. (2014). Transitional spaces from exterior to interior as functional
 vision barriers in ageing. Lighting Research & Technology, 46(6), 706-715.
[3] Araji, M. T., Boubekri, M., & Chalfoun, N. V. (2007). An examination of visual comfort in transitional spaces. Architectural Science
 Review, 50(4), 349-356.
[4] Borisuit, A., Linhart, F., Scartezzini, J.-L., & Münch, M. (2015). Effects of realistic office daylighting and electric lighting conditions
 on visual comfort, alertness and mood. Lighting Research & Technology, 47(2), 192-209.
[5] Begemann, S., Van den Beld, G., & Tenner, A. (1997). Daylight, artificial light and people in an office environment, overview of
 visual and biological responses. International Journal of Industrial Ergonomics, 20(3), 231-239.
CIE Australia Lighting Research Conference 2021 - Conference Programme Page 6 of 25

MONITORING MANUAL BLIND USE IN LARGE OPEN PLAN OFFICES

Pham, Kieu1, Garcia-Hansen, Veronica1, Isoardi, Gillian2
1 Queensland University of Technology, Brisbane, Australia
2 Light Naturally, Brisbane, Australia
Correspondence: kieu.pham@qut.edu.au
Solar blind shades play an important role in balancing visual comfort and daylighting levels in offices. However, this
balance is difficult to conceive in large open plan offices where blind controls are shared by many occupants. Poorly
conceived shading controls can lead to visual discomfort and condition users to leave blinds closed for prolonged
periods; preventing daylight from being appropriately utilized. Previous studies have focused on relating blind use to
lighting levels, however, in open plan spaces, other environmental factors such as distance and presence of other users
would influence a user’s decision to occlude blinds [1,2]. This presentation highlights the results of observing user related
patterns in two large open plan offices across a 5-month period. Observations of blind use were recorded, including
distance from blinds, view direction, and presence and absence of other users. Time-series measurements of the
approximated vertical eye illuminance were also collected at user workstations. A logistic regression compared
the association between the and distance, along with heuristic clustering and qualitative classification to
contextualise different patterns of blind users based on their frequency of use and associated levels in order of
magnitude. The results indicated that distance from blinds had stronger association to blind use compared to
(see Table 1) and that user related patterns were identified by frequency of use and their associated levels. The
results of this study provide a framework to better understand user related patterns to blind use in open plan office
settings (see Figure 1). The contribution of this research can better inform lighting design in improving shading control
strategies in open plan offices.
Table 1. Logistic regression using 10-fold cross validation, comparing the strength of association between the and
 distance from blinds.
 Coefficients Estimate p-value
 1.7251 0.3260*
 Distance -23.9951 < 0.05***
 : Distance 19.113 0.420

 Figure 1: Framework to identify patterns of blind use in open plan offices.
References
[1] Sutter, Y., Dumortier, D., & Fontoynont, M. (2006). The use of shading systems in VDU task offices: A pilot study. Energy and
 Buildings, 38(7), 780-789. doi:10.1016/j.enbuild.2006.03.010 [2] Reinhart, C., & Voss, K. (2003). Monitoring manual control of
 electric lighting and blinds. Lighting Research & Technology, 35(3), 243-258
CIE Australia Lighting Research Conference 2021 - Conference Programme Page 7 of 25

REFINING THE THRESHOLDS OF PERCEIVED LUMINOUS VARIABILITY IN A VIRTUAL REALITY EXPERIMENT

Francisca Rodriguez1, Veronica Garcia-Hansen1, Gillian Isoardi2, Alicia Allan3
1 Queensland University of Technology, Brisbane, Australia
2 Light Naturally, Brisbane, Australia
3 The University of Queensland, Brisbane, Australia
Correspondence: francisca.rodriguez@hdr.qut.edu.au
What constitutes good visual conditions in indoor settings is a matter of debate, as it depends on subjective assessments
of what is visually comfortable or not [1, 2]. When it comes to investigating well-being responses motivated by luminous
changes outdoors, the discussion of what is visually interesting remains. In previous research, we have proposed
methods to classify, capture, and systematize lightness changes in window views [3], and demonstrated the adequacy
of lightness changes to describe dynamic attributes in views [4]. The method to define lightness changes categories
relied on the procedures of the CIE [5], which later distinguished between three lightness change types (i.e. Global,
Local, and Minimal)[3]. These categories responded to a classification of lightness conditions informed by systematic
imaging techniques [6], the sky conditions at the observation time [7], and the visual assessment of luminous variability
outdoors. Yet, a more detailed definition of the subjective thresholds for these categories has not been tested with
human surveys to date.
In this presentation, we outline a way to refine these outdoor luminous variability thresholds by revising the findings of
a subjective evaluation of views in a virtual reality experiment. We presented 48 participants with a sample of immersive
outdoor scenes (n = 16) showing a controlled number of lightness conditions and correlated average mean scores for
three questions involving variability and predictability of luminous conditions outdoors. Representative view scenes with
high and low scores were revised using imaging techniques and concurrent vertical illuminance data to examine what
was perceptually considered as luminous change over time. This work builds on novel approaches to describe views as
a function of lightness changes, by informing quantitative procedures with human data.
References
[1] P. R. Boyce, Human Factors in Lighting, Third Edition: Taylor & Francis, 2014
[2] J. A. Veitch and G. R. Newsham, "Determinants of Lighting Quality II: Research and Recommendations," 1996
[3] F. Rodriguez, V. Garcia-Hansen, A. Allan, and G. Isoardi, "Appraising daylight changes in window views: systematic procedures
 for classifying and capturing dynamic outdoor scenes," Architectural Science Review, pp. 1-16,
 202010.1080/00038628.2020.1758621.
[4] F. Rodriguez, V. Garcia-Hansen, A. Allan, and G. Isoardi, "Testing the Adequacy of Luminous Change Descriptors to Represent
 Dynamic Attributes in Outdoor Views ", Forthcoming
[5] C. CIE, "15: 2004 COLORIMETRY," Commission Internationale de l’Eclairage, 2004
[6] D. Hoiem, A. A. Efros, and M. Hebert, "Recovering surface layout from an image," International Journal of Computer Vision, vol.
 75, pp. 151-172, 200710.1007/s11263-006-0031-y.
[7] R. Perez, P. Ineichen, R. Seals, J. Michalsky, and R. Stewart, "Modeling daylight availability and irradiance components from
 direct and global irradiance," Solar energy, vol. 44, pp. 271-289, 199010.1016/0038-092X(90)90055-H.
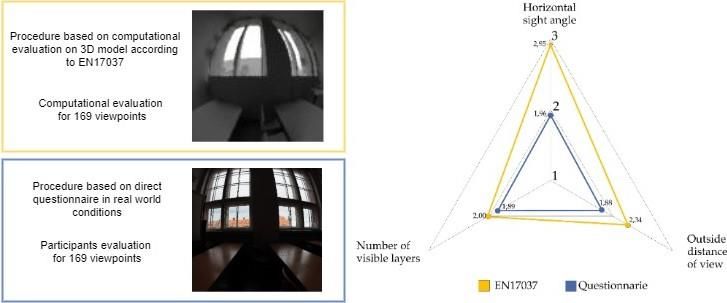
CIE Australia Lighting Research Conference 2021 - Conference Programme Page 8 of 25

VIEW OUT EVALUATION ACCORDING TO EN17037 – A COMPARISON OF THE OBJECTIVE AND SUBJECTIVE
ASSESSMENT

Waczynska Marta1, Sokol Natalia1, Martyniuk-Peczek Justyna1
1 Gdansk University of Technology, Faculty of Architecture, Gdansk, Poland
Correspondence: marta.waczynska@pg.edu.pl
Introduction
This paper presents an empirical research approach to assess a view out as view of the exterior through the window,
based on the criteria (horizontal sight angle, outside distance of the view and a number of visible layers) described in
the European standard EN17037:2018 [1]. The research focuses on the comparison between the objective
computational simulation and subjective assessments made by users of the space. The article presents an ongoing
research with so far 192 responders.
Method
In this view study the computer-based simulations results are compared with results obtained from the direct
questionnaires distributed among the architecture students. The study focuses on spaces representing two adults’
learning environments [2–4]: A: selected classrooms at the university campus with various orientations and view out
settings and B: variety of home study rooms, which replaced standard classrooms during the pandemic. The research
consists of three steps: 1. objective evaluation of the selected views using computer simulations; 2. subjective
assessment of the selected views and users’ satisfaction with them, using a direct questionnaire; 3. comparison of the
results from different settings.
Results
The emerging results of the university building [5] indicate that the evaluation of the view out, which is based only on
the quantitative criteria as found in EN17037 does not correspond to the 'good view out' in terms of a quality assessment
(satisfaction with the view). The study clearly demonstrates a potential to include the parameters relating to the view
quality in future standardisation efforts.

 Figure.1. The graphical representation of the method and the first outcomes of the study [5].
References
[1] EN European Committee for Standardization. EN 17037:2018 Daylight in buildings, Brussels: CEN, 2018.
[2] Jamrozik A, Clements N, Hasan SS et al. Access to daylight and view in an office improves cognitive performance and
 satisfaction and reduces eyestrain: A controlled crossover study. Build. Environ. 2019. doi:10.1016/j.buildenv.2019.106379.
[3] Michael A, Heracleous C. Assessment of natural lighting performance and visual comfort of educational architecture in Southern
 Europe: The case of typical educational school premises in Cyprus. Energy Build. 2017. doi:10.1016/j.enbuild.2016.12.087.
[4] Kuhlenengel M, Waters CE, Konstantzos I. Assessing the impact of outside view on learning: A close look to en 17037 “view
 out” practices through the analysis of 220 classrooms. J. Phys. Conf. Ser. 2019. doi:10.1088/1742-6596/1343/1/012159.
[5] Waczynska M, Sokol N, Martyniuk-Peczek J. Computational and experimental evaluation of view out according to European
 Standard EN17037. Build. Environ. 2020; (November):107414.
CIE Australia Lighting Research Conference 2021 - Conference Programme Page 9 of 25

WOKRSHOP: VISUAL ERGONOMICS AND DIGITAL DISPLAY USE: PROGRESS ON THE DEVELOPMENT OF
TECHNICAL REPORT CIE TC 3-58

Jennifer Long1,2
1 Jennifer Long Visual Ergonomics, Katoomba, Australia
2 School of Optometry and Vision Science, UNSW, Sydney, Australia
Correspondence: jlong@visualergonomics.com.au
In 1984 the CIE published a technical report CIE 60:1984 “Vision and the Visual Display Unit Workstation”. Some of the
content of this technical report has withstood the test of time, but it refers to obsolete display technology and lighting
equipment. Subsequently, the CIE has withdrawn the technical report from circulation.
In 2020 the CIE approved a revision of CIE 60 so that it will be relevant to modern technology. The objective is to
consolidate current scientific knowledge about visual ergonomics and digital displays so that it is accessible and usable
for end users and for people who provide advice for workplace design. An 8-member committee comprising members
from Australia, Europe, the UK and the US has been formed (CIE TC 3-58) to complete the work.
It is anticipated that the basic structure of CIE 60:1984 will be retained, namely, (1) the way in which digital displays are
used, (2) health aspects of digital displays, and (3) visual requirements of digital display work and appropriate visual
conditions. Photographs used within CIE 60:1984 to supplement the text (for example images of visual display elements,
computer workstations and lighting) will need to be replaced with modern images and diagrams.
By far, the greatest challenge for the committee will be to construct a future-proof document, particularly since display
technology, lighting equipment and lighting metrics are currently in a state of flux. It is anticipated that the new technical
report will be finalised by 2023.
This session will be a very short workshop, and participants are invited to provide feedback/suggestions for content they
would like to see included in the new technical report.
CIE Australia Lighting Research Conference 2021 - Conference Programme Page 10 of 25

 ABSTRACTS

 Session 2

 Colour and Vision
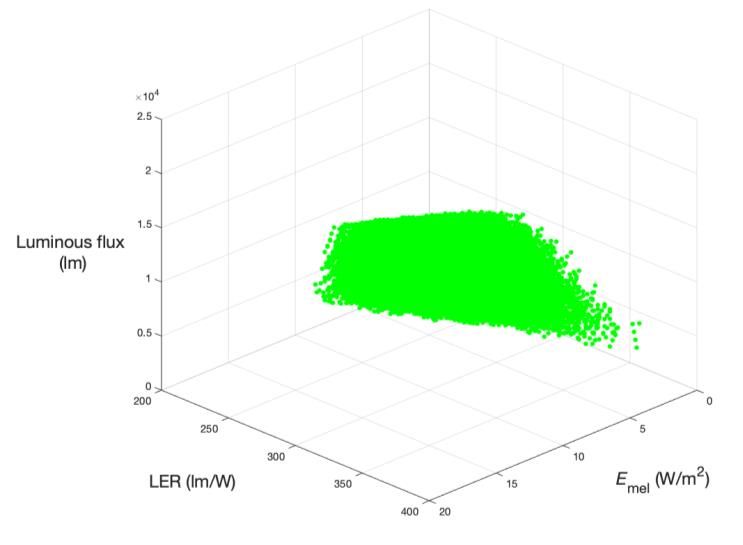
CIE Australia Lighting Research Conference 2021 - Conference Programme Page 11 of 25 REPORTING VARIATION IN MELANOPIC AND PHOTOMETRIC MEASURES Dorukalp Durmus1 1 Pennsylvania State University, University Park, USA Correspondence: alp@psu.edu Circadian metrics quantify non-image forming effects of lighting. While static spectral power distributions (SPDs) can be quantified with a single metric [1], multi-channel LEDs (mcLEDs) generate a wide range of spectra. Therefore, a single- numbered metric is not adequate to describe the performance of mcLEDs. Descriptive statistics, as shown in Table 1, are limited in reporting the variability of mcLED outputs, due to a lack of representation of the trade-offs between different measures. Table 1. Descriptive statistics showing the variability in a multi-channel LED system Emel (W/m2) LER (lm/W) v (lm) Minimum 1.15 216 961 Maximum 18.75 377 20589 Average 9.98 315 11631 Standard deviation 2.91 18 3503 Quantifying mcLED output using a 3D graph of selected metrics can highlight trade-offs, as shown in Fig. 1. Selected metrics for each dimension of the graphical representation can be relevant to the application, such as circadian (e.g., melanopic irradiance [2]), photometric (e.g., luminous efficacy of radiation (LER), and colorimetric (e.g., correlated colour temperature (CCT)) measures. Figure 1: Three-dimensional representation of a multi-channel LED output exhibits the complex relationship between melanopic irradiance, luminous efficacy of radiation (LER), and luminous flux. Each dimension of the 3D graph can be discretised to unit voxels using significant intervals. The voxelization can provide a new metric to quantify and compare mcLED systems. The voxelization method has been previously used to characterise colour rendition variability in mcLEDs [3]. Voxel-based metrics can also be used in spectral optimisation studies to identify optimal solutions in terms of circadian synchronisation, energy efficiency, and lighting quality [4,5]. Future work will focus on the identification of the unit voxel size and quantification of the resulting volume. References [1] Durmus, D., Optimising Light Source Spectrum to Reduce the Energy Absorbed by Objects, The University of Sydney, PhD Thesis, 2017, http://hdl.handle.net/2123/17844 [2] CIE S 026/E:2018 System for Metrology of Optical Radiation for ipRGC-Influence Responses to Light, International Commission on Illumination, Vienna, Austria, 2018. [3] Royer, M. P., Durmus, D., Baxter, D. J., Characterizing the color rendition performance of multi-primary LED lighting systems, IES Annual Conference Proceedings, 2020. [4] Durmus, D., Impact of Surface Reflectance on Spectral Optimization for Melanopic Illuminance and Energy Efficiency. In Optical Devices and Materials for Solar Energy and Solid-state Lighting (pp. PT2C-5). Optical Society of America, 2019, https://doi.org/10.1364/PVLED.2019.PT2C.5 [5] Durmus, D., Davis, W., Colour difference and energy consumption of absorption-minimizing spectral power distributions. In Proceedings of the Asia-Pacific Lighting Systems Workshop. Sydney, Australia, 2015.
CIE Australia Lighting Research Conference 2021 - Conference Programme Page 12 of 25

THE DETECTABILITY OF VERTICAL LIGHT INTENSITY DIFFERENCES

Joelene Elliott1, Wenye Hu1, Wendy Davis1
1 School of Architecture, Design and Planning, The University of Sydney, Australia
Correspondence: joelene.elliott@sydney.edu.au
This line of research aims to characterise an occupant’s ability to detect differences in lighting as a function of the
proximity of the person to the illuminated area. This particular experiment focused on the illumination of vertical surfaces.
By understanding how proximity influences the detection of differences in lighting, energy-saving techniques can be
developed that do not negatively impact the appearance of architectural spaces. It was hypothesized that changes in
vertical illuminance would be more difficult to detect when further from the observer.
Eighty participants viewed a 10 m x 2.4 m vertical surface (wall). Using a spatial five-alternative forced-choice (5AFC)
method, they evaluated the brightness along the wall and identified the section that appeared dimmer than the others.
Eight different experimental conditions manipulated participant position (seated at one of the two ends or in the middle
of the wall) and eye movements (free viewing or fixation on a particular section of the wall). Each subject completed 10
repeated trials for each of the 20 test lighting conditions, in a randomised sequence.
The hypothesis not supported – participants’ ability to detect differences in lighting was very poor for the end portions
of the wall for all conditions, even when seated directly in front of it and fixating on it. Further analysis is underway and
more detailed results will be presented.
CIE Australia Lighting Research Conference 2021 - Conference Programme Page 13 of 25

THE EFFECT OF ADAPTATION TIME ON CHROMATICITY PERCEPTION
Mariana R C Papa1, Wendy Davis1
1 School of Architecture, Design and Planning, The University of Sydney, Australia
Correspondence: mvan3085@uni.sydney.edu.au

Chromatic adaptation, the process by which colour perception changes in response to light exposure, can be
capitalized on to improve the visual environment and reduce the energy consumed by lighting. Earlier research used
the psychophysical method of hue scaling to measure the perception of 15 test chromaticities when observers were
fully adapted to five different near-white, but slightly tinted, chromaticities. Further research characterized the effects
of adaptation luminance. In this experiment, five subjects were immersed in neutral white adaptation light of 150 cd/m 2
for five minutes, then exposed to lighting of a different, near-white chromaticity for different durations (90 sec, 60 sec,
30 sec, 15 sec). Following adaptation, subjects viewed test light chromaticities for two seconds and their perceptions
of the test chromaticities were reported. After each trial, the neutral adaptation light was presented for 90 seconds to
“reset” the visual system to neutral adaptation before exposure to another near-white adaptation chromaticity,
presented in a random sequence. The results show that adaptation time affects both the hue and saturation of the
appearance of the test chromaticities.
CIE Australia Lighting Research Conference 2021 - Conference Programme Page 14 of 25

 ABSTRACTS

 Session 3

 Photobiology and
 Wellbeing
CIE Australia Lighting Research Conference 2021 - Conference Programme Page 15 of 25

EVENING HOME LIGHTING ADVERSELY IMPACTS THE CIRCADIAN SYSTEM AND SLEEP

Cain SW1, McGlashan EM1, Vidafar P1, Mustafovska J1, Curran SPN1, Wang X1, Mohamed A2, Kalavally V2,
Phillips AJK1
1 Monash University, Melbourne, Australia
2 Monash University, Kuala Lumpur, Malaysia
Correspondence: sean.cain@monash.edu
The regular rise and fall of the sun resulted in the development of 24-h rhythms in virtually all organisms. In an
evolutionary heartbeat, humans have taken control of their light environment with electric light. Humans are highly
sensitive to light, yet most people now use light until bedtime. We evaluated the impact of modern home lighting
environments in relation to sleep and individual-level light sensitivity using a new wearable spectrophotometer. We
found that nearly half of homes had bright enough light to suppress melatonin by 50%, but with a wide range of individual
responses (0–87% suppression for the average home). Greater evening light relative to an individual’s average was
associated with increased wakefulness after bedtime. Homes with energy-efficient lights had nearly double the
melanopic illuminance of homes with incandescent lighting. These findings demonstrate that home lighting significantly
affects sleep and the circadian system, but the impact of lighting for a specific individual in their home is highly
unpredictable.
CIE Australia Lighting Research Conference 2021 - Conference Programme Page 16 of 25

STUDIES AND CLINICAL TRIALS ON THE EFFECTS OF 480NM LIGHT ON HUMANS DURING THE DAY AND
NIGHT

Sung-Woo Choi1, Chohui Kim1, Seulgee Lee1, Seongmin Kim1, Chulsoo Yoon1
1 LED Business Team, Samsung Electronics Co. Ltd., Gyeonggi-do, Korea
Correspondence: sw80.choi@samsung.com
Most LED lighting developments have focused on brightness and color qualities of white LEDs such as luminous
efficacy, color rendering index, and power consumption [1, 2]. These properties are insufficient to represent the full
performance potential of LED lighting. Recently, many researchers have been interested in light quality that could
influence productivity, mood, safety, and health [3]. In fact, it has been found that light can visually and non-visually
affect humans through the eye's retinal cells [4-6]. Non-visual effects refer to specific lights that could physiologically
change hormones such as melatonin [7, 8]. The effect of light on the R, G, B cones and rods of retina cell photoreceptors
was already known before 2000, yet only as visual information, until melanopsin of the retina was discovered in
intrinsically photosensitive retinal ganglion cells (ipRGCs). As photoreceptors, ipRGCs are particularly sensitive to
absorption of 480nm peaked blue light. It turns out that the wavelength of 480nm correlates with melatonin suppression
and secretion, resulting in the change of lighting-requirements that can regulate alertness, sleep, and the circadian
rhythm. In this research, we focused and analyzed the effects of light at 480nm wavelegths on humans through
melatonin, HRV (Heart Rate Variability), EEG (ElectroEncephaloGraphy) and the test of attention. As a result, it was
found that the wavelength of light had a direct effect on melatonin, and that DLMO, which is known as the start time of
sleep, was also changed with HRV. Also, it was confirmed that the attention test results changed as the light changed,
and the brain waves responded differently at this time.

Fig. 1 Experimental schedule. The protocol above was performed twice using two types of lighting: Conventional lighting
(a) 5000K with 500 lux, (b) 2200K with 190 lux, HCL lighting (c) 5000K with 500 lux, (d) 2200K with 190 lux. And EEG and
the test of attention was conducted in the morning of 1 st and 3rd day and always recorded HRV during clinical periods.
References
[1] Crawford, M. H. LEDs for solid-state lighting: performance challenges and recent advances. IEEE J. Sel. Top. Quantum
 Electron. 15, 1028-1040 (2009)
[2] Philipp, P., Schmidt, P. J. & Schnick, W. A revolution in lighting. Nature Materials 14, 454-458 (2015)
[3] Falchi, F., Cinzano, P., Elvidge, C. D., Keith, D. M. & Haim, A. Limiting the impact of light pollution on human health, environment,
 and stellar visibility. J. Environ Manage, 92, 2714-2722 (2011)
[4] Bellia, L., Bisegna, F. & Spada, G. Lighting in indoor environments: visual and non-visual effects of light sources with different
 spectral power distributions. Build Environ. 46, 1984-1992 (2011)
[5] Pauley, S. M. Lighting for the human circadian clock: recent research indicates that lighting has become a public health issue.
 Med. Hypotheses. 63, 588-596 (2004)
[6] Webb, A. R. Considerations for lighting in the built environments: non-visual of light. Energy and Buildings. 38, 721-727 (2006)
[7] Gall, D. & Bieske, K. Definition and measurement of circadian radiometric quantities. In Proceedings of the CIE Symposium
 2004 on Light and Health: Non-Visual Effects. 129-132 (2004)
CIE Australia Lighting Research Conference 2021 - Conference Programme Page 17 of 25

FACTORS THAT INFLUENCE NIGHT LIGHTING CONDITIONS IN PATIENT ROOMS

Ruth Genevieve Ong1, Veronica Garcia-Hansen1
1 Queensland University of Technology, Brisbane, Australia
Correspondence: ruthgenevieve.ong@hdr.qut.edu.au
The conflict between the lighting needs of healthcare patients and staff has been a long-standing and contentious issue,
which is most evident at night in shared spaces of hospitals like patient rooms. Dim lighting enhances the sleep quality
of patients, but healthcare staff consider the light levels to be too low when conducting nursing tasks [1]. Poor lighting
conditions have been associated with higher medical error rates [2] and poor health outcomes for both patients and
healthcare staff [3–6], and yet this problem of inadequate lighting persists in practice. To better understand why this
problem continues to exist, this study will explore which factors may have influence on how lighting is used in patient
rooms at night and to what extent. A mixed-methods approach is proposed for the study and field data will be collected
from a healthcare facility and the staff that work there. The quality and quantity of light (such as illuminance and
luminance levels, and spectral power distribution) in patient rooms will be evaluated against lighting standards to identify
design-related issues. The perceptions and experiences of healthcare staff with night lighting will be gathered using
interviews and observations (using video recordings) [7] to uncover issues with social (patient–staff interactions),
behavioural (nursing workflows), and environmental (facility management and policies) factors. The expected outcomes
of the study will be used to develop lighting design strategies to help improve the night lighting conditions for healthcare
staff as they work (but without causing adverse effects for the patients).
References
[1] Aarts, M. P. J., & Kort, H. S. M., Lighting conditions in hospital medication rooms and nurses appraisal, Healthy Buildings 2017
 Europe, 2018, https://research.tue.nl/en/publications/lighting-conditions-in-hospital-medication-rooms-and-nurses-appra
[2] Buchanan, T. L., Barker, K. N., Gibson, J. T., Jiang, B. C., & Pearson, R. E., Illumination and errors in dispensing, American
 Journal of Hospital Pharmacy, 1991, https://doi.org/10.1093/ajhp/48.10.2137
[3] Ulrich, R., Quan, X., Zimring, C., Joseph, A., & Choudhary, R., The role of the physical environment in the hospital of the 21st
 century: A once-in-a-lifetime opportunity, The Center for Health Design, 2004,
 https://www.healthdesign.org/system/files/Ulrich_Role%20of%20Physical_2004.pdf
[4] Ulrich, R. S., Zimring, C., Zhu, X., DuBose, J., Seo, H.-B., Choi, Y.-S., Quan, X., & Joseph, A., A review of the research literature
 on evidence-based healthcare design, HERD, 2008, https://doi.org/10.1177/193758670800100306
[5] Joseph, A., Impact of light on outcomes in healthcare settings, The Center for Health Design, 2006,
 www.brikbase.org/content/impact-light-outcomes-healthcare-settings
[6] Bernhofer, E. I., Higgins, P. A., Daly, B. J., Burant, C. J., & Hornick, T. R., Hospital lighting and its association with sleep, mood
 and pain in medical inpatients, Journal of Advanced Nursing, 2014, https://doi.org/10.1111/jan.12282
[7] Blackler, A., Popovic, V., & Mahar, D., Investigating users’ intuitive interaction with complex artefacts, Applied Ergonomics,
 2010, https://doi.org/10.1016/j.apergo.2009.04.010
CIE Australia Lighting Research Conference 2021 - Conference Programme Page 18 of 25

 ABSTRACTS

 Session 4

 Obtrusive Light and
 Sky Glow
CIE Australia Lighting Research Conference 2021 - Conference Programme Page 19 of 25

IS CCT REALLY THE BEST SPECTRAL INDEX FOR PREDICTING SKY GLOW?

Mike Jackett1, William Frith2, Julian Chisnall3
1 Jackett Consulting, Lower Hutt, New Zealand
2 WSP Research and Innovation, Lower Hutt, New Zealand
3 Waka Kotahi, NZ Transport Agency, Wellington, New Zealand
Correspondence: mikejackett@gmail.com
Globally light pollution from artificial sources has grown at a rate greater than the global population growth. Some
authorities attempt to address this by specifying LED road lighting luminaires with a low correlated colour temperature
(CCT) e.g. 3000K. However, the CCT was not intended as a sky glow index and may not be the best index for purpose.
This study uses the spectral power distribution (SPD) from 75 LED road lighting luminaires to calculate the following
indexes and relate them to the relative sky glow derived from the US Department of Energy “Sky glow comparison tool
v1.0” [1],
 • Correlated Colour Temperature (CCT)
 • Scotopic / Photopic Ratio (S/P ratio)
 • % Blue light (430 – 470 nm)
 • % Blue light (400 – 500 nm)
 • % Blue light (400 – 550 nm)
When plotted against the relative skyglow a good predictor index will produce low dispersion of points and a high
correlation co-efficient. A series of some 25 graphs illustrate how well each of the indexes predict the relative skyglow
for scenarios including air pollution, observer eye sensitivity and proximity to light sources.
Results
Figure 1 (L) shows CCT as only a moderate predictor of sky glow (R2=0.75) whereas the same data in Figure 1 (R)
shows the S/P ratio to be a strong predictor (R2=0.99). Overall, the strongest spectral predictor of skyglow was the S/P
ratio and the weakest was % Blue light (430 – 470 nm).

 Figure 1: (L) Index CCT; (R) Index S/P ratio
Reference
[1] Kinzey, Bruce, The Sky Glow Comparison Tool, 2018, https://www.energy.gov/eere/ssl/potential-impacts-led-street-lighting-
 sky-glow
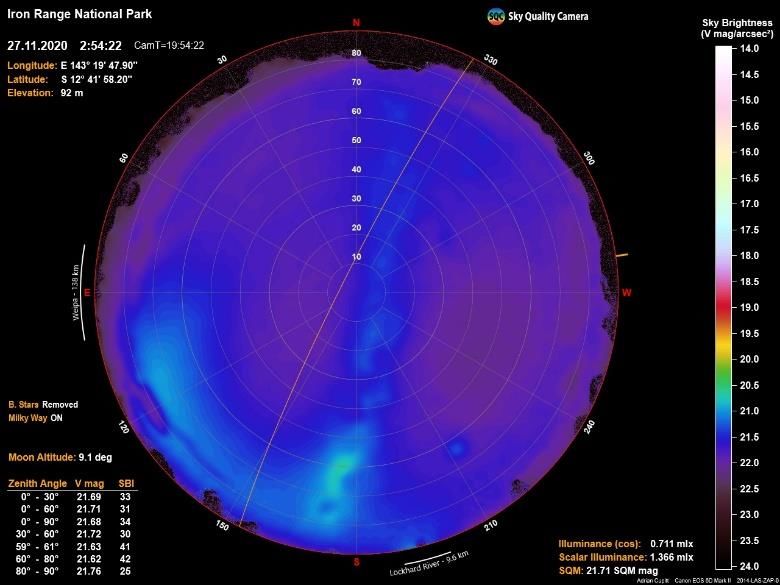
CIE Australia Lighting Research Conference 2021 - Conference Programme Page 20 of 25

STANDARDISING ARTIFICIAL LIGHT AT NIGHT SURVEYS

Adrian Cupitt1
1 WAVES Testing, Research and Consulting, QLD, Australia
Correspondence: adrian@wavestrac.com.au
In January 2020 the Australian Federal Government released the National Light Pollution Guidelines for Wildlife 1. The
guidelines are a great reference tool which helps lighting designers, governments and planners in the design of lighting
installations in wildlife sensitive areas, such as turtle nesting beaches. However, the guidelines lack or are inconsistent
in the specification of equipment suitable for conducting assessments of artificial light at night and does not provide a
standard methodology for conducting these surveys. Measurements are affected by atmospheric and environmental
conditions, such as temperature, humidity, fog, sea spray, and cloud cover distribution, height and thickness.
Furthermore, these conditions may change throughout the night and throughout the year and the variability in the
conditions should be taken into consideration when preparing the survey methodology.
WAVES Testing, Research and Consulting has been investigating the use of digital cameras with fisheye lenses, which
have been calibrated for luminance (mcd/m²), visual magnitude (mag/arcsec²) and correlated colour temperature (K), to
benchmark sky glow in locations throughout Queensland. This data allows councils and State government to quantify
the effect new and refurbished lighting installations have on sky glow.
While some of these parameters can only be assessed over a long time-frame, some can be investigated over a short
timeframe and have been the subject of studies aimed at developing a standard testing procedure which is repeatable
and comparable. Comments on the specifications made in the guidelines regarding equipment and results of these
studies will be presented.

 Figure 1: (L) Image from Iron Range National Park, QLD; (R) Sky brightness (V mag/arcsec²)
References
[1] Department of the Environment and Energy, National Light Pollution Guidelines for Wildlife Including Marine Turtles, Seabirds
 and Migratory Shorebirds, Commonwealth of Australia, 2020,
 https://www.environment.gov.au/biodiversity/publications/national-light-pollution-guidelines-wildlife
CIE Australia Lighting Research Conference 2021 - Conference Programme Page 21 of 25

 ABSTRACTS

 Session 5

 Product Performance and
 Measurement
CIE Australia Lighting Research Conference 2021 - Conference Programme Page 22 of 25

MEASUREMENT OF TEMPORAL LIGHT MODULATION AND CALCULATION OF TEMPORAL LIGHT ARTIFACTS

Anders Thorseth1
1 Technical University of Denmark, Roskilde, Denmark
Correspondence: andt@fotonik.dtu.dk
Temporal light modulation (TLM), the physical changes in light output on short timescales and the perceivable and
imperceivable disturbances caused in observers, called temporal light artifacts (TLA) [1] are attracting attention due to
the wide application of temporally modulated sources in LED lighting. TLA are suspected to cause problems with health
and wellbeing [2], seemingly aggravated for sensitive individuals. To improve the situation the CIE is preparing two
publications built on previous work [3], [1] and new research: A short technical note on the measurement of TLM
(TC 2-89) and a more comprehensive technical report on TLA (TC 1-83).
The result of a TLM measurement is called a waveform, essentially a large series of single light measurements. The
TLA measures, such as stroboscopic visibility measure (SVM) [4] and short-term light modulation (PstLM) [5] are
calculated from the TLM data, so the repeatability, comparability [6] and validity of these large datasets is of crucial
importance, as various regulation sets out requirements for TLA of commercial products [7], [8].
This presentation will go through highlights of the upcoming recommendations of CIE regarding measurements of TLM,
the relationship to TLA as well as touch upon some of the remaining open questions, for instance:
 • Uncertainty estimation for the large TLM datasets
 • Effect of uncertainty in TLM datasets on the calculation of TLA
However, while measurement of TLM is a technical issue, including some novel challenges this pales in comparison to
the problems of understanding the effect of TLM and TLA on the visual system and the brain.
References
[1] CIE, “CIE TN 008:2017 Final Report CIE Stakeholder Workshop for Temporal Light Modulation Standards for Lighting Systems
 | CIE,” CIE - International Commission on Illumination, Vienna, Austria, 2017.
[2] A. Wilkins, J. Veitch, and B. Lehman, “LED lighting flicker and potential health concerns: IEEE standard PAR1789 update,” in
 2010 IEEE Energy Conversion Congress and Exposition, 2010, pp. 171–178.
[3] CIE, “CIE TN 006:2016 Visual Aspects of Time-Modulated Lighting Systems – Definitions and Measurement Models,” Vienna,
 Austria, 2016.
[4] M. Perz, I. M. L. C. Vogels, D. Sekulovski, L. Wang, and Y. Tu, “Modeling the visibility of the stroboscopic effect occurring in
 temporally modulated light systems,” Light. Res. Technol., vol. 47, 2015.
[5] IEC TC 77/SC 77A, “IEC 61000-4-15:2010 Electromagnetic compatibility (EMC) - Part 4-15: Testing and measurement
 techniques - Flickermeter - Functional and design specifications,” 2010.
[6] J. Lindén, A. S. J. Bergen, and A. Thorseth, “Measuring and Comparing Waveforms of Temporal Light Modulation,” in
 Proceedings of the 29th Quadrennial Session of the CIE, 2019, pp. 7–16.
[7] European Commission, laying down ecodesign requirements for light sources and separate control gears pursuant to Directive
 2009/125/EC of the European Parliament and of the Council and repealing Commission Regulations (EC) No 244/2009, (EC)
 No 245/2009 and (EU) No 1194/2012, vol. 2020, no. 245. 2020, pp. 209–240.
[8] CEC, “Appendix JA8 – Qualification Requirements for High Efficacy Light Sources,” 2016 Building Energy Efficiency
 Standards, 2016. [Online]. Available: https://energycodeace.com/site/custom/public/reference-ace-
 2016/index.html#!Documents/appendixja8qualificationrequirementsforhighefficacylightsources.htm. [Accessed: 06-Jan-2021].
CIE Australia Lighting Research Conference 2021 - Conference Programme Page 23 of 25

A MATTER OF LIFE AND STRESS: PREDICTING THE LIFETIME OF LED LIGHTING PRODUCTS

Steve Coyne1, Gillian Isoardi1, David Boughey2
1 Light Naturally
2 Department of Industry, Science, Energy and Resources
Correspondence: steve@lightnaturally.com.au
The ability to compare the cost of ownership between competing products is an important contributing factor to
procurement decisions. Parameters feeding into the cost of ownership equation for electrical appliances including LED
lamps are asset price, energy usage, life of product and any labour costs associated with replacement. All except the
life of the product are easily determined/estimated values. Not only is product lifetime difficult to determine, but it
potentially has the greatest influence on the accuracy of the cost of ownership and, ultimately, the validity of the
procurement decision.
The lifetime of a light source is the cumulative time it operates until it fails to provide a useful amount of light for its
intended purpose. This failure may be in the form of either a catastrophic failure, that is no light is emitted by the lamp,
or a parametric failure, where some light is emitted by the lamp but is unsatisfactory for the intended purpose. The rated
lifetime of a product is defined as the median lifetime of multiple units of the same product, thereby half the units will
have a lifetime shorter than this rated value and the remainder will exceed it. Due to the potentially long median lifetimes
of LED light sources, testing a large sample set of a product until fifty percent have failed to operate as intended is
impractical. Therefore, lifetime prediction methods must be used.
To be a complete predictor of a light source’s lifetime, all the common failure modes should be assessed and included
in the prediction model. Typical causes of catastrophic failure are electronic component or electrical connection failures.
Typical parametric failures are deterioration of the LED die (manifested by a shift in colour and/or reduced emission of
light) and LED driver performance (manifested as temporal light modulation and/or reduced light output).
Current test methods and prediction models for lifetime in international standards only consider the parametric failure
mode of light loss.
This presentation will briefly describe existing endurance and lifetime tests before discussing recent investigations into
test methods where products are exposed to various operating stresses while product performance data is acquired.
Finally, the opportunity to formulate prediction models combining these correlations of time to end of life with the different
operating stresses will be explored.
CIE Australia Lighting Research Conference 2021 - Conference Programme Page 24 of 25

CHALLENGES IN MEASURING ULTRAVIOLET RADIATION

Tony Bergen1
1 Steve Jenkins & Associates, Melbourne, Australia
Correspondence: tonyb@stevejenkins.com.au
Ultraviolet radiation (UVR) is optical radiation within the wavelength range 100 nm to 400 nm; further divided into the
sub-wavelength ranges UV-A (315 nm to 400 nm), UV-B (280 nm to 315 nm) and UV-C (100 nm to 280 nm).
The use of UVR, and in particular germicidal ultraviolet radiation (GUV) in the UV-C region, for purposes of disinfection
has become of greater interest since the advent of the SARS-COV-2 virus which carries the COVID-19 coronavirus
disease [1]. However, although it may be useful to use GUV for disinfection it is also important to know how much
radiation is being used, i.e. accurate measurement methods. Accurate measurements need accurate and appropriate
calibration of the radiometers used to measure the UVR.
However, calibration and use of UV radiometers and spectroradiometers is complicated, and it is very easy to end up
with large errors. Factors such as spectral mismatch; directional response; and the respective positions of the reference
planes of the source and detector become critical in performing accurate measurements. For wavelengths below 250
nm, aspects such as metrological traceability; reliable calibration sources; detector responsivity stability; and
atmospheric absorption become important. Although guidance is available for characterisation and calibration of UV
radiometers [2], many people who use UV radiometers remain unaware of the care that needs to be taken to properly
match the calibration and use of the instrument.
In this presentation these challenges will be highlighted, as well as progress in research the author is undertaking into
atmospheric absorption of the UV-C radiation and the difficulty this creates in passing on metrological traceability
between sources and instruments at short wavelengths.
References
[1] “CIE Position Statement on the Use of Ultraviolet (UV) Radiation to Manage the Risk of COVID-19 Transmission”, International
 Commission on Illumination, Vienna, 2020 [https://cie.co.at/publications/cie-position-statement-use-ultraviolet-uv-radiation-
 manage-risk-covid-19-transmission, accessed 11/01/2021]
[2] CIE 220:2016 “Characterization and Calibration Methods of UV Radiometers”, International Commission on Illumination,
 Vienna, 2016
CIE Australia Lighting Research Conference 2021 - Conference Programme Page 25 of 25

ESTIMATING ILLUMINANCE WHEN VIEWING A VIRTUAL REALITY SCENE ON THE OCULUS QUEST USING
THE UNREAL ENGINE

Mei Ying Boon1,2,3, Kaj Suaning3, Dhimas Hari Sakti3,4, Brian Cheng2, Elisa.Cornish3, Gregg Suaning3, John Grigg3
1 University of Canberra, Canberra, Australia
2 University of New South Wales, Sydney, Australia
3 University of Sydney, Sydney, Australia
4 Universitas Gadjah Mada, Yogyakarta, Indonesia
Correspondence: Mei.Boon@canberra.edu.au
Virtual Reality (VR) headsets create immersive worlds. VR may be used to assess vision-guided mobility, which is an
increasingly important outcome measure to assess the efficacy of treatments e.g. bionic prostheses and gene therapies
for conditions such as macular degeneration and retinitis pigmentosa [1,2]. VR measures for vision-guided motion can
be used to assess a wide range of scenarios without needing space to build physical obstacle courses and minimal
safety concerns. It is essential that vision-guided motion is assessed at a range of light levels for many vision conditions:
e.g. one RP study assesses 1-256 lux [3] and the Multi-Luminance Mobility Test assesses 1-400 lux [4]. In this study
we investigated illuminance generated using the UNREAL engine and the Oculus Quest headset for one VR scenario.
Methods and Results: A method was developed to estimate illuminance. Unreal Engine was used to create a single
grey VR room illuminated from above by a single light. VR candelas were input to the engine and illuminance estimated
for a 12 mm viewing vertex distance, based on illuminance measurements using the International Light Technologies
1700 illuminance meter at a known distance (see Figure 1).

 Estimated illuminance at 12 mm viewing distance from the VR display lens
 500
 at the eye in the VR headset
 Estimated Illuminance (lux)

 400

 300

 200

 100

 0
 1 10 100 1000 10000
 Input value into the Unreal engine (VR candelas)

 Figure 2: Relationship between virtual candelas and average illuminance viewed. Error bars are +/- 1 standard deviation.
Conclusion: With a single VR light, VR wall illumination levels were similar to the range of physically constructed vision-
guided mobility tests. For values >300 VR candelas (cd) a ceiling was reached, and values
You can also read