Corporate Presentation - August 2018 - Amyris Investors

Page created by Carmen Larson
 
CONTINUE READING
Corporate Presentation - August 2018 - Amyris Investors
Corporate Presentation
         August 2018

Page 1
Corporate Presentation - August 2018 - Amyris Investors
Cautionary Notes
         Cautionary Notes
   FORWARD-LOOKING STATEMENTS
   This presentation and oral statements accompanying this presentation contain forward-looking statements, and any statements other
   than statements of historical fact could be deemed to be forward-looking statements. These forward-looking statements include,
   among other things, statements regarding future events, such as expected revenue, gross margin and EBITDA for 2018 and beyond,
   including revenue and EBITDA growth and revenue and gross margin composition, Amyris becoming a global leader in the health and
   beauty market, the anticipated development and commercialization of Amyris’s product pipeline and introduction of new products,
   expected sources of 2018 operating funding, anticipated future business growth and financial performance, expected growth of
   Amyris’s target markets, the anticipated consummation of significant licensing agreements with partners in China, expected product
   shipments, anticipated demand for Amyris products, expected sales of and number of stores selling Amyris products, and expectations
   regarding Amyris’s financial and operational results and ability to achieve its business plan in 2018 and beyond. These statements are
   based on management’s current expectations and actual results and future events may differ materially due to risks and uncertainties,
   including risks related to Amyris’s liquidity and ability to fund operating and capital expenses, potential delays or failures in
   development, production and commercialization of products, risks related to Amyris's reliance on third parties, and other risks detailed
   from time to time in filings Amyris makes with the Securities and Exchange Commission, including Annual Reports on Form 10-K,
   Quarterly Reports on Form 10-Q and Current Reports on Form 8-K. Amyris disclaims any obligation to update information contained in
   these forward-looking statements, whether as a result of new information, future events, or otherwise.

   NON-GAAP FINANCIAL INFORMATION
   This presentation and oral statements accompanying this presentation contain both GAAP and non-GAAP financial
   information. Amyris considers non-GAAP information to be a helpful measure to assess its operational performance and for financial
   and operational decision-making. Where non-GAAP financial measures are presented in these slides or in oral statements
   accompanying this presentation, a presentation of the most directly comparable GAAP financial measure and a reconciliation between
   the non-GAAP financial measure and the most directly comparable GAAP financial measure may be found in the slides of this
   presentation or in the news release distributed on August 6, 2018, which is available at investors.amyris.com.

Copyright © 2018 Amyris, Inc. All rights reserved                     2
Corporate Presentation - August 2018 - Amyris Investors
Our mission

                                                    Our Mission
                               Make the world healthier one molecule at a
                                                 time

Copyright © 2018 Amyris, Inc. All rights reserved        3
Corporate Presentation - August 2018 - Amyris Investors
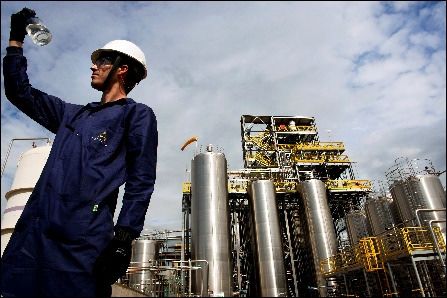
Our Markets                                                                    Our Select Leading Partners                                                                  Our Performance
                                                                                                                                                                                                  CAGR 4

                                                                                                                                                                                             Amyris        Market
          Health & Wellness

          Vitamins                                                                                                                                                                           162.3%        6.2%     1

          Sweeteners
          Human Nutrition Ingredients

                                                                                                                                                                                             Amyris        Market
          Clean Beauty
          Biossance
          No Compromise Ingredients                                                                                                                                                          50.6%         4.9%     2

          Flavor & Fragrance
          Ingredients
                                                                                                                                                                                             Amyris        Market
          Flavors
          Fragrances                                                                                                                                                                         40.7%         4.2%     3

    1 – Researchmoz, Health & Wellness Market, 2017-2021   2 - Transparency Market Research, 2015-2021 3 – Report Linker, 2017-2022 4 – Amyris CAGR represents 2015-2022 revenue estimates

Copyright © 2018 Amyris, Inc. All rights reserved                                                                               4
Corporate Presentation - August 2018 - Amyris Investors
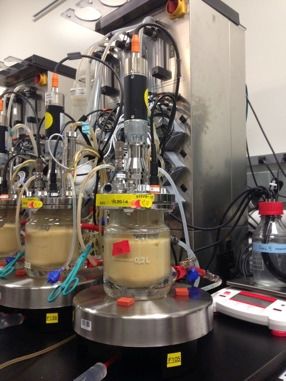
We have a proven business model that is delivering industry
leading growth

                                                             Benefits of model
                                              • Covers direct R&D costs
                                              • High investment returns from funded
                                                development
                                              • Long-term annuity from product profit share
              1     Target                          2    Develop           3   Supply           4   Profit split

                        Upfront                         Milestone          Sale and profit on   Split profit on
                        funding                         payments           shipment to          partners
                                                        from partner       partner              downstream sale
Copyright © 2018 Amyris, Inc. All rights reserved                      5
Corporate Presentation - August 2018 - Amyris Investors
Revenue ($M)                                                            1                                  2018 expected
                                                                                                                range $185-$195
                                                                                                               Gross Margin ~ 70%

                                                                                                        $143
                                                                           CAGR 2015-2017
                                                                                        105%

                                                                                             $67

                               $34

                              2015                                                           2016       2017       2018 Forecast
      1 – Figures for 2015-2017 are actuals, others are estimated and previously disclosed

Copyright © 2018 Amyris, Inc. All rights reserved                                                   6
Corporate Presentation - August 2018 - Amyris Investors
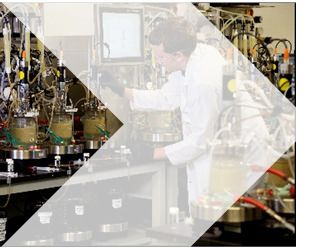
Revenue Growth by Market                                                                                             1

              ($M)
          $1000M

            $900M
                                                      CAGR 1                                                        CAGR 1                                     CAGR 1
            $800M                              2015-2017 2018-2022                                           2015-2017 2018-2022                      2015-2017    2018-2022
                                                  30%        49%                                                54%       41%                           716%          71%
            $700M

            $600M

            $500M

            $400M

            $300M

            $200M

            $100M                                                                                                                                           $77M
                                                                                                           $39M $39M
                                $8M $7M $13M                                                        $16M                                         $1M $15M
               $0M
                                                    Clean Beauty
                                                    Clean Skincare                                         Flavor & Fragrance
                                                                                                               Flavors & Fragrances                         Health&&Wellness
                                                                                                                                                            Health  Wellness
                                                                             2015            2016   2017       2018        2019    2020   2021    2022
      1 – Figures for 2015-2017 are actuals, others are estimated and previously disclosed

Copyright © 2018 Amyris, Inc. All rights reserved                                                                      7
Corporate Presentation - August 2018 - Amyris Investors
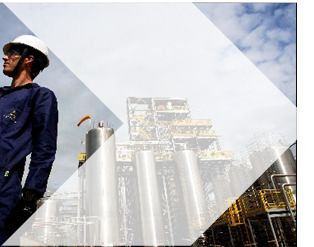
We engineer microbes to produce naturally-derived chemicals at
                              a cost advantage over other sources
                               Cultivation                    Extraction
                                                                                                         H

                                                                                            O
                                                                                         O O
                                                                                         H                       H
                                                                                                 O

                                                                                                         O
                                                                                   Artemisinin

                                       14 months
                                                                                                                     DERIVATIVES
                                Fermentation                   Chemistry
                                                                     H                               H

                                                                                        O
                                                                         H
                                                                                     O O

                                                                HO
                                                                     H               H
                                                                                             O
                                                                                                             H
                                                                                                                                   ACT Therapy
                                                                     O                               O

                                                                Artemisinic Acid    Artemisinin

                                          14 days

                              Amyris fermentation-derived molecules are cost-advantaged over ALL
                              other sources, without the complex supply chain, quality issues and price
                              volatility of traditional sources.

Copyright © 2018 Amyris, Inc. All rights reserved                        8
Corporate Presentation - August 2018 - Amyris Investors
Building and testing of strains & processes

                                      Automated     High-
            Automated                 Strain        throughput
            Design                    Engineering   screening         Fermentation         Analytics      Manufacturing

                                                     Data capture, Machine learning, Human intelligence

Copyright © 2018 Amyris, Inc. All rights reserved                         9
Corporate Presentation - August 2018 - Amyris Investors
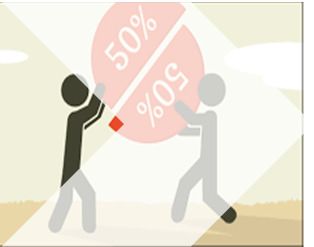
How it works: Amyris’ proven industrialized strain
                                     generation and commercialization

              BUILD STRAINS                              TEST STRAINS & PROCESSES                     MANUFACTURE

               Millions strains/mo         120,000 strains/mo    60 strains/mo         2 strains/mo    2-4 strains/yr

                   Mutagenesis,                  96-well           0.5L & 2L             300 L           200,000 L
                    Meiosis &                   Screening        Fermentation         Fermentation     Fermentation
                   Automated                                                               &                &
                      Strain                                                          Recovery Ops     Recovery Ops
                   Engineering

                                                    Design and Learn: Automation, Computing

Copyright © 2018 Amyris, Inc. All rights reserved                                10
The over 800 issued patents and pending patent applications owned, co-
   owned by, or licensed to us provide significant entry barriers and a strong,
   sustainable competitive advantage.

                                                     314 pending
                                                    US and foreign
                                                        patent
                                                     applications
                                                                     499 issued US and
                                                                       foreign patents

Copyright © 2018 Amyris, Inc. All rights reserved                    11
Accelerating disruption.
                                                                                         90%           80%          500%
                              From first strain to first pilot run
             45
                                                                                          Lower         Lower         Bigger
             40
                                                                                         average     average time    pipeline,
             35                                                                          product      to market.    powered by
                                                                                       development                     20%
             30
                                                                                           cost.                    increase in
    Months

             25                                                                                                     headcount
             20

             15

             10

              5

              0
                  Product 1     Product 2     Product 3   Product 4   Product 5

                   2012                                                2017

Copyright © 2018 Amyris, Inc. All rights reserved                                 12
$1200M
                                                                                                                                                              Revenue1
        Health
                                                                                                                              $1000M

        & Wellness
                                                                                                                              $800M

                                                                                                                              $600M

                                                                                                                              $400M

          716%                                   71%                               ~83%                                       $200M

                                                                                  2018 expected
          CAGR 2015 –                          CAGR 2018 –                                                                      $0M
                                                                                    non-GAAP                                           2015   2016   2017   2018   2019   2020   2021   2022
            2017 1                               2022 1
                                                                                  gross margin 1

   1 – Amyris, 2018-2022 estimated. Non-GAAP gross margin excludes depreciation and amortization, lower of cost or net
   realizable value adjustments, inventory write-downs, and excess capacity

Copyright © 2018 Amyris, Inc. All rights reserved                                                                        13
$200M
                                                                                                                                                           Revenue1
        Flavor                                                                                                                $180M

        & Fragrance                                                                                                           $160M

        Ingredients                                                                                                           $140M

                                                                                                                              $120M

                                                                                                                              $100M

                                                                                                                              $80M

                                                                                                                              $60M

            3 of 4                                   10                            ~73%                                       $40M

             Largest                                                                                                          $20M
            fragrance                           Molecules in                      2018 expected
         houses source                             active                           non-GAAP
         key ingredients                        development                       gross margin 1                               $0M
          from Amyris                                                                                                                 2015   2016   2017    2018   2019   2020   2021   2022

   1 – Amyris, 2018-2022 estimated. Non-GAAP gross margin excludes depreciation and amortization, lower of cost or net
   realizable value adjustments, inventory write-downs, and excess capacity
Copyright © 2018 Amyris, Inc. All rights reserved                                                                        14
$140M
                                                                                                                                                             Revenue1
        Clean                                                                                                                 $120M

        Beauty
                                                                                                                              $100M

                                                                                                                              $80M

                                                                                                                              $60M

                                                                                                                              $40M
          650%                                300%                                 ~47%
                                                                                                                              $20M

         Growth in retail                       Retail sales                      2018 expected
          sales since                         growth so far in                      non-GAAP
           2017/2016                               2018                           gross margin 1                               $0M
                                                                                                                                      2015   2016   2017   2018   2019   2020   2021   2022

   1 – Amyris, 2018-2022 estimated. Non-GAAP gross margin excludes depreciation and amortization, lower of cost or net
   realizable value adjustments, inventory write-downs, and excess capacity

Copyright © 2018 Amyris, Inc. All rights reserved                                                                        15
Sources of Operating Cash – Debt vs. Equity

                                                                                                      $195.3M
                $68.6M
                                            Sources of Operating Cash - Debt versus Equity
                                                             2015 - 2018
               ($M)
                                                                                                          $195.3M
             $200.00

             $180.00                                                                                $77.5M
                                                                                                     $77.5M
                                                                                                     Apollo
                                                                                                         $77.5M
             $160.00                                                                              $77.5M DSM
                                                                      $227M                                         $102.8M
             $140.00
                                                                     $10M
                                    $25M
             $120.00                                                       $10M
                                                                          $10M
                                                                      $99.5M
                                        $93.6M       $25M
                                                     $25M
                                                      $25M
             $100.00                                                                              $102.8M
                                                                      $10M
                                                                                                    $102.8M
                                                                                                        $102.8M
                                        $25M                              $89.5M
               $80.00
                                                      $68.6M
                                                                          $89.5M
                                                                            $89.5M                                      Self Fund
                                                     $68.6M
                                                     $68.6M           $89.5M
               $60.00                                                                                                  Operations
                                                                                                   $25M
                                      $68.6M
               $40.00
                                                                                          $165M       $25M
                                                                                                     $15M
               $20.00
                                                                                                          $15M       $15M
                $0.00
                                      2015                            2016                                2017        2018 Forecast
                                       2015                           2016                                2017              2018
                      Debt         Equity           DSM
                             Debt           Equity             DSM
Copyright © 2018 Amyris, Inc. All rights reserved                                    16
2020 Roadmap
                                                                                                                 Expected 2020 Growth Drivers                                 1

                                                                                                                                                                                                  2020 Expected Outlook

                                                                                                                                                                                                  Revenue:        ~$490 - 520M
                                                                                                                                                                Clean Beauty
                                                                                                                                                                                                  Gross Margin:          ~70%
                                                                                                                                                                                                  (Non-GAAP)

                                                                                                              Health & Wellness
                                                                                                                                                                         $180 - 190M              Adjusted        $190 – 220M
                                                                                                                                                                                                  EBIDTA
                                                                                                                                                                                  Revenue

                                                              Flavor & Fragrance                                       $70 - 80M                                    • 140 to 1000 doors
                                                                                                                                                                    • 1 new SKU / 60 days
                                                                                                                            Revenue                                 • New category
            2018 Baseline                                                                                                                                             launches for hair,
                                                                     $50 - 60M                                 • Increase in DSM                                      baby, men
                                  ~$185-195M                                                                     value share / royalties                            • Significant growth
            Revenue:                                                     Revenue
                                                                                                               • Launch of new vitamin                                from current
                                             ~70%                                                              • Growth in zero                                       ingredient business
            Gross Margin:                                   • Growth in current
            (Non-GAAP)                                                                                           calories sweetener
                                                            • New high value flavor

            Adjusted EBIDTA ~$10M

   1 – Amyris, 2018-2020 estimated. Non-GAAP gross margin excludes depreciation and amortization, lower of cost or net realizable value adjustments, inventory write-downs, and excess capacity

Copyright © 2018 Amyris, Inc. All rights reserved                                                                                     17
2018 Objectives on track
              1       In discussions for a total of three significant licensing agreements with
                      partners in China

              2
                      Anticipated $10 million shipment of key flavors & fragrances ingredient

              3       Most products experiencing better than expected demand

               4      Clean Beauty business (Aprinnova and Biossance) in growth trajectory

               5      Have customers in place for zero calorie sugar to sell all of our supply
                      over next three years

Copyright © 2018 Amyris, Inc. All rights reserved          18
Make good.                                              • Fastest growing skin care
                                                           brand in U.S.
               ™
 No compromise.                                          • One of fastest growing
                                                           companies on Nasdaq
                                                         • Most profitable product
   Good for People
                                                           portfolio in the industry with
   Good for the Planet                                     anticipated gross margin of
   Good for Business                                       ~70% for 2018

Copyright © 2018 Amyris, Inc. All rights reserved   19
Copyright © 2018 Amyris, Inc. All rights reserved   20
You can also read