The March 2020 episode of market turmoil and lessons for future financial stability

 
CONTINUE READING
The March 2020 episode of market turmoil and lessons for future financial stability
The March 2020 episode of market turmoil and
        lessons for future financial stability

                                   Anil Kashyap
                  University of Chicago Booth School of Business
                                    July 7, 2020

The views here are my own and not necessarily shared by the Bank of England’s
Financial Policy Committee. Thanks to Geoff Coppins, Lee Foulger and Bernat Gaul-
Ricart for helpful conversations on these matters.
The March 2020 episode of market turmoil and lessons for future financial stability
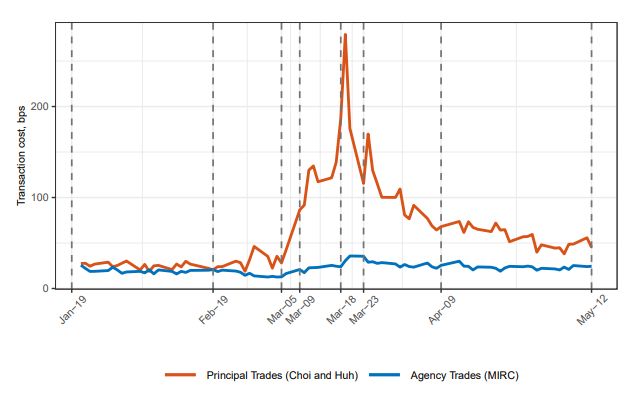
Outline

• Dislocations during March

• Interlinkages across markets

• Policy implications
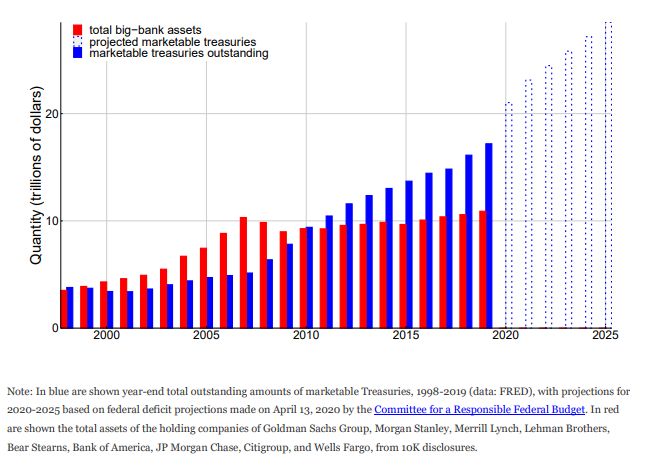
The speed and size of sales of US Treasuries challenged dealers’
intermediation capacity…
                     US equity prices and bond yields                                                              Primary dealer net inventories of US Treasuries

  Per cent                                UST 10y yield (RHS)                                 Basis
                                          S&P 500 (LHS)                                       points
               9 Mar                                                           15 Mar
    5                                                                                          10
    0                                                                                          -10
   -5                                                                                          -30
  -10                                                                                          -50
  -15                                                                                          -70
  -20                                                                                          -90
  -25                                                                                          -110
  -30                                                                                          -130
  -35                                                                                          -150
    Jan 20             Feb 20 Mar 20                    Apr 20 May 20                     Jun 20
  Sources: Bloomberg Finance L.P. and Bank calculations. Displayed as changes year to date.            The aggregate net inventory (long minus short) of primary dealers, maturity weighted by multiplying the
                                                                                                       net position in dollars by the number of years to the centre of each reported maturity class, to roughly
                                                                                                       reflect the sensitivity of market values to changes in yields.
                                                                                                       Source: Federal Reserve Bank of New York
The stock of marketable Treasuries has grown significantly relative
to dealer balance sheets

 Source: Duffie (2020) Still the World’s Safe Haven? Redesigning the U.S. Treasury Market After the COVID-19 Crisis
…and impaired UST market functioning, which only normalised
after Fed action
         Basis                                                                                                                 Basis
                                            UST 30y bid/offer spread (RHS)                   UST 2y cash-futures basis (LHS)
         points                                                                                                                points
       140.00                      15 Mar: USD swapline rate and                                                                  3.2
                                   maturity enhanced
       120.00                                                                             23 Mar: Federal                         2.8
       100.00                                                                                Reserve                              2.4
                                                                                         announces further
        80.00                                                                                measures                             2
        60.00                                                                                                                     1.6
        40.00                                                                                                                     1.2
        20.00                                                                                                                     0.8
          0.00                                                                                                                    0.4
       -20.00                                                                                                                     0
             Jan 20                          Feb 20                     Mar 20      Apr 20        May 20           Jun 20
        Sources: Bloomberg Finance L.P, Eikon by Refinitiv. and Bank calculations
        Note: The bid/offer spread is a 5-day moving average.
        Latest observation: 18 Jun 2020 (27 May 2020 UST 10y cash-futures basis)
Funding costs in USD increased, and only fell back once the Fed
introduced central bank swap lines
                                                                                                                          Dollar swaps outstanding
   Onshore and offshore rates for 3m dollar funding
                                                                                                                Other                                        Bank of Canada
                           OIS +[25bps to 50bps]                                                                Swiss National Bank                          Bank of England                    $ bns
                           Central bank USD swapline rate                                                       Bank of Japan                                European Central Bank               700
                           Onshore via USD LIBOR                                        Per cent
                                                                                                                Total
                                                                                             3.5                                                                                                 600
    15 Mar:
                                                                                                                                    20 Mar: Swapline
    Swapline rate and                                                                             3.0                                  frequency                                                 500
    maturity enhanced                       20 Mar: Swapline
                                                                                                  2.5                                  increased                                                 400
                                            frequency increased
                                                                                                  2.0
                                                                                                                                                                                                 300
                                                                                                                                           15 Mar:
                                                                                                  1.5                                      Swapline rate
                                                                                                                                           and maturity                                          200
                                                                                                  1.0                                      enhanced
          9 Mar                                                                                                                                                                                  100
                                                                                                  0.5
                                                                                                                                                                                                 0
                                                                                                  0.0   2007      2009        2011         2013         Mar 20 Apr 20 May Jun 20
   Feb 20           Mar 20             Apr 20            May 20               Jun 20                                                                                  20
   Sources: Bloomberg Finance L.P. and Bank calculations
   Note: Offshore funding calculations use FX swaps referencing 3 month Libor. The dotted light blue
   line indicates that prior to the 15 March 2020, swap lines were only offered at a 1-week, not 3       Sources: Bloomberg Finance L.P. , Federal Reserve and Bank calculations
   month, maturity.                                                                                      Note: Other includes the Reserve Bank of Australia, the Banco Central do Brasil, the
   Latest observation: 18 June 2020                                                                      Danmarks Nationalbank, the Bank of Korea, the Banco de Mexico, the Norges Bank, the
                                                                                                         Reserve Bank of New Zealand, the Monetary Authority of Singapore, and the Sveriges
                                                                                                         Riksbank.
                                                                                                         Latest observation: 11 Jun 2020
A similar dynamic was seen in the UK gilt market, which also
became impaired, and normalised after the BoE’s QE…
                                     Gilt yields                                                   Bid-offer spreads on gilts
      5 year              10 year                30 year             Per cent                           5 year      10 year
                                                                                                                          Basis
                                                                                                        30 year          points
                                                                         1.6                                                 4
                                            19 Mar: BoE package                                            19 Mar: BoE
                                                                         1.4                               package           3.6
                                            (Bank rate cut 15bps
                                            and additional £200bn        1.2                                                 3.2
                                            asset purchases)             1                                                   2.8
                                                                         0.8                                                 2.4
                                                                                                                             2
                                                                         0.6
                                                                                                                             1.6
                                                                         0.4
                                                                                                                             1.2
                                                                         0.2                                                 0.8
                                                                         0                                                   0.4
                                                                         -0.2                                                0
 Jan 20     Feb 20 Mar 20 Apr 20 May 20 Jun 20                                  Jan 20 Feb 20 Mar 20 Apr 20 May 20 Jun 20

    Source: Bloomberg Finance L.P., TradeWeb and Bank calculations              Source: Eikon by Refinitiv
    Latest observation: 18 June 2020                                            Data up to: 18 June 2020
…and in sterling money markets, which became stressed and only
stabilised when the BoE launched QE and liquidity support
                    Sterling money market spreads                                                                          MMF outflows and assets
          Overnight reverse repo - Bank rate spread                                        Basis       £                                                        Per
          3-month reverse repo-OIS spread                                                                       ‘Dash for cash’
                                                                                           points      billions                                                 cent
          3-month £LIBOR-OIS spread 24 Mar: CTRF
                                                                                                      270                                                           4
                                                               announced                        100
  19 Mar: Further BoE                                                                                 260                                                          3
       package                                                          31 Mar:                 80
                                                                                                                                                                   2
                                                                        Quarter-                      250
                                                                                                60
                                                                          end                                                                                      1
                                                                                                40    240
                                                                                                                                                                   0
                                                                                                20    230
                                                                                                                                                                   -1
                                                                                                0     220                                                          -2
                                                                                                -20   210                                                          -3
 Jan 20         Feb 20 Mar 20 Apr 20 May 20 Jun 20                                                      Mar 20                          Apr 20         May 20
 Source: Bank of England Sterling Money Market data collection and Bank calculations.                  Sources: Crane Data LLC and Bank calculations
 Notes: The overnight reverse repo rate is for cleared DBV (Delivery by Value) transactions. The 3-
 month reverse repo rate uses only transactions estimated to be non-nettable (under leverage ratio
 rules). Both rates are volume-weighted and are stated from the perspective of dealers.
 Last observation: 18 June 2020
During the market stress in March, ‘flight to safety’ movements
widened the spread between IG bonds and government bonds…
         Basis
         points
                          Non-financial corporate investment-grade spreads
         500

         400

         300

         200

         100

           0
          1/1/2020   2/1/2020     3/1/2020        4/1/2020    5/1/2020       6/1/2020   7/1/2020

                                         GBP IG     USD IG   EUR IG
…and dealers stopped absorbing US corporate bonds, and shed
some of their inventory, leading to higher trading costs
 Cumulative inventory change (USD billions) in the
                                                                                             Transaction costs in the US corporate bond market
 dealer sector and as a fraction of total supply

              Primary Dealer
              Credit Facility
              announced

                                                     Primary and Secondary Market
                                                     Corporate Credit Facilities announced

Source: Corporate Bond Liquidity During the COVID-19 Crisis (Kargar et al)
Interlinkages across markets
What were the market interlinkages in March’s ‘dash for cash’?

Large margin calls on derivatives forced funds and                         …and withdrawals from money market funds and
insurers to raise cash through repo or bond sales…                         other open-ended funds added selling pressure to
                                                                                        asset markets and money markets.
                                                        Bond liquidation

                    The usual stabilisers in government bond markets did not work as leveraged
                     investors were forced to sell, and dealers became overwhelmed by selling
                                                      pressure.

                           Bond market illiquidity                                  Funding illiquidity puts
                             spreads to funding                                    pressure on bond markets
                                  markets

                    As bond prices fell and became                    …which forced more of the
                    volatile, it became difficult and               investors trying to raise cash to
                          expensive to repo…                                   sell bonds.
Policy implications
What could be the policy implications of March’s ‘dash for cash’?

• If central banks step in during stress to backstop financial markets, is greater resilience in
  markets need (via regulation or market reform)? Which markets should be covered?

• How should the financial system best adapt to a world where markets may not be able
  to rely on dealers to maintain levels of liquidity at all times and other intermediaries are
  involved in market making?

• If even sovereign bonds can become illiquid, what does that mean for banks' liquidity
  regulation?

• Do we need to change MMMF regulation to ensure that MMMFs retain cash like
  properties even in stress?
Further reading
Further reading on March’s ‘dash for cash’

• BoE – Interim Financial Stability Report May 2020

• Jon Cunliffe, Deputy Governor, Financial Stability, BoE –
• “Financial System Resilience: Lessons from a real stress”

• Andrew Hauser, Executive Director, Markets, BoE
“Seven Moments in Spring: Covid-19, financial markets and the Bank of
England’s balance sheet operations”

• BIS – Annual Economic Report 2020
You can also read