Q1 2019 EARNINGS Presentation

Page created by Travis Robinson
 
CONTINUE READING
Q1 2019 EARNINGS Presentation
Q1 2019
EARNINGS Presentation
Q1 2019 EARNINGS Presentation
Disclosures
This presentation contains non-GAAP financial measures relating to our performance. You can find the reconciliation of these measures to
the most directly comparable GAAP financial measure in the Appendix at the end of this presentation. The non-GAAP financial measures
disclosed by Intel should not be considered a substitute for, or superior to, the financial measures prepared in accordance with GAAP. Please
refer to “Explanation of Non-GAAP Measures” in Intel's quarterly earnings release for a detailed explanation of the adjustments made to the
comparable GAAP measures, the ways management uses the non-GAAP measures and the reasons why management believes the non-GAAP
measures provide investors with useful supplemental information.

Statements in this presentation that refer to business outlook, future plans and expectations are forward-looking statements that involve a
number of risks and uncertainties. Words such as "anticipates," "expects," "intends," "goals," "plans," "believes," "seeks," "estimates,"
"continues," "may," "will," “would,” "should," “could,” and variations of such words and similar expressions are intended to identify such
forward-looking statements. Statements that refer to or are based on estimates, forecasts, projections, uncertain events or assumptions,
including statements relating to total addressable market (TAM) or market opportunity, future products and the expected availability and
benefits of such products, and anticipated trends in our businesses or the markets relevant to them, also identify forward-looking statements.
Such statements are based on management's expectations as of April 25, 2019 and involve many risks and uncertainties that could cause
actual results to differ materially from those expressed or implied in these forward-looking statements. Important factors that could cause
actual results to differ materially from the company's expectations are set forth in Intel's earnings release dated April 25, 2019, which is
included as an exhibit to Intel’s Form 8-K furnished to the SEC on such date. Additional information regarding these and other factors that
could affect Intel's results is included in Intel's SEC filings, including the company's most recent reports on Forms 10-K and 10-Q. Copies of
Intel's Form 10-K, 10-Q and 8-K reports may be obtained by visiting our Investor Relations website at www.intc.com or the SEC's website at
www.sec.gov.

All information in this presentation reflects management’s views as of April 25, 2019. Intel does not undertake, and expressly disclaims any
duty, to update any statement made in this presentation, whether as a result of new information, new developments or otherwise, except to
the extent that disclosure may be required by law.

                                                                                                                                           2
Q1 2019 EARNINGS Presentation
Executive Summary
      Q1 results slightly above January expectations

Revising full year expectations based on customer feedback

         Intensifying our focus in three key areas

                                                             3
Q1 2019 EARNINGS Presentation
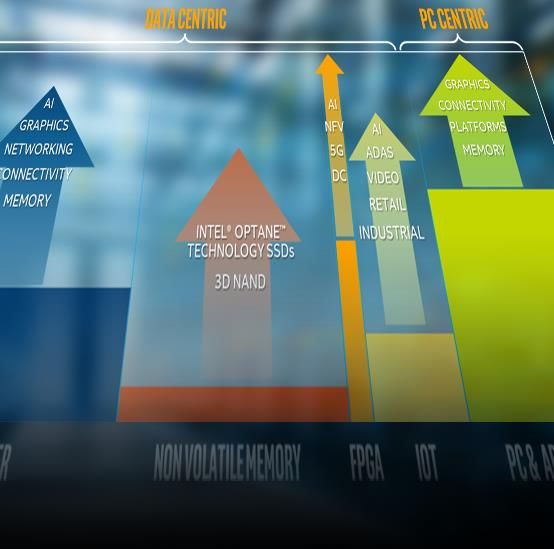
Expanding TAM… Accelerating innovation…
                  Improving Execution & Evolving Culture
     Expanded TAM               Accelerating innovation          Execution & culture

                                      product                        ONE intel
   Opportunity                       leadership
Data-centric portfolio launch   1st US exascale supercomputer    Increasing 14nm capacity
Mobileye REM wins N.A. OEM      New 9th Gen mobile processors     Ice Lake 10nm qual Q2
    Sharpened 5G focus          Improved 10nm factory velocity   Raising 2019 10nm volume

                                                                                          4
Q1 2019 EARNINGS Presentation
Full Year 2019 Outlook
                                     Revenue                                                               Operating Margin                             EPS
                                                                                                                                          1                   1

                       $69B
              Data-centric down low single digits YoY
                                                                        Down ~3%
                                                                          YOY                              32%                  DOWN
Q1 2019 EARNINGS Presentation
Q1’19 Results
Q1 2019 EARNINGS Presentation
Q1’19 Financial     Highlights
               Revenue flat... Non-GAAP EPS up 2%

• Q1 Revenue $16.1B, flat YoY… Data-centric $7.5B... PC-centric $8.6B

• Q1 Non-GAAP Operating Margin 28%, down 2ppt… lower spending &
 ASP strength offset by impact of 10nm ramp & NAND reserves

• Delivered Q1 Non-GAAP EPS of $0.89, up 2% YoY… McAfee dividends
 & lower share count partially offset by lower operating margin

• Year-to-date generated $1.6B of free cash flow... Returned $3.9B to
 shareholders… Paid dividends of $1.4B… Repurchased 49M shares

                                                                        7
Q1 2019 EARNINGS Presentation
Non-GAAP    EPS   Up  2%
                                                                                                                                                                         1

                                                    Strong mix, spending discipline & reduced share
                                                                 count partially offset by 10nm ramp costs
                                                         EPS Drivers Year-Over-Year
                                                                                                                                                                    EPS up $0.02
                                                          $0.16                                                                             $0.07        $0.89
                  $0.87
                                                                                                                      $0.06
                                                                                                                                                                    Platform Execution
                                                                                                                                                                    • Enterprise & Government inventory correction
                                    ($0.13)                                   ($0.13)             ($0.01)                                                           • PC supply constraints partially offset by strong mix
                                                                                                                                                                    • Platform costs driven by 10nm ramp
                                                                                                                                                                    Adjacencies
                                                                                                                                                                    • NAND pricing pressure
                                                                                                                                                                    • Modem and Mobileye revenue growth
                                                                                                                                                                    Disciplined Spending
                                                                                                                                                                    • Lower spending due to divestitures and SG&A
                                                                                                                                                                      leverage
                                                                                                                                                                    Capital Allocation & Other
                Q1'18               Platform 2          Platform             Platform         Adjacent Biz.3 Spending                    Capital Alloc.4   Q1'19
                                                                                                                                                                    • Lower share count
              Non-GAAP              Volume                ASP                  Cost                                                        & Other       Non-GAAP   • McAfee dividend
Operating                           -1.1pts                                                      -0.4pts
  Margin           29.8%                                +2.0pts             -4.4pts                                   +2.1pts                            28.0%

1. EPS & Operating Margin are presented on a non-GAAP basis. Refer to the Appendix for a reconciliation of these non-GAAP measures.
2. Platform includes CCG, DCG and IOTG microprocessors and chipsets.
3. Adjacent Business includes gross margin impact from non-platform products.                                                                                                                                        8
4. Capital Alloc. & Other includes impact of changes in share count, tax rate, gains/losses on equity investments, interest and other.
Total spending as % of revenue
                          Down from 32.4% to 30.3% YoY
               Spending as % of Revenue                          Total Spending ($B)

       36.6%                                             $5.4          $5.2
                       32.4%          30.3%                                            $4.9
       14.2%                                             $2.1           $1.9
                        11.8%                     SG&A                                 $1.5
SG&A                                      9.5%

R&D                                               R&D
       22.4%            20.6%             20.7%          $3.3           $3.3           $3.3

       Q1'17            Q1'18             Q1'19          Q1'17          Q1'18          Q1'19

                       Creating opex leverage while maintaining R&D
                                                                                               9
DATA CENTER group
      Revenue ($B) down 6% YoY                 Operating Income ($B) down 29% YoY
                                                                                      Q1’18 to Q1’19         YoY Revenue ($)
                                                                                    Platform                      (7%)
                                                                                    Adjacencies                    2%
      $5.2
                                   $4.9                                              Market Segments         YoY Revenue ($)
       $0.4
                                       $0.4
                                                                                    Cloud SP                       5%
                                                                                    Enterprise & Gov.            (21%)
                                                    $2.6                            Comms SP                      (4%)
       $4.8                            $4.5                            $1.8
                                                                                       DCG Platform            YoY Growth
                                                 Op Margin 50%
                                                                    Op Margin 38%
                                                                                    Unit Volumes                  (8%)
                                                                                    Average Selling Prices         1%

      Q1'18                        Q1'19            Q1'18              Q1'19
              Platform   Adjacencies

China weakness & inventory correction broadly impacting DCG… Cloud absorbing capacity
Op margin down on lower revenue, initial 10nm costs and increased roadmap investments
                                                                                                                    10
Other data-centric business Segments… Revenue flat
                             IOTG + Mobileye ($M)                                               NSG ($M)                                         PSG ($M)
                       Rev        Op Income                                       Rev    Op Income                               Rev    Op Income

                                                           $209
                        $151                                                       $1,040
                                                           $910                                            $915
                        $840

                                                                                                                                 $498                  $486
                                       $10                                $68

                                                                      $251                                                                 $97                      $89
                                      $227

                                                                                            ($81)                   ($297)
                                          IOTG            Mobileye

                              Q1'18                               Q1'19                 Q1'18                   Q1'19                  Q1'18                Q1'19

                • IOTG revenue up 19%1 on strength in                           • NSG revenue down YoY on continued          • PSG revenue down 2% YoY on weakness
                   video and industrial... operating income                      pricing pressure, offset by NAND bit          in Cloud & Enterprise (-55%), partially
                   up 11% YoY on mix shift to higher                             growth                                        offset by strength in Wireless (+30%)…
                   performance products                                                                                        Advanced node products (+30%)
                                                                                • Operating income down on market
                • Record Mobileye revenue, up 38% on                             weakness resulting in inventory             • Operating income down 8% on lower
                   continued customer momentum                                   revaluation, partially offset by cost         revenue
                                                                                 improvements
                                                                                • Reducing 2019 NAND output

1. IOTG growth rate excludes Q1’18 $74M for Wind River revenue.
                                                                                                                                                                          11
Client Computing Group
                                                                                                                                                 Q1’18 to Q1’19      YoY Revenue ($)
                         Revenue ($B) up 4%                                                                  Operating Income ($B) up 10%
                                                                                                                                             Platform                      3%
                                                                                                                                                                 1
                                                                                                                                             Modem/Adjacencies            26%

                      $8.2                                        $8.6                                                                          Market Segments      YoY Revenue ($)

                                                                   $0.8                                                                      Notebook                      5%
                       $0.6
                                                                                                                                             Desktop                      (1%)

                                                                                                                                                  CCG Platform         YoY Growth
                       $7.6                                        $7.8                                         $2.8              $3.1       PC Volumes                   (7%)

                                                                                                                                 Op Margin   Notebook ASP                 13%
                                                                                                               Op Margin
                                                                                                                                   36%
                                                                                                                 34%                         Desktop ASP                   7%

                     Q1'18                                       Q1'19                                          Q1'18             Q1'19
                           Platform                Modem/Adjacencies

       Revenue growth on richer product mix… strength in gaming, large commercial & modem
             Op margin up on revenue, lower spending, partially offset by 10nm ramp
                                                                                                                                                                                 12
1. CCG adjacencies include modem, connected home products, wireless communications and wired connectivity.
Q1’19 Sources & Uses of Cash
                                          Financial Flexibility… Returning Cash to Shareholders
                                                       $5.0
                                                                                                                                                             $1.5
                                                                                       ($3.3)                                                     $1.0
                                                                                                             ($1.4)
                                                                                                                                        ($2.5)
                                                                                                                                                                           $12.0
                    $11.7

          2019 Beg Total Cash              Cash From Operations                         Capex               Dividend                    Buyback   Net Debt   Other   2019 YTD Total Cash
              Investment                                                                                                                                                 Investment

                     $3.0                                                                                 GAAP Cash and Cash Equivalents                                    $3.2
                                                                                                                                             1
                    $11.7                                                                                     Total Cash Investments                                       $12.0
                                                                                                                                    2
                    $26.4                                                                                              Total Debt                                          $28.5

          Operating cash flow of $5B... Investing to expand 14nm capacity & ramp 10nm
                      Dividend up 5%... Repurchased 49M shares for $2.5B
1. Total cash investments include cash and cash equivalents, short-term investments and trading assets.
2. Total debt includes short-term and long-term debt.                                                                                                                              13
Q2’19 Outlook
                                     Revenue                                                                 Operating Margin                          EPS
                                                                                                                                            1                1

                  $15.6B                                                 Down 8%
                                                                           YOY                               29%                    DOWN 4 PPT
                                                                                                                                       YOY
                                                                                                                                                  $0.89          Down 14%
                                                                                                                                                                   YOY

             Data-centric down high single digits YoY                                                      Lower platform revenue, NAND pricing
                                      DCG ~flat QoQ                                                                and ramping modem               Tax rate ~11.5%
               PC-centric down high single digits YoY

                                                                                                                                                                      14
1. Presented on a non-GAAP basis. Refer to the Appendix for a reconciliation of these non-GAAP measures.
APPENDIX
Reconciliation of Non-GAAP Actuals
                                                               Three Months Ended
(In Millions, Except Per Share Amounts)                  Mar 30, 2019           Mar 31, 2018
GAAP OPERATING INCOME                                            $4,174                  $4,470
Amortization of acquisition-related intangible assets               331                       325
NON-GAAP OPERATING INCOME                                        $4,505                  $4,795

GAAP DILUTED EARNINGS (LOSS) PER COMMON SHARE                     $0.87                   $0.93
Amortization of acquisition-related intangible assets               0.07                      0.07
Ongoing mark-to-market on marketable equity securities            (0.05)                  (0.13)
Income tax effect                                                       —                       —
NON-GAAP DILUTED EARNINGS PER COMMON SHARE                        $0.89                   $0.87

                                                                            Three Months Ended

FREE CASH FLOW (In Billions)                                                   Mar 30, 2019
GAAP CASH FROM OPERATIONS                                                                     $5.0
Additions to property, plant and equipment                                                    (3.3)
FREE CASH FLOW                                                                                $1.6

GAAP CASH USED FOR INVESTING                                                              $(2.7)
GAAP CASH USED FOR FINANCING                                                              $(2.1)

                                                                                                      16
Reconciliation of Non-GAAP Outlook
                                                           Q2 2019        Full-year 2019
                                                           Outlook           Outlook
                                                         Approximately    Approximately
GAAP OPERATING MARGIN                                            27%                 30%
Amortization of acquisition-related intangible assets              2%                 2%
NON-GAAP OPERATING MARGIN                                        29%                 32%

GAAP EARNINGS PER SHARE                                          $0.83             $4.14
Amortization of acquisition-related intangible assets             0.07              0.29
Ongoing mark-to-market on marketable equity securities               —             (0.06)
Income tax effect                                                (0.01)            (0.02)
NON-GAAP EARNINGS PER SHARE                                      $0.89             $4.35

  FREE CASH FLOW                                                 Full-year 2019 Outlook
  (In Billions)
  GAAP CASH FROM OPERATIONS                                                         $30.5
  Additions to property, plant and equipment                                        (15.5)
  FREE CASH FLOW                                                                    $15.0

                                                                                             17
You can also read