Economic Value of using Remote Sensing in Eskom - Tshisikhawe Mphaphuli Group Technology Division 27 October 2014
←
→
Page content transcription
If your browser does not render page correctly, please read the page content below
1

    Economic Value of using
    Remote Sensing in Eskom

                  Tshisikhawe Mphaphuli

                  Group Technology Division

                  27 October 2014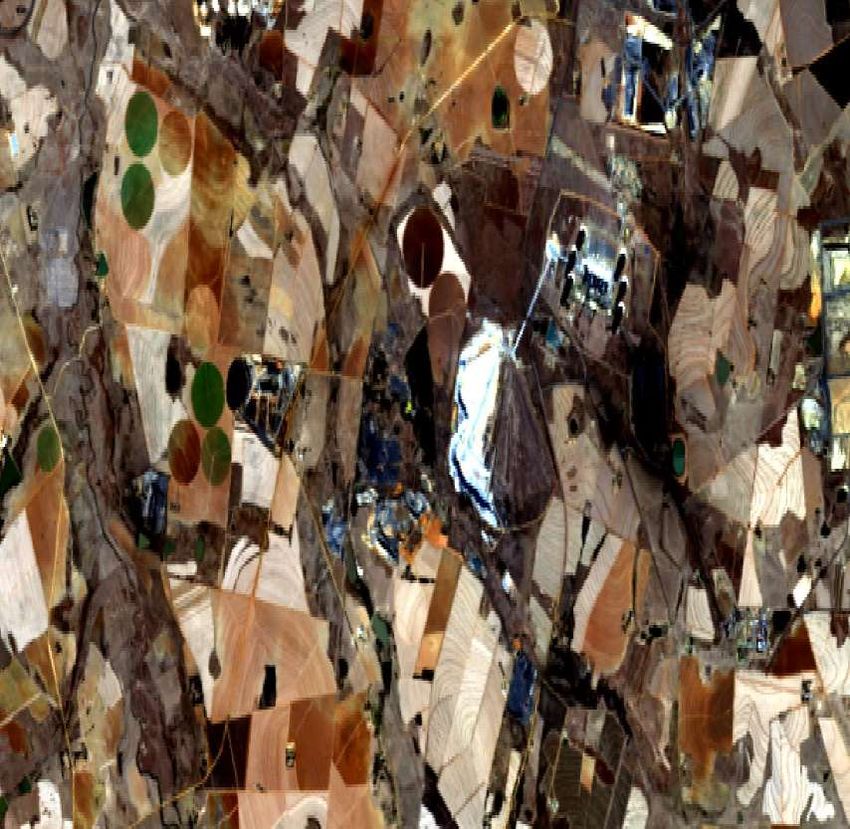
Disclaimer
•   This presentation does not constitute or form part of and should not be construed as, an offer to sell, or the solicitation
    or invitation of any offer to buy or subscribe for or underwrite or otherwise acquire, securities of Eskom Holdings SOC
    Limited (“Eskom”), any holding company or any of its subsidiaries in any jurisdiction or any other person, nor an
    inducement to enter into any investment activity. No part of this presentation, nor the fact of its distribution, should
    form the basis of, or be relied on in connection with, any contract or commitment or investment decision whatsoever.
    This presentation does not constitute a recommendation regarding any securities of Eskom or any other person.

•   Certain statements in this presentation regarding Eskom’s business operations may constitute “forward looking
    statements”. All statements other than statements of historical fact included in this presentation, including, without
    limitation, those regarding the financial position, business strategy, management plans and objectives for future
    operations of Eskom are forward looking statements.

•   Forward-looking statements are not intended to be a guarantee of future results, but instead constitute Eskom’s
    current expectations based on reasonable assumptions. Forecasted financial information is based on certain material
    assumptions. These assumptions include, but are not limited to continued normal levels of operating performance and
    electricity demand in the Customer Services, Distribution and Transmission divisions and operational performance in
    the Generation and Primary Energy divisions consistent with historical levels, and incremental capacity additions
    through the Group Capital division at investment levels and rates of return consistent with prior experience, as well as
    achievements of planned productivity improvements throughout the business activities.

•   Actual results could differ materially from those projected in any forward-looking statements due to risks, uncertainties
    and other factors. Eskom neither intends to nor assumes any obligation to update or revise any forward-looking
    statements, whether as a result of new information, future events or otherwise.

•   In preparation of this document certain publicly available data was used. While the sources used are generally
    regarded as reliable the content has not been verified. Eskom does not accept any responsibility for using any such
    information

•   The custodian of all satellite images used in this presentation is SANSA. Eskom Holdings SOC Limited spatial data is
    distributed free of charge.

Thursday, 04 December
2014                                                       2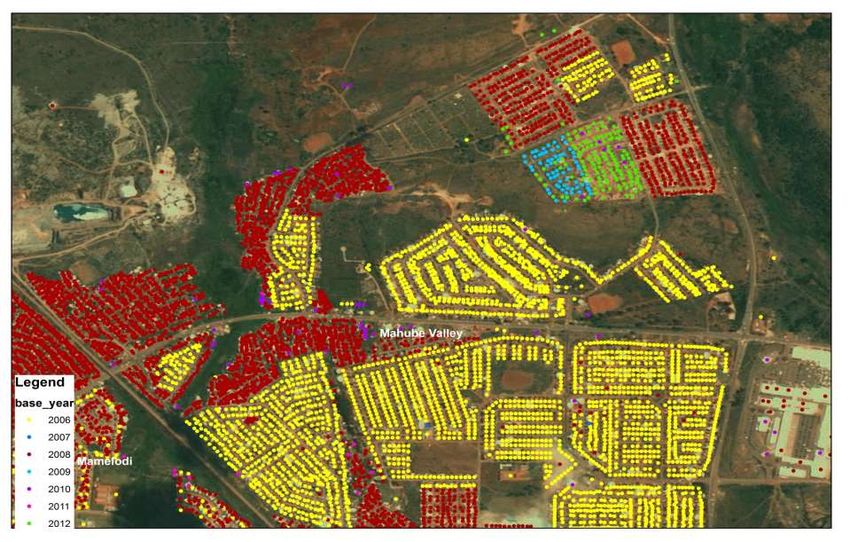
Mandate

• Eskom’s mandate remains to provide electricity in an
  efficient and sustainable manner, including the generation,
  transmission and distribution of electricity, the latter
  including wholesale and retail sales.

• Eskom is a critical and strategic contributor to the South
  African government’s goal of ensuring security of
  electricity supply in the country as well as economic
  growth and prosperity.

• Eskom’s purpose is to provide sustainable electricity
  solutions to grow the economy and improve the quality
  of life of the people in South Africa and the region.

Thursday, 04 December
2014                         3
Life cycle of project of Power line project

Pre-conceptual

                   Conceptual

                                Pre-feasibility

                                                  Feasibility
  Possible savings in Design
                                                                Execution

   Transmission 1% improvement +/-R15m                                      Operational

                                   HV improvement                                   Dismantling
                                   0,5% +/- R51m
                                                                                  Maintenance
                                              Distribution 0,25%
   Thursday, 04 December
   2014                                       improvement
                                               4             +/- R3,75m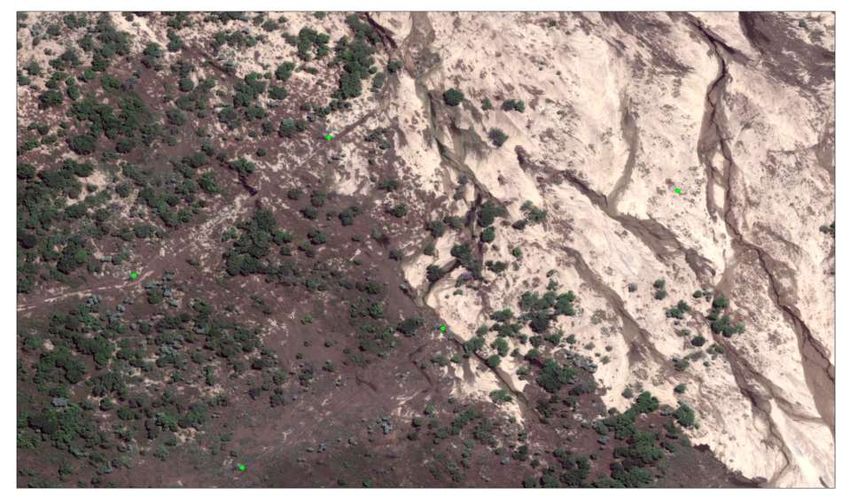
Remote Sensing Application

• Post Disaster management

• Vulnerability and risk Assessments

• Monitoring the effects of climate change

• Environmental forecasting

• Environmental impact assessment

• Policy development

• Planning

2014/12/04                             5
COST OF TRANSMISSION INFRASTRUCTURE

 • 1000 km per year;

 • 400 kV cost 2.8 million per km (60%)

 • 765 kV cost 3.3 million per km (40%)

 • 10 – 12 years construction including planning and
   design (life cycle)

 • > 50 years life span of a power line

 • Investment R1 536 million per annum
 Thursday, 04 December
 2014                     6
COST OF DISTRIBUSION INFRASTRUCTURE

• High Voltage or Sub-Transmission

    • 6000 km of per year

    • 132 kV -44kV cost R1.7 million per km

    • Life cycle of project 1 – 3 years construction
      including planning and design

    • 25 – 50 years life span of a power line

• Annual Investment R10 200 million per annum
 Thursday, 04 December
 2014                       7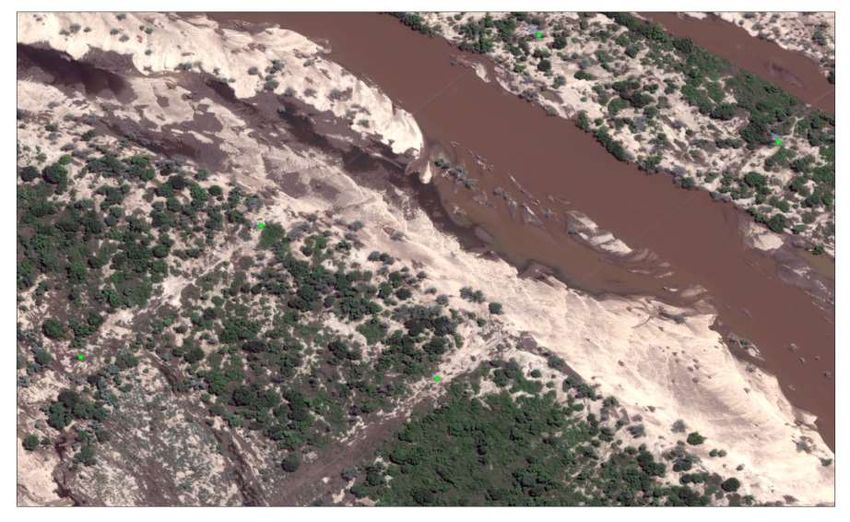
2006-2012 SBC_Mahube Village

Thursday, 04 December
2014                            8
ROUTE SELECTION

Thursday, 04 December
2014                    9
SERVITUDE MANAGEMENT Locating encroaching structures • Using a buffer analysis to create a boundary to delineate servitude width. Thursday, 04 December 2014 10
CHANGE DETECTION
2. Change Detection
The analysis involves using multi-date images
Creating a threshold to distinguish areas of no change, change, and more change.
2008-2009 2009-2010
Blue: Areas of no
change
Red: Areas of
more change
Red: Areas of
change
Grey: Areas of
less change
Thursday, 04 December
2014 2010-2011 11 2011-2012QUANTIFYING CHANGES
Analysis of change
Amount of change per year
Year Bare ground Urban built-up Vegetation Roads
2008 17.85 22.95 37 22
2009 10.5 31.6 37 20.9
2010 14.2 35.8 31.6 10
2011 12.6 30.3 35.8 21.1
2012 11.2 28.7 36.2 23.6
Total 66.35 149.35 177.6 97.6
Analysis
Percentage of change to total landuse/cover from 2009-
In terms of analysis the output matrix 2012
table is analyzed using pixel points per
class distribution indicating number of
pixel points growing or depreciating in
each year
The overall amount of change in each
year per respective class is counted
and aggregated total percentage of
change
Thursday, in each land use
04 December
2014 12SERVITUDE MANAGEMENT Electrostatic coupling • Generated low frequency electromagnetic fields- these are the circles of radiation around the electrical conductor and are capable of affecting human health • When vehicles are parked under high voltage transmission lines electrostatic fields are often developed and those electrical discharges often go to a person when a person touches the vehicle. • Illegal uses of land- in most cases where there’s existing structures under transmission lines is due encroachment which is commonly found in informal areas or areas without proper zoning of landuse. Thursday, 04 December 2014 13
Encroachment Analysis
Percentage of change detected from SBC derived from differenced images
Growth comparisons
Recorded encroaching households
Amount of encroachment
Thursday, 04 December
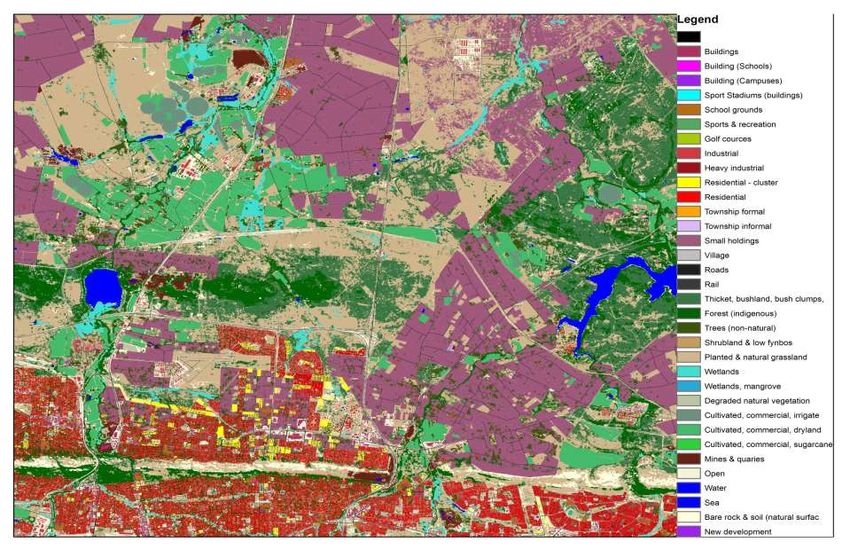
2014 14Land Cover Thursday, 04 December 2014 15
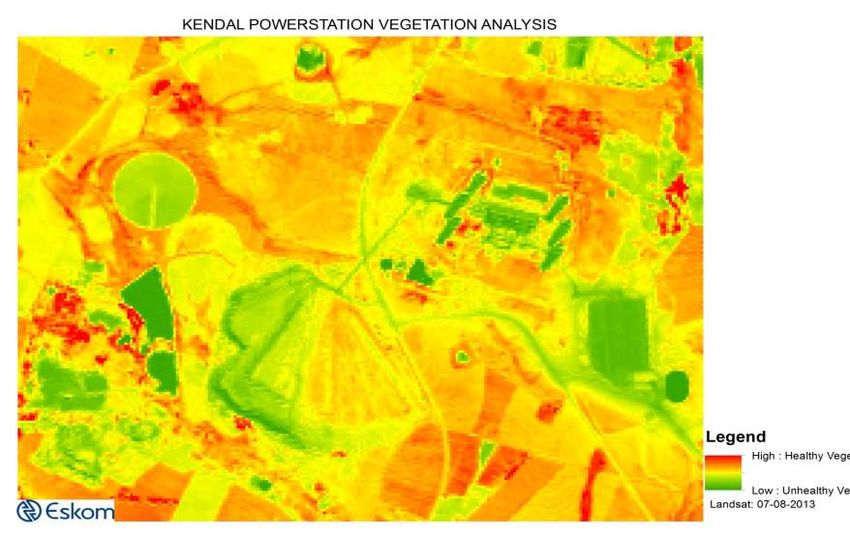
VEGETATION HEALTH INDEX ANALYSIS

Thursday, 04 December
2014                    16
HYDROCARBON MODELLING
Benefits
• Monitoring of Plumes to comply with the law and internal
policies;
• Saving cost on
Thursday, legal actions,
04 December
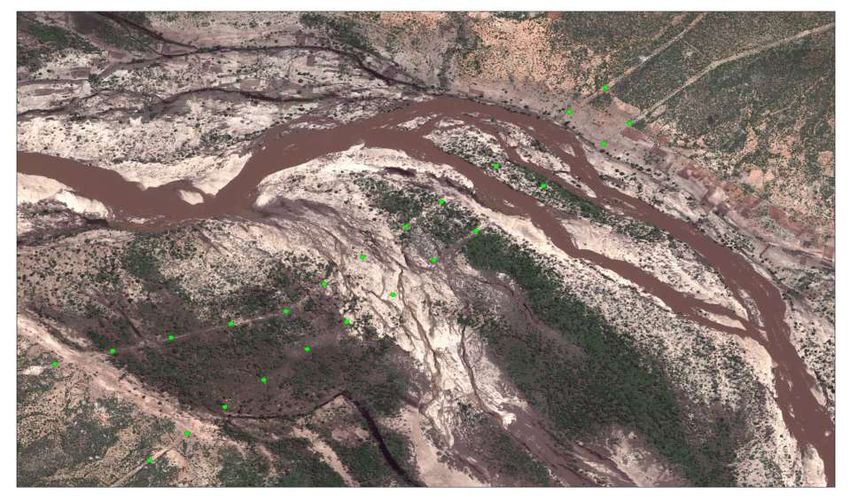
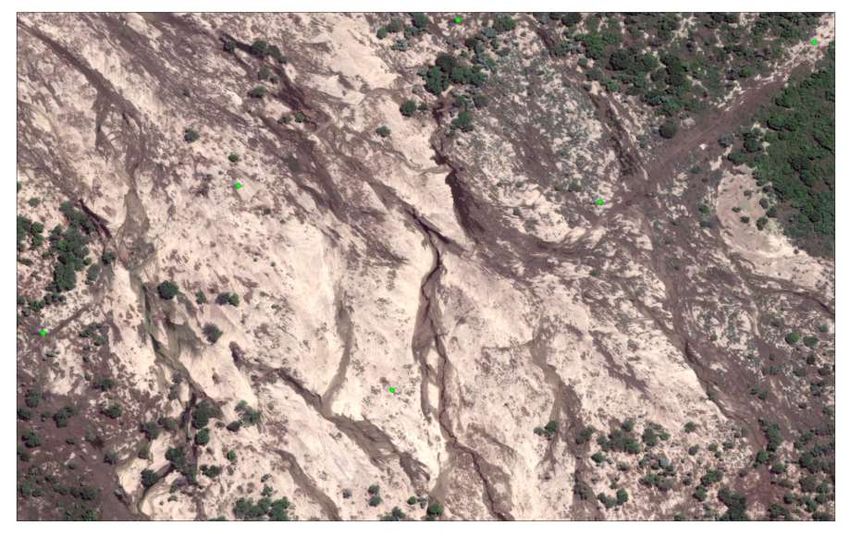
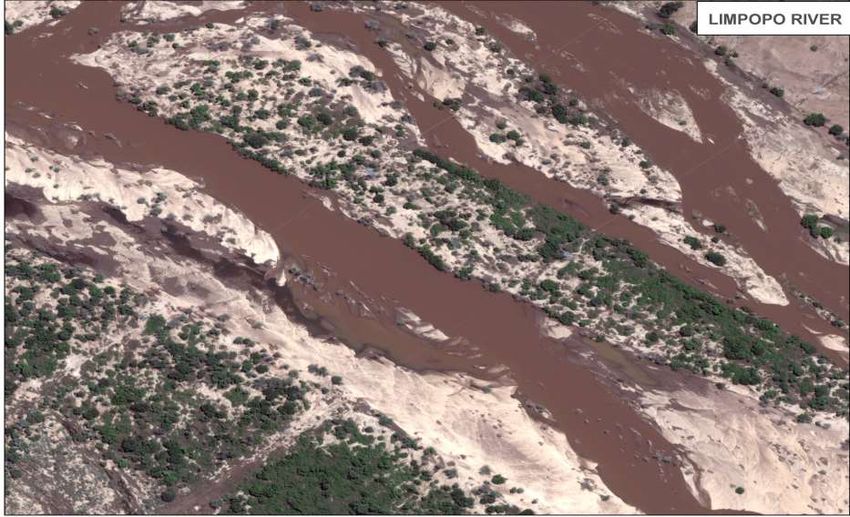
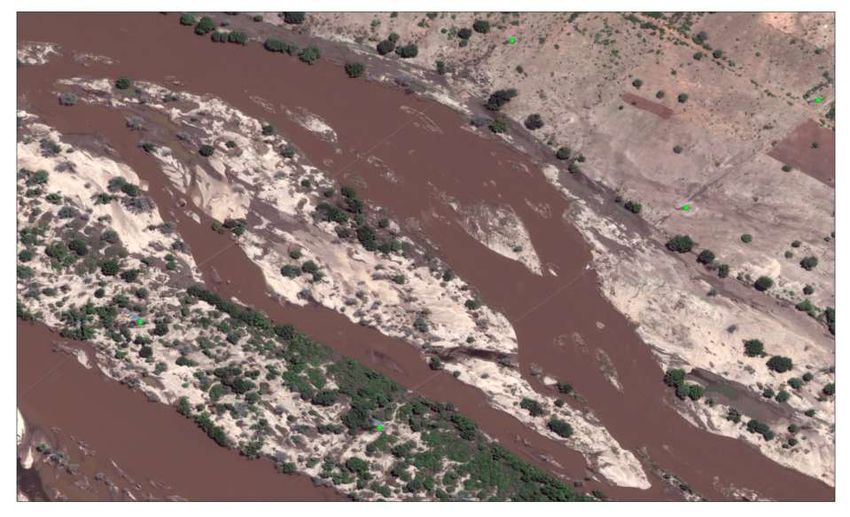
2014 17POST DISASTER MAPPING Thursday, 04 December 2014 18
Coal stockpile management

LiDAR and Terrestrial land survey

   • how much coal
   • in what quality
   • is located where.

 • Benefits

       • Optimizing stock capacity
      of coal stockpile

      • Determining the level of coal
      in the stockpile

   Thursday, 04 December
   2014                                 19
Thank you
Keep up with spying the earth
Keep lights on
To save electricity…..
20You can also read