Covenant Health Governance Institute - President & CEO Update Steve Grubbs May 12, 2022
←
→
Page content transcription
If your browser does not render page correctly, please read the page content below

Covenant Health Governance Institute
                President & CEO Update
                          Steve Grubbs

                            May 12, 2022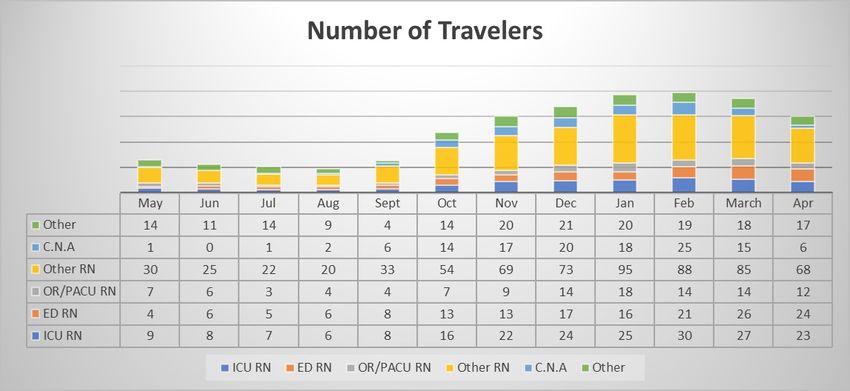
Why are we here?

          “It is good to return to the center from time to time”
                                                  Sr. Cathy O’Connor

 PAGE 2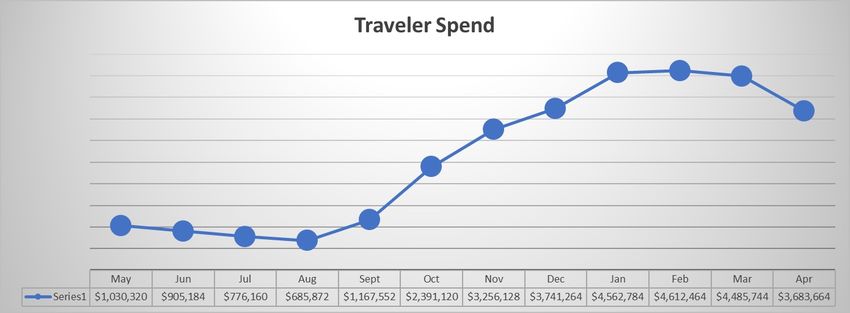
Covenant Health

PAGE 3

Agenda

         Ø   The Journey
         Ø   2021 Accomplishments
         Ø   Financial Results
         Ø   2022 YTD Performance
         Ø   2022 Key Indicators
         Ø   2022 Challenges
         Ø   2022 Outlook
         Ø   2022 Balanced Scorecard
         Ø   Return to Center
         Ø   Three Year Strategic Plan
PAGE 4
Our Journey

          Coronavirus disease 2019 (COVID-19)
          December 2019        1st human case identified in Wuhan, People’s Republic of China
          January 30, 2020     Public Health Emergency of International Concern
          March 11, 2020       Declared a Pandemic

                    COVID Variants                     VOC
                  1. Alpha (UK Variant)              12/18/20
                  2. Beta (South Africa Variant)     12/18/20
                  3. Gamma (Brazil Variant)          01/11/21
                  4. Delta (India Variant)           04/04/21
                  5. Omicron (57 Countries)          11/24/21
                  6. ???

 PAGE 5
Our Journey

 PAGE 6

Our Journey (cont.) - COVID Reflections

          q   Standup of Incident Command Centers
          q   Halting of Elective Procedures (preserve PPE and bed capacity)
          q   Furloughs and Staffing Adjustments
          q   Supply Chain Challenges (gloves, gowns, ventilators)
          q   Advocacy for Cares Act and ARPA Funding
          q   Vaccine Mandates
          q   Workforce Challenges/The Great Resignation
          q   Standup of Community Treatment Facilities
          q   Length of Stay Challenges
          q   Ongoing Financial Losses
          q   Recovery and Mission Advancement!
 PAGE 7
Our Journey (cont.) - COVID Reflections

      Kaiser posts net loss of $961M in Q1

      Ayla Ellison (Twitter) - Monday, May 6, 2022
      Driven mainly by nonoperating losses, Oakland, Calif.-based Kaiser
      Permanente recorded a net loss of $961 million in the first quarter of 2022, down from
      a net income of $2 billion in the same quarter in 2021, according to financial data
      released May 6.
      For the quarter ending March 31, Kaiser reported total operating revenue of $24.2
      billion, up from $23.2 billion the year prior. Tom Meier, corporate treasurer of Kaiser
      Permanente, said the revenue increase was attributed to several factors, including
      growth of its health plan.
      Kaiser also saw its expenses increase significantly in the first quarter of 2022 to $24.3
      billion, up 9.5 percent from the same quarter last year. Mr. Meier said the health
      system incurred about $1.4 billion in costs from COVID-19, including $900 million for
      the cost of care, $550 million for testing and $50 million for vaccinations.
 PAGE 8
Our Journey (cont.) - COVID Reflections
Ascension posts $884M quarterly loss
Ayla Ellison (Twitter) - Monday, May 2nd, 2022
St. Louis-based Ascension reported higher expenses in the three months ended March
31 and ended the quarter with a loss, according to financial documents filed April 29.
The 143-hospital system reported operating revenue of $6.69 billion in the first three
months of this year, up from $6.56 billion in the same period of 2021.
Ascension's operating expenses climbed to $7.34 billion in the first three months of
2022, up from $6.59 billion in the same period a year earlier. The increase was
attributed to several factors, including higher salaries, wages and supply expenses.
Looking at the first nine months of the current fiscal year, Ascension's operating
expenses increased 8.7 percent year over year. Staffing challenges, increased use of
contract labor and overtime spend pushed Ascension's total salaries, wages and
benefits up 10.1 percent year over year in the nine months ended March 31.
PAGE 9Our Journey (cont.) - COVID Reflections
HCA's profit dips to $1.2B as labor costs rise
Ayla Ellison (Twitter) - Friday, April 22nd, 2022
Nashville, Tenn.-based HCA Healthcare saw its profit decline year over year in the first quarter
of 2022.
The 182-hospital system reported revenues of $14.95 billion in the first quarter of this year, up
from $13.98 billion in the same period of 2021. The for-profit hospital operator said same-facility
admissions, emergency room visits and inpatient and outpatient surgeries increased year over
year.
HCA reported higher expenses. Salaries and benefits climbed 10.1 percent year over year to
$6.94 billion. Supplies expenses were $2.32 billion, up 4.4 percent from the same quarter of
2021.
"In the first quarter, we had a number of positive volume and revenue indicators," HCA CEO
Sam Hazen said in an April 22 earnings release. "Unfortunately, they were offset by higher than
expected inflationary pressure on labor costs."
After factoring in expenses and nonoperating items, HCA's net income in the first quarter of
2022 totaled $1.27 billion, down from $1.42 billion in the same quarter a year earlier.
PAGE 102021 Accomplishments
1. Ongoing Pandemic Response
a. Vaccine Mandate Rollouts for Employees
b. Community Vaccine Clinics and Standup of Community COVID Treatment Centers
c. Federal and State Advocacy
2. Refinancing of Debt Portfolio
3. Restructuring of Investment Committee
4. Successful DNV Surveys
5. Selection and Rollout of New Patient Satisfaction Survey Platform (Press Ganey)
6. Welcomed Four New Covenant Board Members in June 2021
1. Kathy Connerton, JD – President/CEO of Ascension Lordes
2. Cathy Lovecchio, PhD, RN – Associate Dean for Undergraduate Nursing, Villanova University
3. Cheri Noe, MD, MPH – Chief of Geriatrics, Mount Auburn Hospital
4. Gino Pazzaglini, MSW, MHA, LFACHE – Retired Healthcare Executive
PAGE 112021 Accomplishments (cont.)
7. RFAP, Selection and Implementation of New Hospitalist Partnership with NES
8. Website Redesign for All Post-acute Care and St. Joseph Nashua
9. No Audit Findings or Recommendations for 2021 (3rd consecutive year)
10. Growth and Transformation Work
1. Bangor Nursing and Rehab Center (January 2022)
2. Day Kimball Health System (4th Qtr 2022)
11. Workforce
1. Conversion to unlimited time off plan for leadership
2. Rollout of System-wide market adjustment strategy
3. System-wide Rollout of “Stay Interviews” for all employees
4. Formation of Covenant Diversity Equity & Inclusion (DEI) Council
5. Formation of Covenant Nurse Executive Council
12. Positive EBIDA $24.6M and Excess of Revenue Over Expense $22.1M
PAGE 12Financial Results (000’s) PAGE 13
Financial Results (000’s)

PAGE 14
2022 Performance
                                               YTD as of March 31, 2022

                                                 Actual    Budget     Var    % Var   Pr Yr    % Var
                              Admissions         10,429     12,489   (2,060) -16.5% 11,619    -10.2%
                                 Surgeries        2,488      2,695     (207)  -7.7%   2,729     -8.8%
                                  ED Visits      16,979     18,356   (1,377)  -7.5% 14,954     13.5%
                               Clinic Visits    127,239   125,995     1,244    1.0% 123,405      3.1%
                        SNF Resident Days        88,324     96,906   (8,582)  -8.9% 79,030     11.8%
                            LTC/ALF Days         37,147     38,311   (1,164)  -3.0% 37,040       0.3%
                                      FTE's       4,256      4,578     (322)  -7.0%   4,398     -3.2%
                             Agency FTE's           309        108      201 186.1%      123   151.2%

                                    (000's)
                             Net Revenue        195,926 201,605   (5,679)   -2.8% 187,991     4.2%
                       Operating Expenses       219,112 207,746 11,366       5.5% 192,505    13.8%
                                     EBIDA      (15,046)  2,204 (17,250) -782.7%    3,370 -546.5%
                     Non-Operating Income       (23,186) (6,142) (17,044) 277.5%    8,327 -378.4%
          Excess of Revenue Over Expenses       (50,006) (2,823) (47,183) 1671.4%   3,813 -1411.5%

PAGE 15
2022 Key Indicators
YTD as of March 31, 2022
Actual Budget Var Pr Yr % Var Comments
Days in Accounts Receivable 45 47 43 lower is better
Days Cash on Hand 179 184 100 higher is better
Debt to Capitalization 37% 32% 37% lower is better
Debt Service Coverage Ratio -3.7 1.4 1.3 higher is better
PAGE 162022 COVID Incremental Expense Estimate Covenant Health, Inc. Additional Costs for COVID 19 - YTD March 31, 2022 Category ($ in 000s) SJN SML SJB PAC Total Contract Labor - Nursing 4,967 6,674 5,440 3,117 20,198 Contract Labor - Other 33 216 649 78 976 Locum Tenens 478 697 315 1,490 COVID Salaries (State of Emergency Dept.) 57 218 213 90 578 COVID Testing Expenses (State of Emergency Dept.) 1 24 258 725 1,008 COVID Supplies / PPE (State of Emergency Dept.) 76 167 209 136 588 COVID Testing (Internal) 365 209 574 COVID Testing (External) 80 101 181 Total 6,057 8,306 7,084 4,146 25,593 PAGE 17
Traveler Totals

PAGE 18
2022 Performance (cont.)

          2022 Challenges
          a.   Weaker than Expected Volumes in Q1 (Omicron variant & care avoidance)
          b.   High Contract Labor/Agency Expenses (exceeds budget by $14.5M YTD)
          c.   Expenses Associated with Continued COVID Testing (supplies and purchased services)
          d.   Long Lengths of Stay for Acute Care (inability to place nursing home patients)
          e.   Repayment of Medicare Advance Payments (impact on cash flow)
          f.   Lack of Govt. COVID Funding (Covenant received $63.1M in 2020 and $24.9M in 2021)
          g.   Inflation
          h.   Volatile Investment Market
          i.   New EPIC/EPIC Conversion (Sept 2022)

PAGE 19
2022 Outlook
ü Focused and disciplined leadership via budget recovery plans
ü Continued return of patient volumes as evidenced by ED and clinic volumes
ü Continued reductions in agency use
ü Patient nursing home placements are improving as evidenced by reductions in length of
stay
ü Post-acute facility census improvements
ü Continued advocacy efforts
ü Addition of Day Kimball Health System (Putnam, CT) in Q4
PAGE 20Pillar of 2022 2022 2022
Measured By Weight Jan Feb Mar Definition
Performance YTD Actual YTD Goal Goal
Components of EE Composite Score will be: 1) Total Unplanned
People Employee Experience Composite Score 5% 25.0% 25.0% 50.0% 33.3% 75% 75% Turnover % 2) Agency Spend 3) OSHA DART Rate 4) Stay
~ We attract, develop & Interview Completion %
retain superior teams
~ Best place to
work/high engagement Percentage of new hires that remain employed following 12
Employee Retention (1st Year) 5% 73.7% 73.5% 74.5% 74.5% 80% 80%
months.
Rate calculated monthly from Quality Dashboards. YTD
performance will be calculated following year end. Includes
Our
Quality Composite Score - Hospitals 15% 55.6% 68.5% 70.8% 64.7% 70% 70% 16 metrics that closely tie to CMS Pay for Performance (P4P)
Mission
Quality & Safety and Value Based Purchasing. Average YTD % to be used and
We are a premier calculated based upon average of monthly results.
We are a provider of care achieving
Catholic health the quadruple aim: Rate calculated monthly from Quality Dashboards. YTD
ministry, ~ Patient experience performance will be calculated following year end. Includes 8
providing ~ Provider engagement Quality Composite Score - IMG 5% 62.5% 62.5% 62.5% 62.5% 70% 70%
~ Population health metrics. Average YTD % to be used and calculated based upon
healing and care
~ Affordable healthcare average of monthly results.
for the whole
person; in 2022 goal set at the readmission threshold (50th %ile score
Pending
service to all in Readmissions - All Payers 3% 9.2% 11.0% 10.0% 9.52% 9.52% from Midas database), 30 day all cause readmissions for all
30 days
our payers.
communities. Operating income before interest, depreciation and
EBIDA (in millions) 40% ($2.8) ($6.9) ($4.4) ($14.0) ($3.3) $25.1
amortization
Performance Rate calculated monthly from ED Scorecards. Includes 9
~ We relentlessly pursue ED Composite Score 3% 25.9% 44.4% 48.1% 39.5% 50% 50% metrics that focus on efficiency and attentive care. Average
operational excellence YTD % calculated based upon average of monthly results.
~ We promote a culture
of fiscal responsibility Rate calculated monthly from Surgical Services Scorecards.
Includes 9 metrics that focus on efficiency and volume growth.
Surgical Services Composite Score 3% 50.0% 60.0% 43.3% 51.1% 50% 50%
Average YTD % calculated based upon average of monthly
results.
Growth in total hospital registrations (inpatient, outpatient and
Total Registrations - Hospitals 5% 37,295 33,441 42,324 113,060 119,307 500,928
Growth & ancillary)
Transformation
Our ~ We offer innovative,
Core Values relevant consumer IMG Primary Care Panel Size 5% 96,450 95,453 96,433 96,433 94,800 96,375 Actual total primary care panel size
experiences
~ We provide seamless
* Compassion integrated care Pending MyChart activation measures % of patients that have activated
MyChart Activation 3% 50.5% 51.3% 51.3% 50% 50%
* Integrity 30 days their MyChart account.
Inpatient satisfaction is measured as the top box responses for
* Collaboration Pending
Inpatient Satisfaction 5% 34th %ile 66th %ile 66th %ile 75th %tile 75th %ile the question of overall rating from Press Ganey surveys.
30 days
HCAHPS Overall Rating score is measures at year end.
* Excellence Mission & Service
on track for on track for on track for on track for Review and completion of addressing ministry goal identified
Completion of MIA Ministry Goals Identified
3% year end year end year end year end 100% 100% from ministry identity assessments performed from 2019
from 2019 through 2021
completion completion completion completion through 2021Return to the Center
I. Mission Focused and Guided By Our Values
II. Volume Recovery
III. Workforce Recovery
IV. Budget Recovery Plans
V. Operating Discipline and Focused Execution
PAGE 22Three-year Strategic Priorities
People: People:
Demonstrated Quality:
Achieve 1st Year Employee Retention Achieve 1 year Employee
st
Rate at or above 80% Exceed national benchmark/average
Retention of 80%
forAchieve
all publicly reported metrics
50th percentile rating or
Achieve 50th percentile rating or
Prioritize
above onour journeyengagement
employee toward a
above on employee engagement
surveys surveys
highly reliable organization
Performance: Growth and Transformation:
Exceed national benchmarks for
Increase access through service patient experience/satisfaction
expansion and provider recruitment
Expand and grow our ministry
Achieve budgeted operating income through strategic acquisitions
PAGE 23Strategic Direction – The Quadruple Aim
•Workforce recruit & •Leveraging technology to drive
retention care improvement
•High engagement & reduced •High-reliability organization
clinician burnout •Sharing of best practices
•Diversity, equity and •Community needs and social
inclusion determinants of health
Improve
•Community Workforce
Better
Development
Clinical
Outcomes
Experience
Improve
Lower
Patient
Costs Experience
•Value based care strategy • Patient centered care
•Capital investments •Clinical affiliations and service-
•Create scale and synergy line growth
•Improve the health of •Improve access to care
populations •Patient engagement
PAGE 24Three Year Strategic Plan – Our Journey to Excellence
I. Meet/exceed balanced scorecard metrics
a) Alignment
b) Communication
c) Focus
II. Consistently meet/exceed EBIDA margin of 6%-8%
III. Maintain balance sheet strength
IV. Double system size within 5 years
PAGE 25PAGE 26
You can also read