COVID-19 in Bolivia: On the path to recovering development - UNDP in Latin America and the Caribbean
←
→
Page content transcription
If your browser does not render page correctly, please read the page content below
UNDP Latin America and the Caribbean
#COVID19 | POLICY DOCUMENTS SERIES

UNDP LAC C19 PDS No. 22
COVID-19 in Bolivia:
On the path to recovering development
UNDP Bolivia Office*

Abstract
Bolivia, just like the other countries of the region, was not excluded from the impact of COVID-19 and the pandemic
appeared in the midst of an economic and political crisis as a result of the failed presidential elections of October,
2019. Despite the fact that timely measures were adopted to face the pandemic at the beginning of the outbreak and
that, in effect, it did slow down the initial increase of the epidemiological curve, later it became impossible to stop the
exponential growth of cases and finally the health care system collapsed exposing its deficient structure. The lockdown
paralyzed activities and many people lost their jobs; livelihoods were partially or totally destroyed which resulted in a
loss of income for many. The economy was faced by a supply shock followed by a demand shock because the level of
household consumption dropped. By imposing dynamic and flexible quarantines the government has now started to
re-open the economy and has provided the financial system with funds for loans needed to boost the domestic demand.
The COVID-19 not only unleashed the crisis but has also opened opportunities and the urgency to get back to work as
soon as possible very often was not made visible or ignored. This concerns a society that needs to recover its rights under
a new equitable, inclusive and just framework of social justice that focuses on making progress and re-channeling
efforts to achieve the Sustainable Development Goals.

* Milenka Figueroa Cárdenas & Carlos Gustavo Machicado. The authors wish to thank Santiago Levy, Marcela Meléndez, Elizabeth Zamora y Mauricio
Medinacelli for their comments.

www.latinamerica.undp.org
UNDP Latin America and the Caribbean
            #COVID19 | POLICY DOCUMENTS SERIES

UNDP LAC C19 PDS N°. 1
A Conceptual Framework for Analyzing the Economic Impact of COVID-19 and its Policy Implications
By Constantino Hevia and Andy Neumeyer

UNDP LAC C19 PDS N°. 2
Suggestions for the emergency
By Santiago Levy

UNDP LAC C19 PDS N°. 3
The economic impact of COVID-19 on Venezuela: the urgency of external financing
By Daniel Barráez and Ana María Chirinos-Leañez

UNDP LAC C19 PDS N°. 4
Social and economic impact of the COVID-19 and policy options in Honduras
By Andrés Ham

UNDP LAC C19 PDS N°. 5
Covid-19 and external shock: Economic impacts and policy options in Peru
By Miguel Jaramillo and Hugo Ñopo
UNDP LAC C19 PDS N°. 6
Social and Economic Impact of COVID-19 and Policy Options in Argentina
By María Laura Alzúa and Paula Gosis
UNDP LAC C19 PDS N°. 7
International financial cooperation in the face of Latin America’s economic crisis
By José Antonio Ocampo

UNDP LAC C19 PDS N°. 8
Covid-19 and social protection of poor and vulnerable groups in Latin America: a conceptual framework.
By Nora Lustig and Mariano Tommasi
UNDP LAC C19 PDS N°. 9
Social and economic impact of the COVID-19 and policy options in Jamaica
By Manuel Mera

UNDP LAC C19 PDS N°. 10
Social and economic impact of COVID-19 and policy options in Uruguay
By Alfonso Capurro, Germán Deagosto, Sebastián Ithurralde and Gabriel Oddone

UNDP LAC C19 PDS N°. 11
Coronavirus in Colombia: vulnerability and policy options
By Andres Alvarez, Diana León, María Medellín, Andres Zambrano and Hernando Zuleta

UNDP LAC C19 PDS N°. 12
COVID-19 and vulnerability: a multidimensional poverty perspective in El Salvador
By Rodrigo Barraza, Rafael Barrientos, Xenia Díaz, Rafael Pleitez and Víctor Tablas.
UNDP country office El Salvador

UNDP LAC C19 PDS Nº. 13
Development challenges in the face of COVID-19 in Mexico. Socio-economic overview
UNDP country office Mexico

www.latinamerica.undp.org | United Nations Development Programme | 2020                                  2
UNDP Latin America and the Caribbean
#COVID19 | POLICY DOCUMENTS SERIES
UNDP LAC C19 PDS Nº. 14 A
Lessons from COVID-19 for a Sustainability Agenda in Latin America and the Caribbean
By Diana Carolina León and Juan Camilo Cárdenas
UNDP LAC C19 PDS Nº. 14 B
Latin America and the Caribbean: Natural Wealth and Environmental Degradation in the XXI Century
By Diana Carolina León and Juan Camilo Cárdenas
UNDP LAC C19 PDS Nº. 15
Social and Economic Impacts of the COVID-19 and Policy Option in the Dominican Republic
By Sócrates Barinas and Mariana Viollaz
UNDP LAC C19 PDS Nº. 16
The Bahamas Country Note: Impact of COVID-19 and policy options
By Manuel Mera
UNDP LAC C19 PDS Nº. 17
Promoting socio-economic recovery in Paraguay Report – Economic Reactivation strategies during
COVID-19
UNDP country office Paraguay
UNDP LAC C19 PDS Nº. 18
The Coronavirus and the challenges for women’s work in Latin America
By Diana Gutiérrez, Guillermina Martin, Hugo Ñopo
UNDP LAC C19 PDS Nº. 19
COVID-19 and primary and secondary education: the impact of the crisis and public policy implications for
Latin America and the Caribbean
By Sandra García Jaramillo
UNDP LAC C19 PDS Nº. 20
Challenges posed by the COVID-19 pandemic in the health of women, children, and adolescents in Latin America
and the Caribbean
By Arachu Castro
UNDP LAC C19 PDS Nº. 21
Planning a Sustainable Post-Pandemic Recovery in Latin America and the Caribbean
By Mauricio Cárdenas and Juan José Guzmán Ayala
UNDP LAC C19 PDS Nº. 22
COVID-19 in Bolivia: On the path to recovering development
UNDP Bolivia Office
www.latinamerica.undp.org | United Nations Development Programme | 2020 3UNDP Latin America and the Caribbean
#COVID19 | POLICY DOCUMENTS SERIES
Disclaimer:
COVID-19 in Bolivia: On the path to recovering development
UNDP partners with people at all levels of society to help build nations that can withstand crisis, and drive and
sustain the kind of growth that improves the quality of life for everyone. On the ground in nearly 170 countries and
territories, we offer a global perspective and local insight to help empower lives and build resilient nations.
Copyright © UNDP 2020
All rights reserved Published in the United States of America | United Nations Development Programme | One
United Nations Plaza, New York, NY 10017, USA
The views, designations, and recommendations that are presented in this report do not necessarily reflect the
official position of UNDP.
www.latinamerica.undp.org | United Nations Development Programme | 2020 4UNDP Latin America and the Caribbean
#COVID19 | POLICY DOCUMENTS SERIES
Introduction to the series:
Evidence, Experience, and Pertinence in Search for Effective Policy
Alternatives
The COVID-19 pandemic is one of the most serious that make some individuals and households particular-
challenges the world has faced in recent times. The total ly vulnerable to an economic freeze of this kind. People
cost in terms of human lives is yet to unfold. Alongside in the informal markets, small and micro entrepreneurs,
the cost of lives and deep health crisis, the world is wit- women in precarious employment conditions, historical-
nessing an economic downfold that will severely impact ly excluded groups, such as indigenous and afro-descen-
the wellbeing of large parts of the population in the years dants, must be at the center of the policy response.
to come. Some of the measures that are currently being
used to counteract the pandemic may impact our future UNDP, as the development agency of the United Na-
lives in non-trivial ways. Understanding the association tions, has a long tradition of accompanying policy-
between different elements of the problem to broaden making in its design, implementation, monitoring and
the policy space, with full awareness of the economic and evaluation. It has a mandate to respond to changing
social effects that they may bring, is the purpose of this circumstances, deploying its assets to support our mem-
series. ber states in their pursuit of integrated solutions to com-
plex problems. This series aims at drawing from UNDPs
Thus far, the impossibility of targeted isolation of in- own experience and knowledge globally and from the
fected individuals and groups has led to policies of so- expertise and capacity of our partner think tanks and
cial distancing that impose a disproportionately high academic institutions in Latin America and the Caribbe-
economic and social cost around the world. The combi- an. It is an attempt to promote a collective reflection on
nation of policies such as social distancing, lockdowns, the response to the COVID-19 health crisis and its eco-
and quarantines, imply a slowdown or even a complete nomic and social effects on our societies. Timeliness is a
stop in production and consumption activities for an un- must. Solutions that rely on evidence, experience, and
certain period of time, crashing markets and potential- reasoned policy intuition –coming from our rich history
ly leading to the closure of businesses, sending millions of policy engagement– are essential to guide this effort.
of workers home. Labor, a key factor of production, has This series also contributes to the integrated approach
been quarantined in most sectors in the economy, bor- established by the UN reform and aspires to become an
ders have been closed and global value chains have been important input into the coherent response of the United
disrupted. Most estimates show a contraction of the level Nations development system at the global, regional, and
of output globally. For the Latin America and Caribbean national levels.
region, the consensus forecasts are at -3 to -4%, and it
is not until 2022 that the region is expected to go back Ben Bernanke, former Governor of the US Federal Re-
to its pre-crisis output levels in scenarios that foresee a serve, reminds us in his book The Courage to Act that
U-shaped crisis pattern. According to ECLAC, more than during crises, people are distinguished by those who
30 million people could fall into poverty in the absence act and those who fear to act. We hope this policy docu-
of active policies to protect or substitute income flows to ments series will contribute to the public debate by pro-
vulnerable groups. viding timely and technically solid proposals to support
the many who are taking decisive actions to protect the
We face a crisis that requires unconventional respons- most vulnerable in our region.
es. We are concerned about the level-effect: the impact
of the crisis on the size of the economies and their capac-
ity to recover growth after the shock. But we are equally
concerned about the distributional impact of the shock. Luis F. Lopez-Calva
The crisis interacts with pre-existing heterogeneity in United Nations Development Programme
asset holdings, income-generation capacity, labor condi- Regional Director, Latin America and the Caribbean
tions, access to public services, and many other aspects New York, March 2020
www.latinamerica.undp.org | United Nations Development Programme | 2020 5UNDP Latin America and the Caribbean
#COVID19 | POLICY DOCUMENTS SERIES
Acronyms
ATT* Authority for the Regulation and Oversight of Telecommunications and Transportation
CBB Central Bank of Bolivia
CPT/IUE Corporate Profit Tax
CTM* Municipal Joint Tax Participation
ECLAC Economic Commission for Latin America and the Caribbean
FTDs Fixed Term Deposits
GNI/INB Gross National Income
HS Household Survey
ICTs Information and Communications Technologies
IDB Inter-American Development Bank
IMF International Monetary Fund
MDPyEP* Ministry of Productive Development and Plural Economy
MEyFP* Ministry of Economy and Public Finance
MPD* Ministry of Development Planning
MRI/IRM Municipal Risk Index
MTEPS* Ministry of Labour, Employment and Social Security
NIE National Institute of Statistics
NIR Net International Reserves
PFA Pension Fund Administrators
PLA Plurinational Legislative Assembly
RES Rolling Employment Survey
RFI/IFR Rapid Financial Instrument
RUDE* Unified Students Registry
SBMCTI* Bolivian Society of Critical Medicine and Intensive Therapy
SNMN* National Maternity and Child Insurance
SSV* Health Insurance for the Elderly
SUS* Unified Health Insurance
TGN* General Treasury of the Nation
TPR* Real Exchange Rate
UDAPE* Analysis Unit for Social and Economic Policies
UNDP United Nations Development Program
WAP Working Age Population
WHO World Health Organization
* These acronyms remain in Spanish.
www.latinamerica.undp.org | United Nations Development Programme | 2020 6UNDP Latin America and the Caribbean
#COVID19 | POLICY DOCUMENTS SERIES
1. Introduction
Bolivia, a landlocked country in South America, with a population of 11.5 million of inhabitants, had a favorable
macro-economic context for nearly a decade reaching growth levels of up to 5% of the GDP. Nonetheless, it was
unable to avoid the spread of the COVID-19 pandemic.
The pandemic reached Bolivia on March 10, when the country was socially and politically fragile resulting from a
crisis triggered by the failed 2019 General Elections and the subsequent transitional government model. Similarly,
the macroeconomic context was already fragile as a result of a slowdown in economic growth since 2015, which
tested the sustainability of social progress achieved in the previous decade in its attempt to further reduce poverty
and consolidate the recent widening of the middle tier.
The sudden appearance of COVID-19 and its exponential growth not only weakened the economy of the country
further, but also brought to the forefront the severe weakness of the health care system. Although measures were
immediately taken to cope with the pandemic and this helped to slow down the epidemiological growth curve,
the spread of the infection and, the collapse of the health care system, revealed underlying structural problems.
This report is based on a previous analysis of the United Nations Development Program (UNDP) (Levy, 2020; Hevia
and Neumeyer, 2020) and aims at studying the current situation of the COVID-19 crisis in Bolivia, its transmission
mechanisms, as well as certain of its socio economic impacts and furthermore provides food for thought to pave
the way towards a collective and inclusive recovery with a focus on multidimensional wellbeing.
The document is divided into five sections which begins with the introduction followed by the second section
that describes the macro-economic situation of the country just before the pandemic struck; the third section
describes the socio economic situation before COVID-19; while the fourth section studies the impact of the
mitigation measures adopted by the government to curb the economic crisis. Finally, the fifth section provides
certain recommendations and conclusions that contribute to the discussion on how the country will recover and
the country will continue its path towards a sustainable and integrated development.
www.latinamerica.undp.org | United Nations Development Programme | 2020 7UNDP Latin America and the Caribbean
#COVID19 | POLICY DOCUMENTS SERIES
2. Macro-economic situation prior to the COVID-19 pandemic in Bolivia
2.1 The real sector
At the beginning of this year the country was bound in a state of inertia since it had enjoyed an economic
boom (2004–2013) based on high prices of raw material exports, particularly natural gas, in addition to a dynamic
domestic demand spurred by public investment.
Chart 1. GDP growth rate and outlook
8,0 6,8
6,2
5,2 5,5
6,0
4,8 5,1 4,9
4,4 4,6 4,3 4,2
4,1 4,2
3,5
4,0
2,2 2,2
3,4
2,0
0,6
0,0
-2,0
-4,0
-5,2 CEPAL
-6,0
-5,6 -5,6 FMI
-5,9 BM
-8,0 -7,63
-10,0
Source: In-house preparation based on NIS data in Bolivia.
By 2019 the economic cycle that began in 2004 was reaching its end and the GDP growth rate had dropped to
2.2%, which was the same level as in 2000, the year of the financial crisis. The mining and hydrocarbon sectors were
the most affected and registered the biggest contraction due to a fall in the natural gas export volumes to Brazil
and Argentina, the main export markets. No less important was the fact the public investment fell and it had been
a stalwart for domestic demand during the boom.
Aside from the economic slowdown, the last quarter of 2019 marks the beginning of a political crisis sparked by
the annulment of the General Elections which led the incumbent president, Evo Morales, to resign and ushered
into office a transitional government in charge of summoning new elections originally planned to take place in
May. However, once the pandemic arrived the election had to be postponed until September 2020, but, due to a
high rate of infection, the elections once again had to be postponed until October 18. The enactment of a Law by
the Plurinational Legislative Assembly (PLA) ratified this date, following social turmoil in August when the elections
were postponed again.
2.2 The fiscal sector
The pandemic hit Bolivia under a very bad fiscal position. The fiscal deficit had been growing since 2014 and had
reached the level of 8.1% of the GDP in 2018. Percentages more than 8% had only been recorded during periods of
crisis, 8.8% (2002) and 8.1% (1985).
www.latinamerica.undp.org | United Nations Development Programme | 2020 8UNDP Latin America and the Caribbean
#COVID19 | POLICY DOCUMENTS SERIES
In 2019, the deficit of the Non-Financial Public Sector (NFPS) dwindled to 7.2% of the GDP because public
companies received fewer investments. In addition, the general government deficit increased from 6% to 6.9%
mainly because it received less current income due to lower hydrocarbon sales. Chart 2 shows the relationship
between the SPNF deficit and the international price of oil, taking as a reference the price of natural gas (the
main export commodity). The ratio is 0.67 which confirms that the fiscal balance is directly linked to international
hydrocarbon prices.
Chart 2. SPNF Surplus and the international price of oil.
6 120
4,5
4 3,2
100
1,7 1,7 1,8
2
0,8 0,6
0,1 80
0
US$ per barrel
GDP %
-2 60
-2,3
-4 -3,4
-3,7
40
-6 -5,5
-6,8 -6,9 20
-7,2 -7,2
-8
-7,9 -7,8
-8,1
-8,8
-10 0
2000 2002 2004 2006 2008 2010 2012 2014 2016 2018
Global Sup. (Def.) Price ($us./barrel)
Source: Ministry of Economy and Public Finance
The SPNF deficit was mainly sourced by internal credit basically for public entities and, more recently, the central
government. In any case, Bolivia still has the possibility of seeking external funds because the external debt in
proportion to the GDP barely reaches 28%, which is less than 40% that marks the limit of sustainability. However,
there is concern regarding more internal funding since it is already close to 30% of the GDP.
In the first quarter of 2020 the GDP registered a deficit of 0.3% which makes the fiscal deterioration before the
pandemic became evident since in former years the first quarter steadily recorded surplus amounts. This deficit
has its roots in central government expenditures since public entities registered a surplus. Thus, while the general
government financed 86% of its deficit through internal credit, public entities paid for their internal credit. In any
case, the government’s public finance is under a double stress, a greater pressure on expenditures and a lower fiscal
income.
2.3 The monetary sector
Despite the fact that Bolivia’s monetary policy benefitted from the “Bolivianization”,1 allowing the Central Bank
of Bolivia (CBB) to exercise a greater influence on the monetary market, the foreign exchange policy in place since
2011 somehow restricted the intervention of the CBB in the monetary market by selling dollars to maintain the
level of the foreign exchange rate. In fact, the monetary policy is still a policy based on monetary aggregates and
is adjusted according to foreign exchange monetary market fluctuations.
1 99% of the loans and 86% of the deposits are in dollars
www.latinamerica.undp.org | United Nations Development Programme | 2020 9UNDP Latin America and the Caribbean
#COVID19 | POLICY DOCUMENTS SERIES
Bolivia started to accumulate Net International Reserves (NIR) as of 2005, as a result of the trade surplus since 2004
and the condonement of the foreign debt in 20052. Since it practically had no external liabilities, it accumulated all
the foreign exchange from the current account surplus. This accumulation reached its peak in 2012, when it had
52% of reserves as compared to the GDP. After this year and from thereon the reserves were de-accumulated since
there were more external liabilities and, as of 2014, the current account registered a deficit.
Chart 3 depicts the relationship between inflation and the type of variation of the nominal exchange rate. It
shows that once a fixed nominal exchange rate is adopted (November, 2011), the inflation trend starts to drop
to a level lower than 5% that explains the importance of the nominal exchange rate and how it curbes inflation.
After the supply shock due to the quarantine, in April the rate of inflation up to 12 months rose slightly to 1.72%,
however during May and as a result of the demand shock, inflation fell to 1.23%.
Chart 3. Inflation and nominal exchange rate (variation rate up to 12 months)
20
15
Inflation
10
5
Percentage
0
-5
-10
Nominal Exchange Rate Variation
-15
2003,1
2008,1
2013,1
2018,1
2000,01
2000,06
2000,11
2001,04
2001,09
2002,02
2002,07
2002,12
2003,05
2004,03
2004,08
2005,01
2005,06
2005,11
2006,04
2006,09
2007,02
2007,07
2007,12
2008,05
2009,03
2009,08
2010,01
2010,06
2010,11
2011,04
2011,09
2012,02
2012,07
2012,12
2013,05
2014,03
2014,08
2015,01
2015,06
2015,11
2016,04
2016,09
2017,02
2017,07
2017,12
2018,05
2019,03
2019,08
2020,01
2020,06
Source: In house preparation based on CBB and NIS data
When a fixed nominal exchange rate was adopted this triggered an over-evaluation of the real exchange rate (RER)
reflecting how many national goods are required to purchase a foreign good making exports more “expensive” and
imports cheaper. Chart 4 shows how the multilateral and bilateral index with the United States RER has evolved and
when the over-evaluation began in 2006 and, as can be seen, with the exception of a real depreciation between
February and October 2009, the RER has been constantly appreciated.
2 Multilateral Debt Relief Initiative (MDRI).
www.latinamerica.undp.org | United Nations Development Programme | 2020 10UNDP Latin America and the Caribbean
#COVID19 | POLICY DOCUMENTS SERIES
Chart 4. Real Exchange Rate Index
120
110
Multilateral
Índex (August 2003 = 100)
100
90
80
70
60
US Bilateral
50
40
2000,01
2000,07
2001,01
2001,07
2002,01
2002,07
2003,01
2003,07
2004,01
2004,07
2005,01
2005,07
2006,01
2006,07
2007,01
2007,07
2008,01
2008,07
2009,01
2009,07
2010,01
2010,07
2011,01
2011,07
2012,01
2012,07
2013,01
2013,07
2014,01
2014,07
2015,01
2015,07
2016,01
2016,07
2017,01
2017,07
2018,01
2018,07
2019,01
2019,07
2020,01
Source: BCB
2.4 The external sector
Between 2004 and 2014 the country had a trade surplus due to an increase of traditional exports, mainly
hydrocarbons, and specifically, natural gas, as can be seen on Chart 5. In 2003 hydrocarbon exports accounted for
6.3% of the GDP. In 2013 these exports represented 22% of the GDP. Since then, they started to shrink until reaching
7% of the GDP in 2019.
According to Jemio (2019) the economy of Bolivia was experiencing a phenomenon called “the Dutch disease”
since there was a higher average of extractive export activities and non-tradable activities of the GDP and a lower
average as concerns non-extractive tradable products.
Chart 5. Exports and Imports (% of the GDP)
50
45
Exports
40
35
30
GDP %
25
Imports
20
15
10
5
0
2000 2002 2004 2006 2008 2010 2012 2014 2016 2018
Source: NIS
Similarly, the economy of Bolivia has become increasingly dependent on imports. As compared to the GDP,
imports have increased from 21% in 2003 to 32.6% in 2014. Afterwards they have steadily dropped until reaching
24.1% in 2019. The fact is that there were more imports due to a higher income from exports and this appreciated
the RER, making foreign goods cheaper in terms of national goods.
www.latinamerica.undp.org | United Nations Development Programme | 2020 11UNDP Latin America and the Caribbean
#COVID19 | POLICY DOCUMENTS SERIES
During the boom period (2004–2013) there were many more imports of industrial supplies and capital goods. The
latter increased mainly because of the higher levels of public investment, which has a high imported component.
This explains why, since 2015, imports declined because the level of public investment diminished and, as a result,
public entities made fewer and lower imports. This also explains the important share of the deficit in services in the
current account of the balance of payments. These services are mainly related to public investment.
In 2020, in the period between January and April, the total exports of goods fell by 13.9% as compared to the
same period in 2019. Imports also fell by 29.5%. This explains how in the first months of the year, the trade balance
had a surplus, in fact, it increased up to US$198 million, by the third quarter of 2020. This surplus explains the
increase of gross international reserves in April.
3. Socio economic context prior to the COVID-19 pandemic
3.1. Poverty and vulnerability
In 2019, 70% of Bolivia’s population lived in urban areas, 26% declared to belong to a native indigenous people
and most of them were young and in a stage of a constrictive demographic transition. In 2019 life expectancy at
birth was estimated at 73.47 years and in that same year the Gross National Income (GNI) per capita was US$ 3,552.
ranking Bolivia as a low medium income country, one of the poorest in the region.
In the midst of the most fragile macro-economic context in the country, the social progress achieved in the last
decade has been put to the test, especially as concerns poverty reduction and the strengthening of the middle
class which are the first hit in an economic slowdown, particularly in urban areas, due to a contraction of the
domestic demand.
Chart 6. Income strata according to residence area
571,601
High -0,6%
4,4% = 5.0%
2,504,109
Stable Middle Class -5,4% 16,3% = 21.7%
4,159,238
Vulnerable Middle Class -8,9% 27,3% = 36.1%
4,277,957
Low -15,3% 21,8% = 37.2%
-20,0% -10,0% 0,0% 10,0% 20,0% 30,0%
Urbana Rural
Source: In-house preparation based on a 2019 Household Survey. NIS, Bolivia.
During the economic boom in the period between 2004 and 2013 the population was able to afford much better
living conditions and this helped to lift more than 21pp. of the population out of poverty. These people were
able to fit into the medium vulnerable and medium stable income segments. However, according to the 2019
Household Survey (HS) the lower segment still comprises the largest part of the population (37.2%) followed by the
vulnerable middle class segment (36.1%). Both segments represent a total of 8,432,747 inhabitants.
www.latinamerica.undp.org | United Nations Development Programme | 2020 12UNDP Latin America and the Caribbean
#COVID19 | POLICY DOCUMENTS SERIES
Moreover, Chart 6 indicates that out of 30% of the population that live in rural areas are poor (15.3%) while in
urban areas the population is mostly made up of vulnerable middle class. Despite the fact that the pandemic
mostly focuses on cities, the data shown herein makes the vulnerability of the rural poor stand out.
Up to 2019, political measures, such as, direct transfers and the backing of public investment with a focus on
infrastructure, benefitted the poor and middle class segments of the population. However, the political crisis and
the intrusion of the COVID-19 pandemic has affected the performance of the economy and could undo the former
social achievements.
Between 2014 and 2015, despite the economic slowdown, monetary poverty continued to shrink due to the
stalemate of the economic activity, particularly the service sector and the fiscal impulse that sustained occupation
and remunerations at high levels.
In 2019 an estimated 4.3 million people were moderately poor (37.2%) while 1,5 million were extremely poor
(12.9%). In addition, the Gini Index concerning the per capita income per family in that same year reveals a
severe disparity in the income distribution (Chart 7) to such a degree that the wealthiest decile of the population
concentrated 22 times more income that the poorest segment.
Chart 7. Monetary poverty in Bolivia3
50,0 0,45
43,0 42,2
45,0 39,9 0,40
40,0 37,2
0,35
35,0
0,30
30,0
0,427
0,25
25,0
19,0 18,4 0,20
20,0 15,3
12,9 0,15
15,0
10,0 0,10
5,0 0,05
0,0 0,00
2016 2017 2018 2019 (p)
GINI Index Moderate Poverty Extreme Poverty
Source: In-house preparation based on the 2016 - 2019 Household Survey. NIS, Bolivia.
*The GINI Index for the period 201-2018 could not be calculated since the data available, that is, the complete household survey adjusted to the new poverty
lines is for the year 2019.
According to World Bank estimates, despite having reduced poverty, as compared to neighbouring countries,
Bolivia continues to be one of the poorest countries in South America.
3The series only considers the 2016-2019 period since it contains the new construction of poverty lines based on the 2015-2016 Family
Budget Survey. Therefore, poverty measurements registered in former household surveys are no longer comparable.
www.latinamerica.undp.org | United Nations Development Programme | 2020 13UNDP Latin America and the Caribbean
#COVID19 | POLICY DOCUMENTS SERIES
Chart 8. 2019 Monetary policy in South America (%)
30,0
27,8
25,0
24,2
23,1
22,1
20,0
19,9
17,0
15,0
10,9
10,6
9,7
9,2
10,0
8,3
9,6
5,9
4,5
4,4
4,1
5,0
3,3
3,0
2,6
1,6
1,0
0,7
0,4
0,3
3,7
0,1
2,9
0,0
Brazil Peru Ecuador Argentina Chile Paraguay Uruguay Columbia Bolivia
Extreme Poverty (1.90 USD PPP 2011) Moderate Poverty 1 (3.20 USD. PPP 2011) Moderate Poverty 2 (5.50 USD. PPP 2011)
Source: In-house preparation based on World Bank, 2018.
Bearing in mind the line of indigence or extreme poverty of US$1.90 per day, which for many countries does not
cover the cost of the basic food basket, Bolivia has an incidence of poverty of 4.5%.
There are considerable challenges to avoid returning to former levels of the reduction of monetary poverty in
Bolivia which, with the presence of the pandemic, underscores the urgent need to design a complex set of social
protection policies.
3.2 The labour world
Despite the growth levels of the Bolivian economy over the past decade, which considerably improved the
workers’ income, the productive structure of the country did not change nor did the generation of employment
and quality jobs improvement (Pereira, et al., 2018). This is related to the development model, which from a historic
perspective has consistently been based on labour-intensive natural resource exploitation and exports coupled by
extremely low investment rates. This rates are due to a lack of domestic savings, which restricted the funding to drive
productive investments to aid diversification throughout the country with a focus on efficiency and productivity.
According to the 2019 HS the potential supply of labour from urban areas represented an estimated 51% of the
total population with a slightly higher proportion of women than men. The economic share represents 64.6% of
the working age population (WAP) and a considerable gap of 19.1% in detriment of women is evident; with a 6%
unemployment rate, the economic dependency is more than two people per each person with a job, more in the
case of women than men.
There has been no change of the productive economic matrix and a large part of the population still has precarious
jobs in addition to a low level of productivity and quality in the informal sector, which in 2019, increased to 76.2%
at a national level and to 67.2% solely in urban areas.
www.latinamerica.undp.org | United Nations Development Programme | 2020 14UNDP Latin America and the Caribbean
#COVID19 | POLICY DOCUMENTS SERIES
Chart 9. Occupation in the formal and informal sectors according to socioeconomic strata
a) National b) Urban
Formal: 23.8% Informal: 76.2% Formal: 32.8% Informal: 67.2%
-1,7
-2,4
High 1,91,1 High -2,4 -3,2 2,5 1,5
-4,1
-4,9
Stable Middle Class 9,9 7,7 Stable Middle Class -5,7 -6,4 9,7 7,7
-3,2
-4,6
Vulnerable Middle Class 14,8 12,4 Vulnerable Middle Class -4,8 -6,3 14,9 12,3
3,05 million 1,62 millones
-1,3
-1,6
Low 15,6 12,8 Low -1,7-2,3 10,7 8,0
-15,0 -10,0 -5,0 0,0 5,0 10,0 15,0 20,0 25,0 30,0 -15,0 -10,0 -5,0 0,0 5,0 10,0 15,0 20,0 25,0 30,0
Men Women Men Women Men Women Men Women
Source: In-house preparation based on 2019 HS. NIS, Bolivia.
* The indicators have taken into consideration 14 years old as the working age.
Despite a remarkable economic growth, labour concentrates its largest share particularly in the low and
vulnerable middleclass population segments as seen on Chart 9 which represents more than three million people.
Moreover, this market absorbs nearly eight out of each ten men and a similar proportion of women between 24
and 54 yrs. old who have rudimentary tertiary education.
The sectors with the highest percentage of informal workers in urban areas are, in order of size, trade (31.4%),
manufacturing industry (14.0%), hospitality and food services (12.6%), transportation and storage (11.7%) and,
construction (10.8%) all of which have been hard hit by the economic crisis generated by the pandemic.
Chart 10. Main informal workers’ activities in urban area (%)
50,0
45,0
44,5
40,0
35,0
30,0
31,4
25,0
22,7
20,0
21,1
20,3
18,8
15,0
14,1
14,0
14,0
12,6
10,0
11,7
10,8
5,0
6,5
5,4
4,8
3,9
0,5
0,7
1,1
1,2
1,1
0,8
2,3
1,5
3,7
4,2
3,9
0,0
Agri & Livestock Man. Industry Construction Trade Trans & Storage Housing & Food Management & Health & Welfare Other Personal
Services support services Services Ss. Activities
Hombre Mujer Total
Source: In-house preparation based on the 2019 HS. NIS, Bolivia.
www.latinamerica.undp.org | United Nations Development Programme | 2020 15UNDP Latin America and the Caribbean
#COVID19 | POLICY DOCUMENTS SERIES
These outcomes match the data reported by the Ministry of Productive Development and Plural Economy
(MDPyEP) and micro-businesses comprise 90% of the total economic units mostly active in the wholesale and retail
market, the manufacturing and foodstuffs industries.
Depending upon the activity, there is also a higher share of women than men, for instance, in trade, since more
than 44.5% are unemployed women as compared to 21.1% men, and in smaller numbers, the same happens in the
hospitality and food services sectors.
Bolivia is now in a stage of constrictive demographic transition and has a demographic dependency of six per ten
person in productive age and consequently there is a margin that can be used positively from this demographic
bonus.
However, the narrow spectrum of labour demand for the formal economic sector hampers dynamic links to
labour supply that, in the best of cases, do not have the necessary skills or training. In addition, together with the
extractive development model that is low labour intensive, the demographic bonus and window of opportunity
are not being properly used, and the matter is even worse since the pandemic is rampant and there will be very few
opportunities for jobs in the formal and informal sectors.
Self-employed people in the informal market, particularly in the field of trade, work in precarious conditions with
no short or long term social security benefits. Social security is linked to formal jobs which are also few despite the
fact that application as a social security beneficiary is voluntary and is not only valid for formal workers. Barely one
out of each two people have a job in the formal sector and less than one out of eight people in the informal sector
are social security beneficiaries (Chart 11).
Chart 11. People registered in a pension fund
Are not
Informal
affiliated
77.1%
7.2
Formal
Are 22.9%
affiliated
15.7
Are
affiliated
4.1 Are not
affiliated
73
Source: In-house preparation based on the 2019 HS. NIS, Bolivia.
In summary, the labour market structure in Bolivia is extremely fragile and cannot manage the shocks, not only
as concerns the domestic demand shocks, but also the supply shocks generated by the COVID-19 mitigation and
response measures.
www.latinamerica.undp.org | United Nations Development Programme | 2020 16UNDP Latin America and the Caribbean
#COVID19 | POLICY DOCUMENTS SERIES
3.3 The To Do List concerning Education
Although the coverage of and permanence in the educational system has improved over the last decade, the
sector still has a list of pending issues such as the coverage gaps per place of residence, gender and particularly,
quality education measurements.
According to the 2019 HS, the net enrollment of primary and secondary education in Bolivia is 90.4%, but, as seen
on Chart 12, the situation by place of residence reveals a 5.7pp. gap in detriment of the rural area as compared
to urban areas. However, attendance is more important than enrollment, and, out of the total number of children
enrolled in school of age for the grade in an urban area 72.4% attend school while school attendance in rural areas
is much lower at 56.1% and this greatly widens the gap.
Chart 12. Net enrollment and attendance in primary and secondary schools according to residence area
100%
7,7
13,4
90%
80% 19,8
70% 30,5
60%
50% Enrolled =
40% 92.3 % Enrolled =
72,4
30% 86.6 %
56,1
20%
10%
0%
Urban Rural
Attend Do not attend Are not enrolled
Source: In house preparation based on the 2019 HS. NIS, Bolivia.
Since 2006 Bolivia implemented the Juancito Pinto Bonus as a social protection policy to broaden the coverage
of school age boys and girls and encourage them to go to class and continue their studies. However, Hernani (2013)
concludes that depending upon an ex ante and a counter-factual evaluation method the bonus has only motivated
the growth of enrollments but has been unable to encourage school age girls and boys to remain in school, and
this situation has not changed according to the above chart.
With the exception of higher levels of education it is evident that gender gaps exist amongst schoolchildren of
educational establishments from pre-school, primary to secondary levels. Although the gaps are decreasing in
national averages, it is evident that there are still differences in the opportunities that women have to acquire skills
related to educational training, particularly at the secondary education level in rural areas, where the gap between
men and women even reaches 8.5 pp, this possibly attributed to the domestic and care work that women must
assume.
Moreover, the information and communications technology (ICTs) for internet services in households is still scarce
in the country and only two out of ten households have internet services. One of the main impacts of COVID-19
will undoubtedly be the educational gap to have access to and use ICTs. In fact, only 24.8% of the households with
children enrolled in a public school have access to ICTs as compared to 42% of the households with children enrolled
in a private school who are connected. However, this does not mean that having access to the internet through a
mobile device, such as an intelligent cellular telephone, has registered a much larger growth as compared to fixed
www.latinamerica.undp.org | United Nations Development Programme | 2020 17UNDP Latin America and the Caribbean
#COVID19 | POLICY DOCUMENTS SERIES
and wireless connections as revealed by the 2019 Study of the Regulation and Oversight Telecommunications and
Transportation Authority (ATT 2019) that reported that in 2018, 94.3% mobile telephones used access technology.
3.4 The universalization of a precarious health care system
The health care system was established in the decade of the nineties with the National Maternity and Infant
Insurance (SNMN) and Old Age Health Care Insurance (SSV) in 1996; the purpose of the former that has 32 benefits
was to reduce maternal and neonatal mortality and the second was designed for senior citizens. Both insurances
had been added more benefits until the beginning of 2019 under the current Unified Health Insurance (SUS
according to the Spanish acronym) which is free and universal and provides an estimated 1,200 medical services;
while the Old Age Health Insurance substituted the SSV in 2006 and provided health care services at all levels of
medical attention of the health care system.
The National Treasury of the Nation (NTN) financed and will continue to finance 90% of these insurance schemes
as regards to the human resources component and will fund 10% through the Municipal Joint Tax (CTM according
to its Spanish acronym) from the national tax collection earmarked for infrastructure within its sphere of jurisdiction
and according to its level of government.
Unfortunately, changes in the public health care system were not matched by an adequate planning nor the
infrastructure or human resources required, nor did it receive substantial funding from the different levels of
government, nor did these levels coordinate amongst each other or with the health system. Consequently, this
universal health care insurance is actually limited, oversaturated and plagued with flaws and furthermore receives
funds in fragmented remittances.
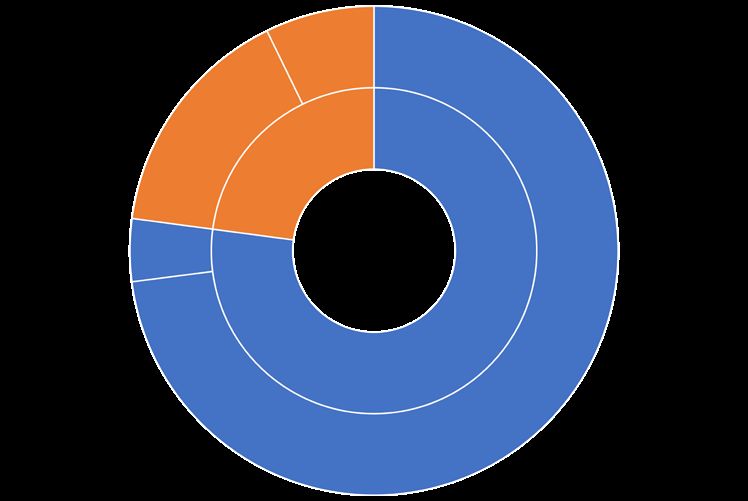
Despite the universal coverage of the public health care system and the fact that it is free of charge, according to
the 2019 HS only 44% of the population had been enrolled in the SUS, 19.3% was registered in the short term social
security, 1% in private security schemes, while an estimated 34% has no health care insurance.
Chart 13. Population enrolled in a health care insurance
3.9 million
people
Income
Strata
Source: In-house preparation based on the 2019 HS. INE, Bolivia.
www.latinamerica.undp.org | United Nations Development Programme | 2020 18UNDP Latin America and the Caribbean
#COVID19 | POLICY DOCUMENTS SERIES
As shown in Chart 13, 75% of the population with no insurance coverage belong to the low and vulnerable middle
class segments partially due to socially determining factors, such as, the place of residence, family income, adoption
of healthy habits and, culture, to mention a few, but also a mistrust due to the poor quality of health care services.
Regarding health expenditures, latest data from the World Bank reveals that in 2017, Bolivia had a public
expenditure of 4.4% of the GDP which is less than the Latin American average (4.8%) and although it is higher than
countries such as Brazil and Peru, it is still far from the recommended 6% declared by the World Health Organization
(WHO). Moreover, due to the relatively small size of the Bolivian economy, in per capita terms, the estimated US$332
per year as expense in health is one of the lowest in the region, well below the amount Brazil invests (US$600 per
inhabitant). Therefore, although there have been increases in health care expenses, these have been too little and
have not keep pace with the demographic growth of the past decades, as shown in Chart 14.
Chart 14. Public health per capita expenditure
6,00 332 350
310 305
301
288
300
5,52
5,00
258
Expenditure per capita in $us.
4,96
233 250
4,00
4,40
4,30
197
Percentages
179
3,84
200
3,42
3,41
3,00
3,35
3,23
3,21
3,17
3,13
155 150
2,00 140
120 100
1,00
50
0,00 0
2005 2006 2007 2008 2010 2011 2012 2013 2014 2015 2016 2017
Title of the axis
Health expenditure as GDP % Per capita health expenditure
Source: In-house preparation based on UDAPE 2018 data, Bolivia.
Great strides have been made in the area of mother child health which registered a higher coverage of institutional
child births, however the figure has remained at 84% since 2012 despite the implementation of the Juana Azurduy
Bonus.
According to regional data, in 2017 the doctor/inhabitant ratio in Bolivia was 14 per 10.000 inhabitants.
Neighbouring countries more than doubled that ratio, Chile (36), Argentina (37), Paraguay (34) and Brazil (31)
which comply with the required minimum level as declared by the WHO, to mention a few countries. In Bolivia
there is one doctor for each 714 people when the minimum WHO recommendation specifies that there should be
at least one doctor for each 333 people.
Although there is no standard number of hospital beds per inhabitant the ratio in Bolivia (1.1 beds per 1,000
inhabitants) lags considerably behind its neighbouring countries such as Argentina (5), Peru (1.6), Chile and Brazil
(2.2) and this places the country as second to last in South America.
As concerns high resolution infrastructure, Bolivia has a total of 33 third level hospitals of which, based on data
from the Bolivian Society of Critical Medicine and Intensive Therapy (SBMCTI) only 24 have intensive care units.
www.latinamerica.undp.org | United Nations Development Programme | 2020 19UNDP Latin America and the Caribbean
#COVID19 | POLICY DOCUMENTS SERIES
Altogether the number of beds in these hospitals used for these purposes add up to 220, the estimated average
bed occupation is 90%, and the 10% in the balance is not functioning. If the WHO recommendation was taken into
account, i.e., one bed for intensive care per each 10,000 inhabitants, the public health system could hardly cover
20%.
It is in this extremely precarious situation that COVID-19 struck and due to the universalization of the health
care, health care system services had already collapsed. Demand was rampant and overwhelmed the supply, the
infrastructure was precarious and had not been renovated since the decade of the 80s and there was a shortage of
human resources.
3.5 Housing conditions
Although the possession of a home and adequate housing is a fundamental right this is an issue which together
with basic water and sanitation services continues to be missing in Bolivia, particularly in rural areas where the
coverage has hardly improved for decades. In the last few decades, the governments implemented several housing
programs as a solution to the lack of housing for a large portion of the population. However the living conditions
of the people did not improve much at all and even worsened, the qualitative deficit of housing, understood as the
possession of housing with structural flaws or flaws in utilities affected 963,327 households per year in 2011, that
is, 36.1% (2,669794 households) of the total numer of households, the shortage grew to 1,515,172 households in
2018, that is, 43.8% (3,459,453 households) of the total (UDAPE, 2018).
A look in detail, for example, into the quality of the construction material used to build the walls and ceilings
leads to the conclusion that in the country two out of ten households have built their homes with inadequate
construction material, and this figure is doubled in low income segments of the population.
Chart 15. Construction material Chart 16. Overcrowding
Construction Material Overcrowdedness
Bolivia 82,9 17,1 Bolivia 62,1 37,9
Hgh 97,3 2,7 High 83,1 16,9
Income segment
Income segment
Stable Middle Class 88,5 11,5 Stable Middle Class 74,5 25,5
Vulnerable Middle Class 83,5 16,5 Vulnerable Middle Class 60,0 40,0
Low 73,2 26,8 Low 45,9 54,1
0,0 20,0 40,0 60,0 80,0 100,0 120,0 0,0 20,0 40,0 60,0 80,0 100,0 120,0
Adequate Inadequate Without With
Source: In-house preparation based on 2019 HS. INE, Bolivia.
Similarly, an estimated 40% of the households in Bolivia are overcrowded and have more than three people per
bedroom. It is worse for the lower income segment of the population that register more than 50% living in these
conditions.
www.latinamerica.undp.org | United Nations Development Programme | 2020 20UNDP Latin America and the Caribbean
#COVID19 | POLICY DOCUMENTS SERIES
The qualitative deficit of housing which is made particularly evident in the over crowdedness is not only a
breeding ground for sickness and disease but also aggressiveness, violence and even mental disturbances and the
development of a person’s personality, but also reveals the qualitative deficit of decent living quarters.
As concerns utilities, such as improved water and sanitation services, the situation is grim, especially as concerns
the latter which has serious deficiencies. (See Chart 18).
Chart17. Improved water Chart 18. Improved sanitation
Improved Water Improved sanitation
Bolivia 82,8 17,2 Bolivia 52,9 47,1
High 90,2 9,8 High 70,7 29,3
Income segment
Income segment
Stable Middle Class 87,6 12,4 Stable Middle Class 63,2 36,8
Vulnerable Middle Class 84,0 16,0 Vulnerable Middle Class 51,2 48,8
Low 74,4 25,6 Low 39,2 60,8
0,0 20,0 40,0 60,0 80,0 100,0 120,0 0,0 20,0 40,0 60,0 80,0 100,0 120,0
without with without with
Source: In-house preparation based on 2019 HS. INE, Bolivia.
Despite the implementation of a series of government policies to improve the sanitation of housing and
investment programs, there have been little progress, not only in rural areas but in urban areas as well. Sanitation
has now become one of the main problems and should attract the attention of the government to formulate a
public policy. (Escalera and Córdova, 2016).
Although the housing and living conditions are, persistent and structural problems, the COVID-19 pandemic
has unveiled the urgent need to address them, since they not only involve deficiencies in rural areas but also
deprivations and a lack of rights in urban areas where over crowdedness also uncovers the true shortage of living
quarters and its effects, such a surge in intrafamily violence.
In summary, the socio economic context prior to the COVID-19 pandemic in Bolivia reveals that, although
the country reduced poverty in the past decades and fostered a growth of the middle class, it focused on the
vulnerable middle class more than the stable middle class since the exposure to risks and economic shocks could
easily provoke a new fall of the population Into a lower income segment.
4. Impact of the measures adopted by the government
The sickness caused by SARS-CoV-2 declared by the WHO as a global pandemic on March 11, 2020 started to
spread in Latin America, and Bolivia was also engulfed thus affecting its public health and economy. (CEPAL, 2020).
After the first cases of COVID-19 were confirmed, Bolivia was one of the first countries that reacted immediately to
cope with the pandemic. Some of the main measures adopted were closing down borders, suspending classroom
teaching at all levels of education and sub-systems; encouraging physical distancing once public spaces were
shutdown; lesser working hours; partial, total or dynamic quarantines were declared; income compensation
www.latinamerica.undp.org | United Nations Development Programme | 2020 21UNDP Latin America and the Caribbean
#COVID19 | POLICY DOCUMENTS SERIES
bonuses were created to strengthen the social protection of households, financial support was provided, especially
for micro, small and medium sized businesses (Mipymes according to its Spanish accronym), and the health care
system was strengthened, just to mention a few measures taken. All of this aimed at safekeeping the lives of people
and keeping the economy afloat.
4.1 Sanitation measures
By mid March, a few days after the first cases had been reported, the government declared a State of National
Health Emergency and a partial quarantine. Borders were closed to foreign travellers and, in less than a week, the
government imposed a total quarantine throughout the national territory in an effort to mitigate the possible
impact on the most vulnerable population and the population at large. All types of economic activities were
forbidden except those considered to be of essence (health and food supply related). In the meantime the sanitary
and economic response would be organized since all business activities had been stopped. In addition to these
measures swift processes were established to purchase medical supplies.
Moreover, the government declared the treatment of COVID-19 free of charge in the public health sector and
adopted an extension of working hours for health care workers of the national health system; customs tariffs on
medical supplies and equipment were declared to be 0%.
With an exponential increase since the end of March, the COVID-19 indicators turned out to be more aggressive
going from a 10% rate of incidence per 100 thousand inhabitants to nearly 850 by mid August. As compared to
neighbouring countries in that same period, the indicators revealed very different behaviours, for example, Chile
has the highest rate of incidence of contagion (an estimated two out of each 100 inhabitants) but, at the same
time, it has a moderate rate of lethality as compared to Brazil and Peru, that also have a high rate of contagion but
even so the rate of lethality is lower than that of Bolivia that has less than double the rate of incidence. This time
line demonstrates the health crisis response and management capacity handled by each country and especially
evidences the precarious health system.
Chart 19. COVID-19 Indicators
a) Bolivia b) South America
900,0 40,0 2.500 7,0
35,4
850,8
800,0 35,0 6,1 6,0
31,3 30,7
700,0 2.000
28,1
2.038
30,0
5,0
667,0
600,0
1.802
25,0 4,4
1.500
500,0 4,0 4,0
1.520
18,0 20,0
3,3
453,6
400,0 3,3 3,0
1.000 2,7
15,0
12,1 2,6
300,0 11,3
868
9,3 2,0
850
2,0
288,5
10,0
200,0
500
620
575
3,2 1,2 1,0
165,7
100,0 5,0
10,1
31,1
83,3
119
6,6
6,1
5,3
0,0
4,6
4,0
3,9
3,7
3,2
3,3
3,4
1,0
3,8
41
0,0 0,0 0 0,0
Incidence Rate x 100,000 Lethality Rate Recovery Rate Indicence Rate x 100,000 Lethality Rate
Source: In-house preparation based on data from the Ministry of Health. 2020.
* The data for South America are for 15.08.20
www.latinamerica.undp.org | United Nations Development Programme | 2020 22UNDP Latin America and the Caribbean
#COVID19 | POLICY DOCUMENTS SERIES
Since it is impossible to maintain a strict quarantine, a dynamic quarantine was established in May based on the
construction of a Municipal Risk Index (MRI) that classifies the 339 municipalities of the country into high, medium
and moderate risk bearing in mind a combination of epidemiological and demographic variables. This index is
updated each week and enables the partial opening of certain territories of the country. Additionally, health care
workers were given an incentive with a double work day and double pay.
The outbreak of the COVID-19 pandemic continued to spread and the Department of Santa Cruz became its
epicenter, the place that registered the highest number of people infected by this coronavirus. This also entailed
several consequences, especially the income lost since this is the most heavily populated Department of Bolivia
and has the highest level of agribusiness activity.
With a precarious and overcrowded sanitary infrastructure and a low density of doctors per inhabitant, as seen
in the previous section, the pandemic was not restrained despite the prevention efforts to flatten the contagion
curve, sentinel hospitals were organized that were obliged to change into a second or third level hospital without
complying with the infrastructure requirements for that level, and the same happened in La Paz, and Santa Cruz
where hotels and sports grounds were organized to accommodate and isolate the less sick people.
These measures contributed to generate a certain capacity to immediately respond, but other structural problems
arose, such as a shortage of human resources, a lack of laboratories to diagnose at a national level, insufficient
reagents and diagnostic tests, as well as a scarcity of biosafety equipment and medicine, which unfortunately have
undermined the measures related to the quarantine.
Leaving aside the extreme gravity due to a lack of intensive care units, the fact that there are not enough beds
required to provide such services is critical, and as mentioned in item 3.4, 90% of the 220 beds available in the
public system at a national level for this purpose were occupied, while the balance of 10% was not being used due
to several reasons and therefore even without the COVID-19 scenario the SUS were unable to satisfy the demand
of their affiliates.
For decades, the health sector in Bolivia has presented a series of deficiencies such as: an adequate planning of
public insurance schemes and their implementation, universal coverage and with no charge, public services without
infrastructure nor an adjusted budgetary allocation, complete records of the services provided, an evaluation of
the insurance by type of service and not by beneficiary/, a census of the doctors and an analysis of the transitions of
the epidemiological profile amongst others, that are needed to plan in keeping with the growth of the population
and their real needs as concerns health care services. Moreover, the pre-elections political situation makes the
transparency of the records related to COVID-19 sensitive, and there is only partial information available.
At present, Bolivia has entered into a massive contagion phase, however, the size of the occupation in the
informal market aggravates the economic crisis and is more severe than the sanitary crisis, making more lockdowns
impossible which can also accentuate the health services crisis.
4.2 Social protection measures
The sudden stop of the economy had immediate consequences for the population, affecting their livelihoods,
particularly for the men and women of the informal sector, that represents 77% of the occupied population, or an
estimated 2,5 million households who are self-employed and are involved in trade (wholesale and retail of non-
food products), manufacturing and construction, for example.
www.latinamerica.undp.org | United Nations Development Programme | 2020 23You can also read