Cross modal motion aftereffects transfer between vision and touch in early deaf adults
←
→
Page content transcription
If your browser does not render page correctly, please read the page content below
www.nature.com/scientificreports
OPEN Cross‑modal motion aftereffects
transfer between vision and touch
in early deaf adults
Kunchen Xiao1,2*, Yi Gao2, Syed Asif Imran3, Shahida Chowdhury2, Sesh Commuri3 &
Fang Jiang2*
Previous research on early deafness has primarily focused on the behavioral and neural changes in
the intact visual and tactile modalities. However, how early deafness changes the interplay of these
two modalities is not well understood. In the current study, we investigated the effect of auditory
deprivation on visuo-tactile interaction by measuring the cross-modal motion aftereffect. Consistent
with previous findings, motion aftereffect transferred between vision and touch in a bidirectional
manner in hearing participants. However, for deaf participants, the cross-modal transfer occurred only
in the tactile-to-visual direction but not in the visual-to-tactile direction. This unidirectional cross-
modal motion aftereffect found in the deaf participants could not be explained by unisensory motion
aftereffect or discrimination threshold. The results suggest a reduced visual influence on tactile motion
perception in early deaf individuals.
Research on early deafness has primarily focused on the behavioral and neural changes in the intact visual and
tactile modalities. The visual abilities of deaf individuals have been extensively studied to understand the plasticity
of multimodal perception following auditory deprivation. Early deaf individuals show enhanced detection and
discrimination of directional visual motion1,2, especially in the periphery vision3,4. The enhanced visual abili-
ties as a result of auditory deprivation are often accompanied by cross-modal recruitment of auditory c ortex5,6.
Increased neural responses to visual motion in the deaf have been reported in multisensory areas, such as the
superior temporal sulcus (STS)7,8 and superior temporal gyrus (STG)9,10, in line with animal research showing
increased neurons in multimodal regions responsive to the intact modality after hearing loss11.
On the other hand, whether tactile processing is enhanced or impaired after hearing loss is inconclusive.
For example, compared to hearing controls, deaf individuals showed enhanced accuracy in tactile frequency
detection12. However, other research reported that deaf individuals showed no enhancement of overall tactile
processing and even impaired performance in tactile temporal discrimination t asks13–17. The change in tactile
performance due to early deafness may depend on the nature of the task: if the tasks involve the temporal
dimension, a dimension that is typically associated with hearing, performance impairments could be observed
in deaf individuals.
Cross-modal reorganization within primary auditory and multimodal regions is likely to influence not only
the processing ability within the visual and tactile modalities but also the interaction between them. Neuroimag-
ing findings suggest that multisensory interactions occur in the auditory c ortex18 and multisensory a reas19,20 in
hearing individuals. In deaf individuals, the auditory cortex was activated in tactile21 and visual p rocessing5 and
22,23
showed greater neural responses to somatosensory s timulation . Since neural reorganizations took place in
auditory cortex and multisensory areas as a result of hearing loss7,9,10, it is reasonable to hypothesize that audi-
tory deprivation may change the way vision and touch interact within these areas. However, the visuo-tactile
interaction in deaf individuals has not been well studied, and results from limited research seem contradictory.
Deaf individuals showed an increased visual influence on touch for spatial processing in visuo-tactile conflict
when judging the spatial location of stimuli24. In contrast, deaf individuals were more susceptible to a double-
flash visual illusion induced by two touches to the face presented in a narrow temporal window23, suggesting a
dominance of touch over vision when the task is reliant on temporal processing.
This discrepancy may be attributed to the distinction between spatial and temporal processing during visuo-
tactile interactions in deaf individuals. Vision may dominate spatial tasks over touch and hearing, since vision
1
Institute of Brain and Psychological Sciences, Sichuan Normal University, Chengdu 610066, Sichuan
Province, China. 2Department of Psychology, University of Nevada, Reno, NV 89557‑0296, USA. 3Department
of Electrical and Biomedical Engineering, University of Nevada, Reno, NV 89557‑0260, USA. *email:
xiao.kun.chong@163.com; fangj@unr.edu
Scientific Reports | (2021) 11:4395 | https://doi.org/10.1038/s41598-021-83960-0 1
Vol.:(0123456789)
www.nature.com/scientificreports/
Age acquiring sign
Subject Gender Age Degree of deafness (dB) language Age becoming deaf Cause of deafness
1 Female 32 96 1 year Born Unknown
2 Female 34 80 1 year Born Hereditary
3 Female 67 90 5 years Born Unknown
4 Female 60 100 5 years Born Unknown
5 Female 40 90 2 years Born Genetic
6 Female 53 85 8 years Born Unknown
7 Male 35 91 2 years Born Cytomegalovirus
8 Male 32 85 15 months 15 months Fever
Mom measles during
9 Female 49 90 11 years Born
pregnancy
10 Female 42 95 12 years 12 months Unknown
Table 1. The characteristics of deaf participants.
typically provides the most reliable information for spatial p erception25. Contrarily, touch and hearing may
dominate temporal tasks over v ision14,26,27. When auditory processing is deprived, temporal processing may
become more dependent on the tactile modality. This interpretation is consistent with the modality appro-
priateness hypothesis28, whereby sensory information is weighted according to the relative relevancy of the
information conveyed by each m odality29; the sensory modality that weights more in a particular context will
dominate behaviors30. For example, tactile motion perception requires discriminating the temporal order of skin
deformation and thus may weight more on temporal than spatial processing19.
To further test this hypothesis, in the present study, we examined the effect of hearing loss on the visuo-tactile
interaction using a cross-modal motion adaptation paradigm. It has been demonstrated that motion aftereffects
transfer bi-directionally between vision and touch in normal-hearing individuals: adapting to visual motion in
one direction causes a subsequent tactile stimulus to be perceived as moving in the opposite direction (visual-
to-tactile aftereffect) and vice versa (tactile-to-visual aftereffect)31. Visual and tactile motion perceptions involve
similar mechanisms of processing spatiotemporal patterns of activation across populations of sensory receptors:
the motion direction is first determined by local motion detectors and then over time integrated to develop a
global motion p erception20,32,33. The cross-modal motion aftereffect involves neural substrates shared by visual
and tactile motion p rocessing19,20, including S TS34, MST35, posterior parietal c ortex36, and human motion com-
37–40
plex hMT + /V5 .
In Experiment 1, we adopted the procedure from the study by Konkle et al.31. By comparing the cross-modal
motion adaptation between hearing and deaf individuals, the present study seeks to understand how early deaf-
ness affects the transfer of motion aftereffects between vision and touch. If discriminating the direction of tactile
motion (tactile motion stimuli are sequentially presented with varying inter-stimulus onset between vibrating
rows) relies on temporal processing, and temporal processing becomes more reliant on the tactile channel after
the auditory channel is deprived, tactile motion perception would weight more on touch and less on vision in
deaf individuals. Thus, deaf individuals’ tactile motion perception would be less affected by visual adaptation,
reducing the visual-to-tactile interference. Therefore, we would expect reduced or even absent visual-to-tactile
motion aftereffects in deaf individuals, while tactile-to-visual motion aftereffects would be similar to those
reported in hearing c ontrols31. In Experiment 2, we assessed whether the transfer pattern we found in Experiment
1 could be explained by the difference in unisensory motion aftereffects or discrimination thresholds between
the deaf and hearing groups.
Experiment 1
Participants. Ten participants with severe to profound early deafness (age 32–67; M = 44.4, SD = 12.38, 2
males) and ten hearing participants (age 31–66; M = 44.8, SD = 12.88, 2 males) were recruited from Reno and
surrounding areas. All deaf participants became deaf before the age of 2 and were fluent in American Sign
Language (See Table 1 for characteristics of deaf participants). None of the deaf use hearing-aids. Deaf and
hearing participants were matched on gender and age. All participants were right-handed and had a normal or
corrected-to-normal vision.
We calculated the effect size based on the smallest visuo-tactile aftereffect reported in the study by Konkle
et al.31, and the estimated Cohen’s d was 1.74. With this conservative estimation of effect size, our prospective
power analysis showed that a sample size of ten could detect a visuo-tactile aftereffect of 1.74 at an alpha level
of 0.05 with a power of 0.82.
Participants provided signed informed consent before any experimentation. All experiment protocols were
reviewed and approved by the Institutional Review Board at the University of Nevada, Reno. The study was
conducted in accordance with the Declaration of Helsinki.
Apparatus. Tactile stimuli were generated by the Latero (http://tactilelabs.com/), a state-of-the-art tactile
display that deforms the finger pad skin with an array of laterally vibrating pins actuated by miniature piezoelec-
tric bending motor41. It has an array of 8 × 8 pins on the surface, with 1.2 × 1.6 mm center-to-center pin spacing
Scientific Reports | (2021) 11:4395 | https://doi.org/10.1038/s41598-021-83960-0 2
Vol:.(1234567890)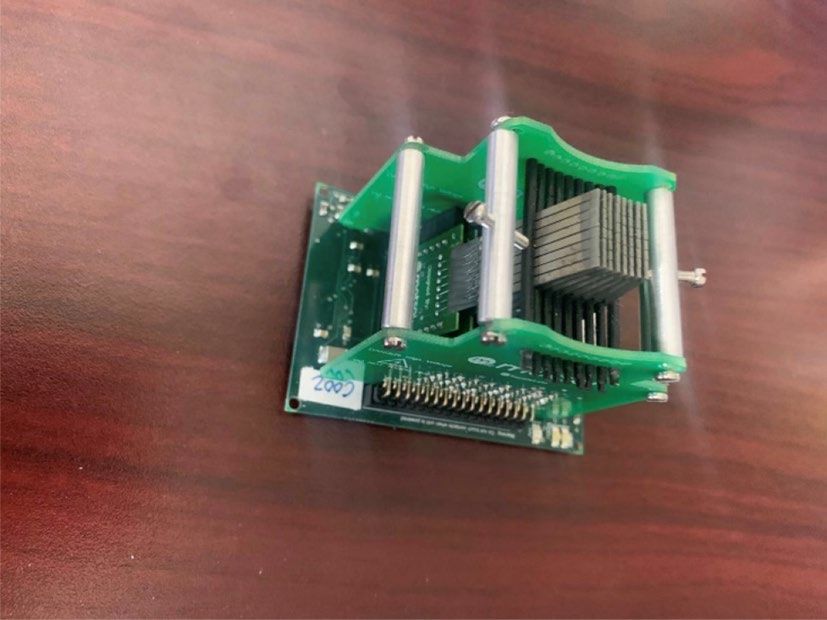
www.nature.com/scientificreports/
Figure 1. A photo of the Latero device without the external plastic cover. On the top of the device is an array of
8 × 8 pins, where participants place their fingertips to feel the tactile vibration.
and 1.2 cm2 total active area (Fig. 1). Each pin can independently vibrate at frequencies up to 100 Hz. By cus-
tomizing the frequency and duration of vibration for each pin, a tactile motion stimulus can be delivered to par-
ticipants’ fingertips. During the experiments, the Latero was located 15 cm behind and 15 cm below the center
point of a 60 Hz Macintosh LED monitor. The screen center and the Latero array were placed in line so that the
fingertip was positioned in the foveal visual field to approximate the best spatial correspondence between the
visual fixation and the fingertip.
Method. The experiment contained two within-subject conditions: a visual-to-tactile (VT) condition and a
tactile-to-visual (TV) condition. The order of the two conditions was counterbalanced between participants, and
there was a twenty-minute break between the two conditions. Both conditions consisted of four sessions: a prac-
tice session, a baseline session, an adapt-to-upward-motion session, and an adapt-to-downward-motion session.
Visual-to-tactile (VT) Condition. There were two blocks in the practice session. In Block 1, eight successive
rows or columns of tactile vibration were delivered (each row or column vibrated for 30 ms at 33.3 Hz) to produce
a tactile “sweep” motion, randomly in one of the four directions: upward, downward, leftward, or rightward. Par-
ticipants reported the motion direction by pressing “U” for upward, “D” for downward, “L” for leftward, and “R”
for rightward on the keyboard, and were given feedback for incorrect responses. There were two sets of 20 sweeps.
In Block 2, 20 sweeps either upward or downward were given. Participants pressed “U” for upward motion
and “D” for downward motion and received feedback for each response. Each sweep consisted of four tactile rows
(row 1, 3, 5, and 7) and the temporal gap between two consecutive rows varied from − 40 to 40 ms, with a positive
number for upward motion and a negative number for downward motion. Participants were then informed that
although it was relatively easy to tell the directions of these tactile sweeps, the Latero could produce ambiguous
sweeps that were difficult to judge, which would be presented for the rest of the experiment.
In the baseline session, tactile motion direction discrimination was measured without adaptation. Participants
were asked to judge whether a tactile sweep was moving upward or downward. Each participant completed three
blocks and each block had one staircase. The tactile sweep consisted of four vibrating tactile rows (Row 1, 3, 5,
and 7) in sequence and each row vibrated for 100 ms at 33.3 Hz; The temporal gap between the onsets of two
consecutive rows (inter-stimulus onset, ISO) was manipulated by a 1-down-1-up staircase procedure to determine
the motion direction: a positive ISO represented an upward sweep while a negative ISO represented a downward
sweep, and 0 ms ISO indicated that the four rows started vibrating simultaneously (no motion direction). The
staircases started from a 1 ms ISO with a 2 ms step and stopped when 20 reversals or 40 trials were reached. That
means the ISO would increase by 2 ms following an incorrect response and decrease by 2 ms following a correct
response. And the reversal was defined as a turning point, which was the trial when the ISO changed from being
increased to being decreased, or vice versa. Participants were instructed to press the “U” for upward sweeps and
“D” for downward sweeps for each trial.
In the adaptation sessions, participants were presented with a visual grating with fixed parameters (10%
Michelson contrast, a spatial frequency of 1.05 cycles per degree, a temporal frequency of 2 Hz, subtending
1.9 × 2.3 degrees in the central visual field with a black fixation dot in the center) drifting either upward or down-
ward for 10 s, followed by a blank screen for 1 s, and then a target tactile sweep. The target tactile sweep had the
same parameters as those in the baseline session, and its ISO (ms) was manipulated by the same 1-down-1-up
staircase procedure. Participants judged the tactile motion direction by either pressing the “U” button for upward
or “D” button for downward motions (Fig. 2). No feedback was given. There were two sessions with a ten-minute
break in between: one session adapting to upward drifting gratings and the other adapting to downward drifting
gratings. The order of the two sessions was counterbalanced between participants.
Tactile-to-visual (TV) Condition. For practice, participants first completed the same Block 1 as in the visual-
to-tactile condition. Participants then received 20 tactile sweeps (one sweep per second) randomly in one of the
four directions: upward, downward, leftward, and rightward. The parameters of the sweeps were the same as in
Block 1. At the same time, a “matched” visual grating, which was the same in parameters as in the visual-to-tactile
Scientific Reports | (2021) 11:4395 | https://doi.org/10.1038/s41598-021-83960-0 3
Vol.:(0123456789)www.nature.com/scientificreports/
Figure 2. The experimental procedure in the visual-to-tactile condition. In each trial, a 10-s visual grating
drifting either upward or downward was presented, followed by a period of 1 s blank and then a rapid target
tactile sweep delivered to participants’ index fingertip of the right hand. The duration of the tactile sweep was
determined by the staircase procedure. Participants were asked to judge the motion direction of the tactile sweep
and press “U” for upward motions and “D” for downward motions.
Figure 3. The experimental procedure in the tactile-to-visual condition. In each trial, 20 successive tactile
sweeps, all going either upward or downward, were delivered to participants’ index fingertip of the right hand
for 10 s, followed by 1 s blank and then a target visual grating drifting for 1 s. Participants were asked to judge
the motion direction of the drifting grating and press “U” for upward motions and “D” for downward motions.
condition, was presented with the same onset and ending time and in the same direction as the tactile sweep.
Participants were asked to observe the visual grating, feel the tactile sweeps, and imagine that their index finger
was aligned with the fixation point.
In the baseline session, participants completed three staircases of drifting gratings by judging whether the
grating was moving upward or downward. The grating was the same in parameters as in the visual-to-tactile
condition except that the contrast was reduced to 1%. The grating consisted of 5 successive frames, and each
frame lasted for 200 ms (1 s in total). The phase jump between two successive frames was manipulated by a
1-down-1-up staircase procedure. A perfect counter-phase of the original grating was defined as 180°; a positive
phase jump represented an upward drifting while a negative phase jump represented a downward drifting. The
three staircases respectively started from a phase jump of 40°, − 40°, or 0°, with a step size of 4°. The staircase
stopped when 20 reversals or 40 trials were reached. Participants were asked to judge the visual motion direction
by pressing “U” for “upward” and “D” for “downward.”
In the adaptation sessions, participants adapted to tactile sweeps in one direction and then judged the motion
direction of a drifting grating. In each trial, participants first received 20 successive tactile sweeps with fixed
parameters for a total of 10 s: a single 240 ms sweep consisted of all 8 rows and each row vibrated for 30 ms at
33.3 Hz (i.e., ISO = 30 ms), followed by a 260 ms pause. All 20 tactile sweeps were going in the same direction:
either upward or downward. Right after the 20 sweeps was a blank period for 1 s. Then a target drifting grating
was presented for 1 s in the center of the screen, which was the same in parameters as in the baseline session.
Participants judged the motion direction of the target grating by pressing “U” for “upward” and “D” for “down-
ward” motions (Fig. 3). The phase jump of the visual grating always started from 2° and was manipulated by the
same 1-down-1-up staircase procedure as in the baseline session. There were two sessions with a ten-minute
break in between: one session adapting to upward tactile sweeps and the other adapting to downward sweeps.
The order of the two sessions was counterbalanced between participants.
Results. Following the Konkle et al. study31, the point of subjective equality (PSE) for each participant was
calculated by discarding the first two reversals and averaging the ISO or phase jump of the remaining reversals.
The divergence of staircases after adaptations was estimated by the difference of PSEs between upward-motion
adaptation and downward-motion adaptation. This measure reflects the effect of adaptation because the two
staircases starting from the same seed would not diverge if there were no aftereffects at a ll31. Therefore, the mag-
nitude of the aftereffect was quantified as the difference between the PSE adapt-to-upward-motion and the PSE
adapt-to-downward-motion. In addition to the divergence of the two staircases, we compared PSE measured
in each staircase to those measured in the baseline session to examine the aftereffect caused by adaptation to
Scientific Reports | (2021) 11:4395 | https://doi.org/10.1038/s41598-021-83960-0 4
Vol:.(1234567890)www.nature.com/scientificreports/
Figure 4. Cross-modal aftereffects measured by PSE in Experiment 1. (Panel A) shows the average of tactile
PSEs after adaptation to visual motions, while (Panel B) shows the average of visual PSEs after adaptation to
tactile motions. PSE after the upward and downward adaptation are shown respectively in white and grey. Error
bars represent one standard error.
each direction. To examine the impact of hearing loss on motion adaptation, a two-way ANOVA on PSE was
performed separately for the visual-to-tactile (VT) and tactile-to-visual (TV) conditions with adapting direction
(upward vs. downward) as a within-subject factor and group (deaf vs. hearing) as a between-subject factor. For
multiple testing correction, we applied Bonferroni adjustment. Specifically, following each ANOVA analysis,
there were four Post-Hoc t-tests, which were treated as one family of t-tests. Thus, the adjusted p-value for sig-
nificance was 0.0125 (0.05/4) for t-tests in the same family.
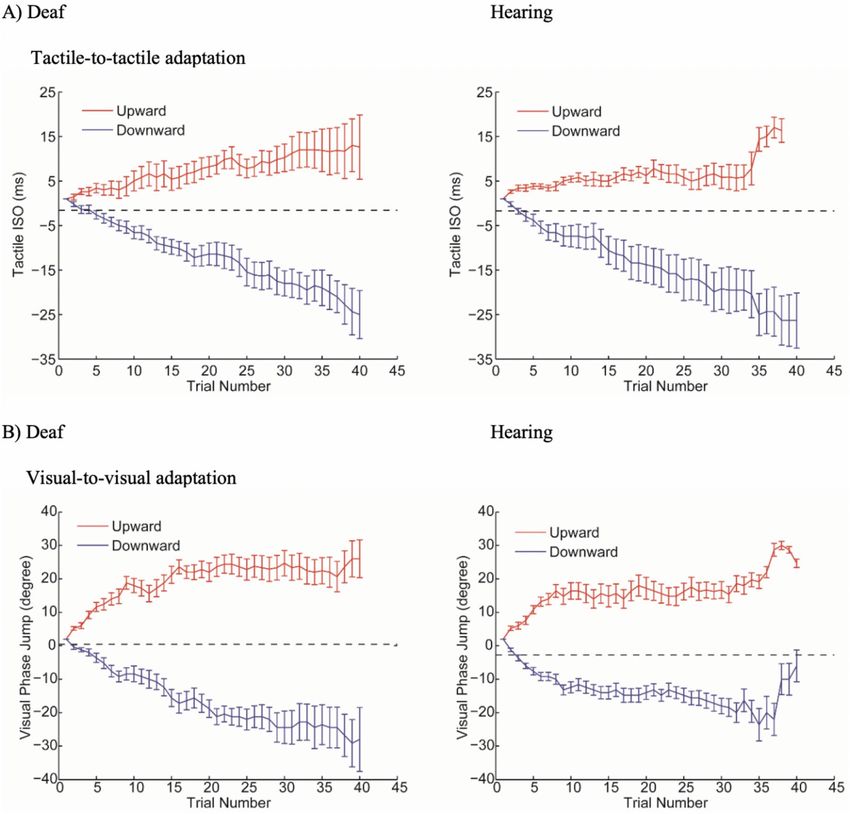
Visual-to-tactile adaptation. The ANOVA showed that there was no main effect of adapting direction (F(1,
18) = 2.29, P > 0.14, partial η2 = 0.11) or group (F(1, 18) = 0.11, P > 0.73, partial η2 = 0.006). A significant interac-
tion was found between adapting direction and group (F (1, 18) = 8.71, P = 0.009, partial η2 = 0.33). Post-Hoc
t-tests indicate that the aftereffect was significant in the hearing group: the PSE of upward adaptation was sig-
nificantly higher than that of the downward adaptation in hearing individuals (t (9) = 4.84, P < 0.001, Cohen’s
d = 1.61). However, for the deaf group, the PSE of upward adaptation was not significantly different from the
PSE of downward adaptation (t (9) = 0.81, P > 0.43, Cohen’s d = 0.27), indicating no significant visual-to tactile
motion aftereffect (Fig. 4).
In the hearing group, PSE after adaptation was significantly different from the baseline PSE (upward adapta-
tion: t(1, 9) = 3.52, P < 0.007, Cohen’s d = 1.17; downward adaptation: t(1, 9) = 4.97, P < 0.001, Cohen’s d = 1.65). In
contrast, in the deaf group, neither PSE after adapting to upward or downward was significantly different from
baseline PSE (upward adaptation: t(1, 9) = 0.83, P > 0.42, Cohen’s d = 0.27; downward adaptation: t(1, 9) = 0.44,
P > 0.66, Cohen’s d = 0.14) (Fig. 4A). Individual data of aftereffects are shown on the scatter plots below for hear-
ing (Fig. 5A) and deaf (Fig. 5B) participants. As demonstrated by the staircase progress in Fig. 6A, a significant
divergence between upward and downward adaptation was observed in the hearing group (Sign test, P = 0.002)
but not in the deaf group (Sign test, P > 0.75).
In addition, there was no significant difference of baseline PSE between the hearing (M = − 1.73, SD = 5.58)
and deaf (M = − 1.58, SD = 4.59); t(1, 9) = 0.06, P > 0.95. To check the order effect of adaptation tasks, both hear-
ing and deaf groups were further divided into two subgroups according to the order of tasks performed: one
group first performed the visual-to-tactile task while the other group first performed the tactile-to-visual task;
the aftereffects of visual-to-tactile adaptation were compared between the two subgroups, and no order effect
was found for the hearing or the deaf group (P > 0.25). These results suggest that the presence of visual-to-tactile
motion aftereffects in hearing but not in deaf participants was not due to baseline performance or testing order.
In addition, the Pearson’s Correlation Coefficient between the severity of deafness and the aftereffect was not
significant (r(9) = − 0.52, P = 0.12), suggesting the degree of hearing loss has a nonsignificant influence on the
magnitude of visual-to-tactile motion aftereffect.
Tactile-to-visual adaptation. The ANOVA showed a significant main effect of direction (F(1, 18) = 23.44,
P < 0.001, partial η2 = 0.57). Neither the main effect of group (F(1, 18) = 1.29, P > 0.27, partial η2 = 0.07) nor the
interaction effect between adapting direction and group (F(1, 18) = 0.75, P > 0.39, partial η2 = 0.04) was signifi-
cant. Post-Hoc t-test showed significantly higher PSE after upward adaptation than downward adaptation for
both hearing (t(9) = 3.45, P = 0.007, Cohen’s d = 1.52) and deaf individuals t(9) = 3.53, P = 0.006, Cohen’s d = 1.51),
indicating significant aftereffects in both groups.
As shown in Fig. 6B, a significant divergence between PSE after upward adaptation and downward adapta-
tion was present in both hearing (Sign test, P = 0.002) and deaf group (Sign test, P < 0.03). In the hearing group,
PSE after adaptation was significantly different from the baseline (upward adaptation: t(1, 9) = 3.26, P < 0.02,
Cohen’s d = 1.08; downward adaptation: t(1, 9) = 3.02, P < 0.02, Cohen’s d = 1.01). This was also true for the deaf
group (upward adaptation: t(1, 9) = 2.97, P < 0.02, Cohen’s d = 0.99; downward adaptation: t(1, 9) = 3.76, P < 0.005,
Cohen’s d = 1.25) (Fig. 4B). Individual data of aftereffects are shown on the scatter plots below for the hearing
Scientific Reports | (2021) 11:4395 | https://doi.org/10.1038/s41598-021-83960-0 5
Vol.:(0123456789)www.nature.com/scientificreports/
Figure 5. Scatter plots showing individual visual-to-tactile aftereffects in hearing (Panel A) and deaf (Panel B)
group. The x-axis represents upward-motion aftereffect (upward-adaptation PSE-baseline PSE), and the y-axis
plots the downward-motion aftereffect (baseline PSE-downward-adaptation PSE). The unit is ms of tactile ISO.
Note that both upward-motion and downward-motion aftereffects plotted here are expected to be positive
values.
(Fig. 7A) and deaf (Fig. 7B) participants. See Supplementary Data online for individual PSEs of baselines and
adaptations in all conditions.
In addition, there was no significant difference of baseline PSE between the hearing (M = − 2.74, SD = 5.17) and
deaf (M = 0.46, SD = 5.50); t(1, 9) = 1.29, P > 0.22. Similar to the visual-to-tactile adaptation condition, no order
effect of adaptation tasks was found for the hearing or the deaf group (ps > 0.40), and the correlation between
the severity of deafness and the aftereffect was not significant (r(9) = − 0.49, P = 0.15).
Interim discussion
The cross-modal adaptation effect reported by Konkle et al.31 was replicated in the hearing group. On the other
hand, deaf participants showed a unidirectional aftereffect: the motion aftereffect transferred from touch to vision
but not from vision to touch. The results corroborate our hypotheses that tactile motion perception, which relies
on temporal cues, became less susceptible to visual influence after hearing loss. However, there could be two
alternative explanations. First, congenitally deaf participants may possess enhanced sensitivity to tactile motions,
which helps resisting aftereffects caused by visual adaptation. Second, differences in cross-modal aftereffects
may be partially driven by changes in aftereffects within each modality. Thus, we conducted Experiment 2 to
investigate these two alternative explanations by comparing discrimination thresholds of motion-direction and
unisensory aftereffects between the deaf and hearing participants.
Experiment 2
Method. Experiment 2 examined whether the deaf and hearing participants differed in unisensory adapta-
tion or discrimination thresholds of motion-direction. The same participants as in Experiment 1 performed two
unisensory adaptation tasks: a tactile-to-tactile (TT) task and a visual-to-visual (VV) task. Each task consisted
of four sessions: a practice session, a baseline session, an adapt-to-upward-motion session, and an adapt-to-
downward-motion session. Participants’ discrimination thresholds of motion direction were measured with a
2-down-1-up staircase.
Tactile-to-tactile (TT) Condition. The procedure and testing stimulus were the same as in the visual-to-tactile
adaptation in Experiment 1, and the adapting stimulus was the tactile adaptor used in the tactile-to-visual
adaptation.
Visual-to-visual (VV) Condition. The procedure and testing stimulus were the same as in the tactile-to-visual
adaptation in Experiment 1, and the adapting stimulus was the visual adaptor used in the visual-to-tactile
adaptation.
Tactile and visual discrimination thresholds of motion-direction. The thresholds were measured separately for
tactile and visual conditions. In each condition, there were three blocks. In each block, a 2-down-1-up staircase
containing 80 trails was employed to measure the discrimination threshold of motion direction. The tactile
motion staircase started either from a 20 ms or a -20 ms ISO with a step size of 1 ms. The visual motion staircase
started either from a 40° or − 40° phase jump with a step size of 2°. The motion direction (upward/downward) was
randomly determined for each trial. Participants were asked to judge the direction of each motion and pressed
the “U” for “upward motion” and the “D” for “downward motion.” The average of the last 6 reversals of the three
blocks was taken as the discrimination threshold of 70.7% correct.
Scientific Reports | (2021) 11:4395 | https://doi.org/10.1038/s41598-021-83960-0 6
Vol:.(1234567890)www.nature.com/scientificreports/
Figure 6. Staircase progress in Experiment 1. The staircase progress is shown separately for the deaf (left
column) and hearing participants (right column) in the visual-to-tactile (panel A) and tactile-to-visual (panel B)
adaptation conditions. Staircases in the upward and downward adaptation conditions are shown respectively in
red and blue. The black dashed lines were the average baseline PSE without adaptation. Error bars represent one
standard error.
Results. A two-way ANOVA on PSE was performed separately for the tactile-to-tactile (TT) and visual-to-
visual (VV) conditions with adapting direction (upward vs. downward) as a within-subject factor and group
(deaf vs. hearing) as a between-subject factor.
Tactile-to-tactile (TT) adaptation. The ANOVA showed a significant main effect of adapting direction (F(1,
18) = 41.13, P < 0.001, partial η2 = 0.70) but no main effect of group (F(1, 18) = 1.51, P > 0.23, partial η2 = 0.08) or
interaction (F(1, 18) = 0.03, P > 0.87, partial η2 = 0.002). Post-Hoc t-tests showed that PSE after upward adaptation
was significantly higher than that after downward adaptation for both hearing (t(9) = 4.24, P = 0.002, Cohen’s
d = 2.16) and deaf individuals (t(9) = 4.94, P < 0.001, Cohen’s d = 2.74) (Fig. 8A). As shown in Fig. 9A, significant
divergence between PSEs after upward and downward adaptation was observed in both hearing (Sign test,
P = 0.002) and deaf group (Sign test, P = 0.002).
Compared to the baseline PSE, PSE after adaptation was significantly different for both deaf (upward adapta-
tion: t(1, 9) = 4.31, P = 0.002, Cohen’s d = 1.44; downward adaptation: t(1, 9) = 4.19, P < 0.003, Cohen’s d = 1.39)
and hearing group (upward adaptation: t(1, 9) = 3.85, P < 0.004, Cohen’s d = 1.28; downward adaptation: t(1,
9) = 3.35, P < 0.009, Cohen’s d = 1.12) (Fig. 8A). There was no significant difference of baseline PSE between the
two groups (P > 0.80).
Visual-to-visual (VV) adaptation. The ANOVA showed a significant main effect of adapting direction (F(1,
18) = 94.38, P < 0.001, partial η2 = 0.84) but no main effect of group (F(1, 18) = 0.006, P = 0.94, partial η2 < 0.001) or
interaction (F (1, 18) = 2.03, P > 0.17, partial η2 = 0.1). Post-Hoc t-tests showed that PSE after upward adaptation
was significantly higher than that after downward adaptation for both hearing (t(9) = 8.71, P < 0.001, Cohen’s
d = 2.65) and deaf individuals (t(9) = 6.33, P < 0.001, Cohen’s d = 2.94). The staircases progress after upward and
Scientific Reports | (2021) 11:4395 | https://doi.org/10.1038/s41598-021-83960-0 7
Vol.:(0123456789)www.nature.com/scientificreports/
Figure 7. Scatter plots showing individual tactile-to-visual aftereffects in the hearing (Panel A) and deaf (Panel
B) group. The x-axis represents upward-motion aftereffects (upward-adaptation PSE-baseline PSE), and the
y-axis represents downward-motion aftereffects (baseline PSE-downward-adaptation PSE). The unit is degree of
visual phase jump. Note that both upward-motion and downward-motion aftereffects plotted here are expected
to be positive values.
Figure 8. Unisensory aftereffects measured by PSE in Experiment 2. (Panel A) shows the average of tactile PSEs
after adaptation to tactile motions, while (Panel B) shows the average of visual PSEs after adaptation to visual
motions. PSE after the upward and downward adaptation are shown respectively in white and grey. Error bars
represent one standard error.
downward motion adaptation showed reliable divergence for both groups (Sign test, deaf: P < 0.003, hearing:
P < 0.003) (Fig. 9B).
PSE after adaptation was significantly different from the baseline PSE, for both the deaf (upward adapta-
tion: t(1, 9) = 4.05, P < 0.003, Cohen’s d = 1.35; downward adaptation: t(1, 9) = 6.49, P < 0.0002, Cohen’s d = 2.16)
and hearing group (upward adaptation: t(1, 9) = 6.33, P < 0.0002, Cohen’s d = 2.11; downward adaptation: t(1,
9) = 3.30, P < 0.01, Cohen’s d = 1.10) (Fig. 8B). There was no significant difference of baseline PSE between the
two groups (P > 0.20).
Tactile and visual discrimination thresholds of motion-direction. Tactile motion thresholds of the deaf
(M = 11.09, SD = 4.26) and those of the hearing (M = 13.35, SD = 2.93) were not significantly different (t(18) = 1.38,
P > 0.18, Cohen’s d = 0.61). Similarly, there was no significant difference in discrimination thresholds for visual
motion between the deaf (M = 9.43, SD = 4.46) and hearing (M = 10.81, SD = 7.12) (t(18) = 0.52, P > 0.60, Cohen’s
d = 0.23).
Scientific Reports | (2021) 11:4395 | https://doi.org/10.1038/s41598-021-83960-0 8
Vol:.(1234567890)www.nature.com/scientificreports/
Figure 9. Staircase progress in Experiment 2. The staircase progress is shown separately for the deaf (left
column) and hearing participants (right column) in the tactile-to-tactile (panel A) and visual-to-visual (panel B)
adaptation conditions. Staircases in the upward and downward adaptation conditions are shown respectively in
red and blue. The black dashed lines were the average baseline PSE without adaptation. Error bars represent one
standard error.
Discussion
In the current study, we examined the effects of early auditory deprivation on the visuo-tactile interaction by
comparing visuo-tactile cross-modal aftereffects between deaf and hearing participants. Consistent with the
previous study by Konkle et al.31, we found bidirectional cross-modal motion aftereffects in the hearing group:
aftereffects transferred from vision to touch and from touch to vision. In contrast, the deaf group showed a unidi-
rectional cross-modal motion aftereffect: the aftereffect transferred only from touch to vision but not from vision
to touch. In addition, we found no difference in unisensory motion aftereffects or in discrimination thresholds
of motion-direction between the hearing and deaf group. Thus, the observed difference in cross-modal motion
aftereffects between hearing and deaf participants cannot be attributed to unisensory motion aftereffects or
motion direction discrimination thresholds.
The reliance on tactile over visual modality observed in deaf individuals for tactile motion perception is in
line with the modality appropriateness hypothesis that sensory information is weighted according to the relative
precision of the information conveyed by each sensory modality28. Within this framework, the sensory modality
that is most relevant in that particular context will be weighed more and thus dominate b ehaviors29,30. In the
current study, tactile motion perception can be considered as weighting more on temporal processing, given that
the motion direction is manipulated by varying the temporal gap between two tactile rows (i.e., ISO). Without
auditory input, deaf individuals seem to rely more on touch than hearing for temporal processing, and in turn,
are less influenced by vision when performing tactile motion discrimination. The dominance of touch over vision
in the deaf, therefore, is embodied in a task that taps on temporal features.
The context specificity is the core character of the modality appropriateness hypothesis. Within this frame-
work, when auditory input is absent, deaf people would rely more on touch for temporal processing. Our results
Scientific Reports | (2021) 11:4395 | https://doi.org/10.1038/s41598-021-83960-0 9
Vol.:(0123456789)www.nature.com/scientificreports/
are consistent with previous research showing a reduced visual-to-tactile influence in visuo-tactile i ntegration42
and those reported by Karns et al.23 showing higher susceptibility to the double-flash visual illusion induced by
two touches to the face in congenitally deaf adults, suggesting sensory modality with greater temporal precision
(touch) influencing the timing of a less precise modality (vision). In contrast, increased visual interference during
visuo-tactile spatial interference tasks was reported in deaf individuals as compared to hearing c ontrols24, sug-
gesting sensory modality with greater spatial precision (vision) influencing the location of a less precise modality
(touch). Combined, these results are suggestive of a double dissociation, whereby in deaf individuals the influence
of touch is enhanced in temporal tasks and that of vision is enhanced in spatial tasks. Therefore, preferences to
process a given class of stimuli via a specific sensory modality may be enhanced as a result of sensory deprivation.
It is noteworthy that the relatively increased weighting of the touch over vision was not accompanied by an
enhanced tactile motion processing, as the deaf showed no better sensitivity to tactile motion direction. In addi-
tion, no difference of tactile-to-tactile aftereffects was found between the deaf and the hearing group, suggesting
that tactile intra-modal motion processing did not benefit from auditory deprivation. Similarly, previous studies
indicate that deaf individuals show no enhancement or even impairment in tactile temporal p rocessing13–17. The
results presented here, on the other hand, can be interpreted instead as relative robustness of the touch over
vision—deaf individuals are less influenced by visual stimulation and thus able to filter out distracting infor-
mation from the visual modality and report the actual direction of the tactile motion. This relative robustness,
however, is largely driven by the particular context (i.e., the nature of the task) and seems to be independent of
tactile intra-modal sensitivity.
It is reasonable to conclude that the visual-to-tactile motion aftereffect is at least reduced after hearing loss.
Admittedly, although our power analysis based on the preceding study by Konkle et al.31 showed that a sample size
of ten had an acceptable level of power due to the large effect size of visuo-tactile aftereffect, the conclusion drew
from a small sample size should be taken with caution, and the reported unidirectional visuo-tactile aftereffects
found in the deaf individuals shall be examined with a larger sample size in the future. Besides, further research
may consider adding a visual-to-tactile synchronization phase in the practice session in the visual-to-tactile con-
dition, as in the tactile-to-visual condition. The reason for not including the visual-to-tactile synchronization in
the Konkle et al. s tudy31 or the present study was that previous evidence already showed strong visual-to-tactile
influence, and both studies found significant visual-to-tactile aftereffects in hearing individuals. Nevertheless, the
lack of a visual-to-tactile synchronization procedure during the practice session may have potentially contributed
to the lack of visual-to-tactile aftereffects in the deaf group. To further understand visuo-tactile interaction in
deaf individuals, it would be helpful to investigate factors (e.g., stimulus intensity) that influence the observed
unidirectional cross-modal motion aftereffect in future research.
Data availability
De-identified datasets generated or analyzed during the current study are available from the corresponding
authors on reasonable request.
Received: 27 November 2019; Accepted: 29 December 2020
References
1. Shiell, M. M., Champoux, F. & Zatorre, R. J. Enhancement of visual motion detection thresholds in early deaf people. PLOS ONE.
9, e90498. https://doi.org/10.1371/journal.pone.0090498 (2014).
2. Hauthal, N., Sandmann, P., Debener, S. & Thorne, J. D. Visual movement perception in deaf and hearing individuals. Adv. Cognit.
Psychol. 9(2), 53 (2013).
3. Pavani, F. & Bottari, D. Visual abilities in individuals with profound deafness: a critical review. In The neural bases of multisensory
processes Vol. 22 (eds Murray, M. M. & Wallace, M. T.) (CRC Press, New York, 2012).
4. Neville, H. J. & Lawson, D. Attention to central and peripheral visual space in a movement detection task: an event-related potential
and behavioral study II. Congenitally deaf adults. Brain Res. 405(2), 268–283 (1987).
5. Fine, I., Finney, E. M., Boynton, G. M. & Dobkins, K. R. Comparing the effects of auditory deprivation and sign language within
the auditory and visual cortex. J. Cognit. Neurosci. 17, 1621–1637 (2005).
6. Finney, E. M., Fine, I. & Dobkins, K. R. Visual stimuli activate auditory cortex in the deaf. Nat. Neurosci. 4, 1171 (2001).
7. Bavelier, D. et al. Impact of early deafness and early exposure to sign language on the cerebral organization for motion processing.
J. Neurosci. 21, 8931–8942 (2001).
8. Scurry, A. N., Huber, E., Matera, C. & Jiang, F. Increased right posterior STS recruitment without enhanced directional-tuning
during tactile motion processing in early deaf individuals. Front. Neurosci. 14, 864 (2020).
9. Shiell, M. M., Champoux, F. & Zatorre, R. J. Reorganization of auditory cortex in early-deaf people: functional connectivity and
relationship to hearing aid use. J. Cognit. Neurosci. 27, 150–163 (2015).
10. Vachon, P. et al. Reorganization of the auditory, visual and multimodal areas in early deaf individuals. Neuroscience 245, 50–60
(2013).
11. Meredith, M. A. & Lomber, S. G. Somatosensory and visual crossmodal plasticity in the anterior auditory field of early-deaf cats.
Hear. Res. 280, 38–47 (2011).
12. Levänen, S. & Hamdorf, D. Feeling vibrations: enhanced tactile sensitivity in congenitally deaf humans. Neurosci. Lett. 301, 75–77
(2001).
13. Papagno, C., Cecchetto, C., Pisoni, A. & Bolognini, N. Deaf, blind or deaf-blind: is touch enhanced?. Exp. Brain Res. 234, 627–636
(2016).
14. Bolognini, N. et al. Hearing shapes our perception of time: temporal discrimination of tactile stimuli in deaf people. J. Cognit.
Neurosci. 24, 276–286 (2012).
15. Frenzel, H. et al. A Genetic Basis for Mechanosensory Traits in Humans. PLoS Biol. 10(5), e1001318. https: //doi.org/10.1371/journ
al.pbio.1001318 (2012).
16. Heming, J. E. & Brown, L. N. Sensory temporal processing in adults with early hearing loss. Brain Cogn. 59(2), 173–182 (2005).
17. Moallem, T. M., Reed, C. M. & Braida, L. D. Measures of tactual detection and temporal order resolution in congenitally deaf and
normal-hearing adults. J. Acoust. Soc. Am. 127(6), 3696–3709 (2010).
Scientific Reports | (2021) 11:4395 | https://doi.org/10.1038/s41598-021-83960-0 10
Vol:.(1234567890)www.nature.com/scientificreports/
18. Musacchia, G. & Schroeder, C. E. Neuronal mechanisms, response dynamics and perceptual functions of multisensory interactions
in auditory cortex. Hear. Res. 258(1–2), 72–79 (2009).
19. Pei, Y. C. & Bensmaia, S. J. The neural basis of tactile motion perception. J. Neurophysiol. 112, 3023–3032 (2014).
20. Konkle, T. & Moore, C. I. What can crossmodal aftereffects reveal about neural representation and dynamics?. Commun. Integr.
Biol. 2, 479–481 (2009).
21. Levänen, S., Jousmäki, V. & Hari, R. Vibration-induced auditory-cortex activation in a congenitally deaf adult. Curr. Biol. 8(15),
869–872 (1998).
22. Auer, E. T. Jr., Bernstein, L. E., Sungkarat, W. & Singh, M. Vibrotactile activation of the auditory cortices in deaf versus hearing
adults. Neuroreport 18, 645–648 (2007).
23. Karns, C., Dow, M. & Neville, H. Altered cross-modal processing in the primary auditory cortex of congenitally deaf adults: a
visual-somatosensory fMRI study with a double-flash illusion. J. Neurosci. 32, 9626–9638 (2012).
24. Heimler, B., Baruffaldi, F., Bonmassar, C., Venturini, M. & Pavani, F. Multisensory interference in early deaf adults. J. Deaf Stud.
Deaf Educ. 22, 422–433 (2017).
25. Cappagli, G. & Gori, M. The role of vision on spatial competence, in Visual impairment and blindness (ed. Giudice, G. L.) https://
doi.org/10.5772/intechopen.89273 (IntechOpen, 2019).
26. Shams, L., Kamitani, Y. & Shimojo, S. Modulations of visual perception by sound. In Handbook of multisensory processes (eds
Calvert, G. et al.) 27–34 (MIT Press, London, 2004).
27. Hidaka, S., Teramoto, W. & Sugita, Y. Spatiotemporal processing in crossmodal interactions for perception of the external world:
a review. Front. Integr. Neurosci. 9, 62 (2015).
28. Welch, R. B. & Warren, D. H. Immediate perceptual response to intersensory discrepancy. Psychol. Bull. 88(3), 638 (1980).
29. Dionne, J. K., Legon, W. & Staines, W. R. Crossmodal influences on early somatosensory processing: interaction of vision, touch,
and task-relevance. Exp. Brain Res. 226(4), 503–512 (2013).
30. Ernst, M. O. & Banks, M. S. Humans integrate visual and haptic information in a statistically optimal fashion. Nature 415(6870),
429–433 (2002).
31. Konkle, T., Wang, Q., Hayward, V. & Moore, C. I. Motion aftereffects transfer between touch and vision. Curr. Biol. 19, 745–750
(2009).
32. Pei, Y. C., Hsiao, S. S., Craig, J. C. & Bensmaia, S. J. Shape invariant coding of motion direction in somatosensory cortex. PLoS
Biol. 8, e1000305 (2010).
33. Pei, Y. C., Hsiao, S. S. & Bensmaia, S. J. The tactile integration of local motion cues is analogous to its visual counterpart. Proc.
Natl. Acad. Sci. 105, 8130–8135 (2008).
34. Beauchamp, M. S., Yasar, N. E., Frye, R. E. & Ro, T. Touch, sound and vision in human superior temporal sulcus. NeuroImage. 41,
1011–1020 (2008).
35. Beauchamp, M. S., Yasar, N. E., Kishan, N. & Ro, T. Human MST but not MT responds to tactile stimulation. J. Neurosci. 27(31),
8261–8267 (2007).
36. Bremmer, F. et al. Polymodal motion processing in posterior parietal and premotor cortex: a human fMRI study strongly implies
equivalencies between humans and monkeys. Neuron 29(1), 287–296 (2001).
37. Blake, R., Sobel, K. V. & James, T. W. Neural synergy between kinetic vision and touch. Psychol. Sci. 15(6), 397–402 (2004).
38. Hagen, M. C. et al. Tactile motion activates the human middle temporal/V5 (MT/V5) complex. Eur. J. Neurosci. 16(5), 957–964
(2002).
39. Van Kemenade, B. et al. Tactile and visual motion direction processing in hMT+/V5. Neuroimage 84, 420–427 (2014).
40. Jiang, F., Beauchamp, M. S. & Fine, I. Re-examining overlap between tactile and visual motion responses within hMT + and STS.
NeuroImage. 119, 187–196 (2015).
41. Lévesque, V. & Hayward, V. Laterotactile rendering of vector graphics with the stroke pattern. Int. Conf. Hum. Haptic Sens. Touch
Enabled Comput. Appl. 6192, 25–30 (2010).
42. Hauthal, N., Debener, S., Rach, S., Sandmann, P. & Thorne, J. D. Visuo-tactile interactions in the congenitally deaf: a behavioral
and event-related potential study. Front. Integr. Neurosci. 8, 98 (2015).
Acknowledgements
This work was supported by the National Institutes of Health [EY023268 to FJ and P20GM103650]. Kunchen
Xiao is supported by the National Natural Science Foundation of China [Grant Number 31671150].
Author contributions
K.X., F.J., S.C. conceived the experiments. K.X., S. AI., S.C. set up the hardware. K.X., Y.G., S. AI. coded the
computer programs. K.X. and S.C. conducted the experiments. K.X. and Y.G. analyzed the data. K.X. wrote the
original manuscript. K.X. and Y.G. prepared figures. K.X., Y.G., F.J. revised the manuscript. K.X., F.J., S.C. man-
aged the research progress. All authors reviewed the manuscript.
Competing interests
The authors declare no competing interests.
Additional information
Supplementary Information The online version contains supplementary material available at https://doi.
org/10.1038/s41598-021-83960-0.
Correspondence and requests for materials should be addressed to K.X. or F.J.
Reprints and permissions information is available at www.nature.com/reprints.
Publisher’s note Springer Nature remains neutral with regard to jurisdictional claims in published maps and
institutional affiliations.
Scientific Reports | (2021) 11:4395 | https://doi.org/10.1038/s41598-021-83960-0 11
Vol.:(0123456789)www.nature.com/scientificreports/
Open Access This article is licensed under a Creative Commons Attribution 4.0 International
License, which permits use, sharing, adaptation, distribution and reproduction in any medium or
format, as long as you give appropriate credit to the original author(s) and the source, provide a link to the
Creative Commons licence, and indicate if changes were made. The images or other third party material in this
article are included in the article’s Creative Commons licence, unless indicated otherwise in a credit line to the
material. If material is not included in the article’s Creative Commons licence and your intended use is not
permitted by statutory regulation or exceeds the permitted use, you will need to obtain permission directly from
the copyright holder. To view a copy of this licence, visit http://creativecommons.org/licenses/by/4.0/.
© The Author(s) 2021
Scientific Reports | (2021) 11:4395 | https://doi.org/10.1038/s41598-021-83960-0 12
Vol:.(1234567890)You can also read