CUSTOMER SATISFACTION INDEX OF SINGAPORE 2018 - Q1 RESULTS OVERVIEW RETAIL AND INFO-COMMUNICATIONS - Institute of Service Excellence
←
→
Page content transcription
If your browser does not render page correctly, please read the page content below
CUSTOMER SATISFACTION INDEX
OF SINGAPORE 2018

Q1 RESULTS OVERVIEW
RETAIL AND INFO-COMMUNICATIONS
2018 Q1 SCORES
                                RETAIL AND INFO-COMMUNICATIONS

        How Well Did Companies Satisfy Their Customers?

     72.6 Retail                                                                                             70.4 Info-Communications

     72.9 Supermarkets                                     72.0 e-Commerce                                   71.7 Wireless@SG
     73.6   NTUC Fairprice                                 74.2   Zalora*
     73.1   Sheng Siong                                    73.7   Fave                                       71.1 Mobile Telecom
     72.7   Cold Storage                                   73.4   Ebay                                       74.1 Singtel*
     71.9   Giant                                          72.1   Taobao/Tmall                               69.4 StarHub
     70.7   Other supermarkets                             72.1   Qoo10                                      67.9 M1
                                                           71.4   Carousell
     72.8 Fashion Apparels                                 71.2   Amazon                                     68.9 Broadband
     76.0 Zara*                                            69.8   Other e-Commerce                           69.4 M1
     75.4   Adidas                                                                                           68.9 StarHub
     74.9   Uniqlo                                         71.8 Department Stores                            68.7 Singtel
     74.2   H&M                                            74.2   DFS*
     73.6   Esprit                                         73.0   Takashimaya                                68.1 PayTV
     73.6   G2000                                          72.6   Metro                                      68.8 StarHub
     71.7   Bossini                                        72.3   Robinsons                                  67.3 Singtel
     71.4   Giordano                                       72.0   Isetan
     71.2   Hang Ten                                       71.5   BHG
     70.1   Cotton On                                      71.3   Tangs
     72.0   Other fashion apparels                         69.6   OG
                                                           70.4   Other department stores

This chart summarises the results of the CSISG 2018                  The sparklines indicate the satisfaction score of their
satisfaction scores in the Retail and Info-Communications            respective sectors, sub-sectors and companies over the past
sectors at the sector, sub-sector and company levels.                few years.
Each sector score (in gold) represents a weighted average                      statistically significant increase in customer
of their respective sub-sector scores (in blue). Satisfaction                  satisfaction from 2017 to 2018
scores for sub-sectors with individual company scores are                      statistically significant decrease in customer
weighted averages of these individual company scores.                          satisfaction from 2017 to 2018
All scores displayed are accurate to one-decimal place.                        no significant year-on-year change in customer
Entities are presented in decreasing levels of satisfaction.                   satisfaction score
* Companies indicated with an asterisk(*) are companies that
have performed significantly above their sub-sector average.
* Sub-sectors indicated with an asterisk(*) are sub-sectors
that have performed significantly above their sector average.
CSISG 2018 FIRST QUARTER RESULTS OVERVIEW
The Customer Satisfaction Index of Singapore (CSISG) computes customer satisfaction scores at the national,
sector, sub-sector, and company levels. The CSISG serves as a quantitative benchmark of the quality of goods
and services produced by the Singapore economy over time. 2018 marks the 12th year of measurement for
the CSISG national study.
FIRST QUARTER RESULTS HIGHLIGHTS
Compared to the same period last year, customer satisfaction levels remained statistically unchanged for both
the Retail and Info-Communications sectors. The Retail sector scored 72.6 points (0-100 scale), an increase
of 0.6% from the year before; the minor uptick was not considered statistically significant*. The Info-
Communications sector scored 70.4 points, a 1.1% increase over the same period last year. Similar to the
Retail sector, this upward movement was not significant. Nevertheless, it is notable that both sectors
registered their fourth consecutive year of improvement in customer satisfaction.
All four sub-sectors measured within the Retail sector, i.e., Department Stores, e-Commerce, Fashion
Apparels, and Supermarkets, registered upticks in their year-on-year scores. However, none of these
movements were considered significant.
Like the Retail sector, four sub-sectors were measured within the Info-communications sector: Broadband,
Mobile Telecom, PayTV, and Wireless@SG. Likewise, although each sub-sector registered year-on-year
improvements in their score, none of these movements were significant.
Figure 1 illustrates the CSISG year-on-year performance of each sub-sector measured in Q1.
73
2017
2018
CSISG Score (0-100 scale)
72
71
70
69
68
67
Department Fashion Supermarkets e-Commerce Mobile Broadband PayTV Wireless@SG
Stores Apparels Telecom
Figure 1: CSISG 2017 and 2018 scores for each measured Retail and Info-communications sub-sector.
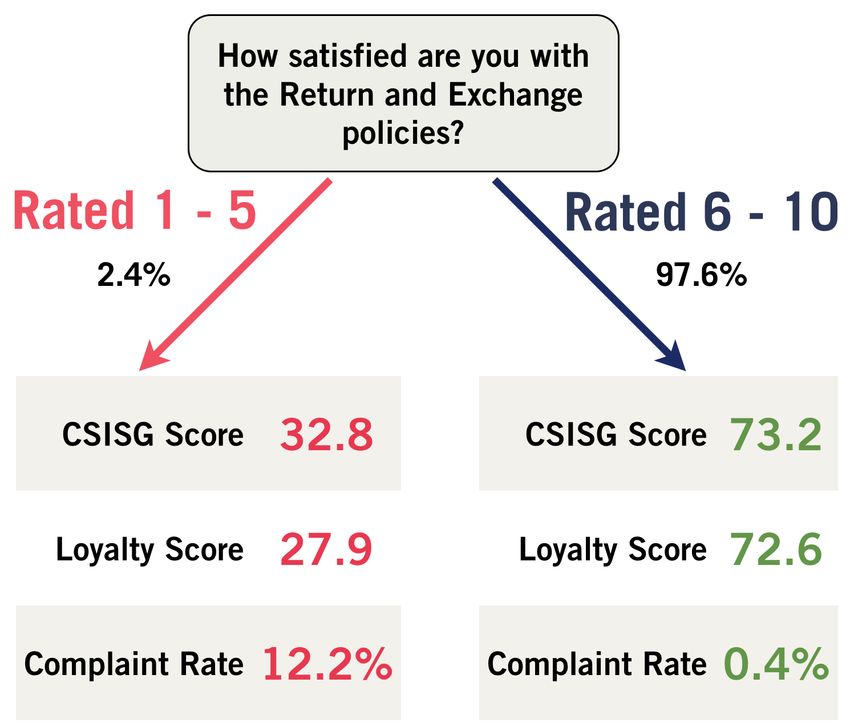
*Statistical significance for the CSISG study is measured at a confidence interval of 90%.FIRST QUARTER KEY FINDINGS Retailers’ Return and Exchange Policies Important but Poorly Rated Among various satisfaction attributes measured in the Retail sector, ‘Return and exchange policies’ was rated most poorly by local respondents of the Department Stores, Supermarkets, and e- Commerce sub-sectors; the ‘Return and exchange policies’ attribute has a statistically significant impact on Perceived Quality across these three sub-sectors. Segmenting these customers, analysis revealed that respondents who were not satisfied (i.e., Rated 1 to 5) with the retailer’s ‘Return and exchange policies’ gave an average CSISG score of 32.8 points. In comparison, respondents who were satisfied (i.e., Rated 6 to 10) Figure 2: Customers’ respective CSISG with the retailer’s ‘Return and exchange policies’ gave an average and Loyalty scores, when segmented by CSISG score of 73.2 points. In addition, their Customer Loyalty their satisfaction with the Retailer’s Return score was 27.9 points compared to 72.6 points, respectively. These & Exchange Policies. differences were statistically significant. This is illustrated Figure 2. Retailers that have robust Return and Exchange Policies that meet their customers’ expectations can reduce the perceived risk of purchase and use this attribute as a source of competitive advantage. Omni-channel Shoppers have More Customer Loyalty than E-commerce Shoppers Comparing brick-and-mortar retailers with e-commerce retailers, it was noted that respondents who shopped only at physical stores had similar levels of loyalty to e-commerce respondents. However, for the Department Stores and Supermarket sub- sectors, it was observed that omni-channel respondents (i.e., customers who shopped at both the physical store and the online channel) of these brick-and-mortar retailers were significantly more loyal than e-Commerce customers. Their respective loyalty levels are illustrated in Figure 3. Consistent with the findings from the previous year, omni- channel customers of traditional retailers tend to be more loyal Figure 3: Supermarket and department store than e-Commerce customers. This suggests that providing an omni-channel customers had significantly omni-channel platform continues to be a source of competitive higher loyalty scores when compared to e- advantage against competition from e-Commerce players. commerce customers. Traditional retailers may wish to consider how best to leverage digital channels to better serve and retain customers.
Price and Loyalty Programme Top 2 Reasons to Consider for Customers Switching Telcos

Info-Communications respondents were asked about
their intention to switch providers once their current
contracts were up. Of these respondents, 7.6% said
they would consider switching, while 92.4% did not.
Respondents who said that they would consider
switching were associated with significantly lower
levels of Customer Satisfaction (50.3-points vs. 71.0-
points) and Customer Loyalty (46.2-points vs. 71.6-
points). In addition, they also exhibited markedly
higher complaint rates (27.9% vs. 3.2%) compared to
respondents who were not considering a switch.

Further analysis revealed that pricing, loyalty &
rewards programmes, and subscription plans, in that       Figure 4: Main reason to consider when switching
order, were some of the key reasons these customers       telcos, given by Info-comm respondents with an intent
                                                          to switch telcos when their contract is up. Arranged in
were considering when switching providers; this is
                                                          descending order of proportion.
illustrated in Figure 4. The majority (i.e., 54.1%) of
these customers tend to be those who had been with
the telco for ≤4 years.

Given the competitive landscape, telcos should pay close attention to this group of customers given
their greater likelihood to switch to another provider.

Info-Comm Customers that Use Online Touchpoints Generally More Satisfied and Loyal

Within the Info-Communications sector, Mobile
Telecom, Broadband, and PayTV customers that had
recently interacted with their telco through online
touchpoints, i.e., the website or mobile app, had
higher CSISG and Loyalty scores, compared to
customers that did not use these online channels.

As illustrated in Figure 5, better satisfaction and
loyalty levels were observed in customer segments that
had some online interactions, as opposed to the
segments that interacted via other means only (E.g., at
the store or via phone).

                                                          Figure 5: Proportion of Info-comm sub-sector
                                                          respondents that did/did not interacted with online
                                                          touchpoints, and their respective CSISG/Loyalty scores. A
                                                          RED/GREEN pair of scores denotes a statistically
                                                          significant difference.
CSISG BACKGROUND CSISG scores are generated based on the econometric modelling of survey data collected from end-users after the consumption of products and services. Company scores are weighted based on a separately-conducted incidence study. This incidence study determines each company’s sample profile and the local-tourist weights. Sub-sector scores are derived as a weighted average of company scores, in proportion to the local and tourist incidence interactions with the constituent companies. Sector scores are derived by aggregating the sub-sector scores proportionately to each sub-sector’s revenue contributions. Finally, the national score is weighted according to each sector’s contribution to GDP. CSISG scores customer satisfaction on a scale of 0 to 100 with higher scores representing better performance. Under a quarterly measure-and-release system, distinct sectors are measured each quarter with their results released the following quarter. Companies in the Retail and Info-Communications sectors were measured in the first quarter, the Air Transport and Land Transport sectors in the second quarter, the Food & Beverage and Tourism sectors in the third quarter, and finally the companies of Finance & Insurance and Healthcare sectors in the fourth quarter. The national score for 2018 would then be computed using the data collected over these four quarters. For the first quarter of 2018, results for the Retail and Info-Communications sectors were collected and analysed. The former comprises of the Department Stores, e-Commerce, Fashion Apparels, and Supermarkets sub-sectors. The latter consists of the Broadband, Mobile Telecoms, Pay TV, and Wireless@SG sub-sectors. CSISG 2018 FIELDWORK PROCESS Survey data for the Retail and Info-Communications sectors was collected between January and April 2018. This was primarily conducted through face-to-face interviews with Singapore residents at their homes. The survey was also conducted with departing tourists at Changi Airport. In all, the Q1 fieldwork garnered 6,090 interviews with locals and 810 with departing tourists at the airport. Together, there were 6,900 unique responses covering 133 distinct entities in the Retail and Info- Communications sectors; 42 entities have published scores.
Contact us

You may contact us for more details of our ISE Corporate Membership and Custom Research.

Institute of Service Excellence
Singapore Management University
81 Victoria Street
Administration Building
Singapore 188065
Tel: +65 6828 0111
Fax: +65 6828 0690
ise@smu.edu.sg

ise.smu.edu.sg
You can also read