CUSTOMER SATISFACTION INDEX OF SINGAPORE 2018 - Q2 RESULTS OVERVIEW AIR TRANSPORT AND LAND TRANSPORT - Institute of Service ...
←
→
Page content transcription
If your browser does not render page correctly, please read the page content below

CUSTOMER SATISFACTION INDEX
OF SINGAPORE 2018

Q2 RESULTS OVERVIEW
AIR TRANSPORT AND LAND TRANSPORT
2018 Q2 SCORES
                                    AIR TRANSPORT AND LAND TRANSPORT

        75.4 Air Transport                                 73.1   Budget Airlines                           68.0 Transport Booking Apps
                                                           75.3   Scoot                                     68.8 ComfortDelGro
        78.0 Airport*                                      72.4   Jetstar Asia                              67.5 Grab
        78.0 Changi Airport                                72.2   AirAsia
                                                           69.9   Lion Air                                  65.6   Public Buses
        74.5   Full Service Airlines                       70.5   Other budget airlines                     67.3   SMRT
        78.1   Singapore Airlines*                                                                          65.2   SBS Transit
        76.4   Garuda Indonesia*                           67.8 Land Transport                              63.4   Other bus operators
        75.6   Emirates
        74.7   Cathay Pacific                              72.5   Taxi Services*                            63.6 Mass Rapid Transit System
        73.9   Qantas                                      74.0   Transcab                                  63.9 SBS Transit
        73.1   SilkAir                                     73.8   Premier                                   63.4 SMRT
        71.6   Other full service airlines                 72.3   ComfortDelGro
                                                           72.1   SMRT
                                                           70.0   Prime

This chart summarises the results of the CSISG 2018 satisfaction            The sparklines indicate the satisfaction score of their respective
scores in the Air Transport and Land Transport sectors at the sector,       sectors, sub-sectors and companies over the past few years.
sub-sector and company levels.
                                                                                    statistically significant increase in customer satisfaction
The sector scores (in gold) represents a weighted average of their                  from 2017 to 2018
respective sub-sector scores (in blue). Satisfaction scores for sub-
                                                                                    statistically significant decrease in customer satisfaction
sectors with individual company scores are weighted averages of
                                                                                    from 2017 to 2018
these individual company scores.
All scores displayed are accurate to one-decimal place. Entities are                no significant year-on-year change in customer
presented in decreasing levels of satisfaction.                                     satisfaction score

* Companies indicated with an asterisk(*) are companies that have
  performed significantly above their sub-sector average.
* Sub-sectors indicated with an asterisk(*) are sub-sectors that
  have performed significantly above their sector average.
CSISG 2018 SECOND QUARTER RESULTS OVERVIEW
The Customer Satisfaction Index of Singapore (CSISG) computes customer satisfaction scores at the national, sector, sub-sector, and
company levels. The CSISG serves as a quantitative benchmark of the quality of goods and services produced by the Singapore
economy over time and across countries. This is the CSISG’s 12th year of measurement.
SECOND QUARTER RESULTS HIGHLIGHTS
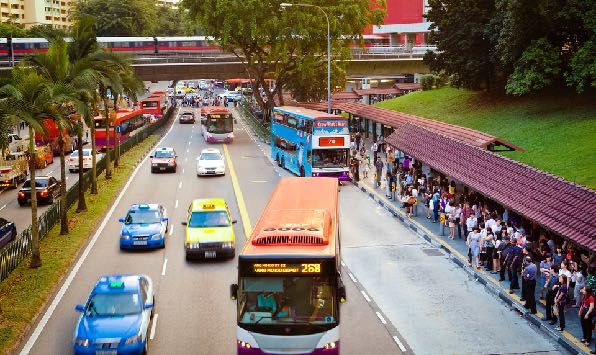
The Land Transport sector scored 67.8 points (on a scale of 0 to 100), unchanged from the previous year. On the other hand, the Air
Transport sector scored 75.4 points, a significant* 1.4% improvement over last year.
The Land Transport sector is made up of four sub-sectors,
namely Mass Rapid Transit (MRT) System, Public Buses, Taxi
Services, and Transport Booking Apps.
The Public Buses and Taxi Services sub-sectors recorded
higher CSISG scores year-on-year, at 65.6 points and 72.5
points, respectively. The MRT System and Transport Booking
Apps sub-sectors recorded lower scores year-on-year, at 63.6
points and 68.0 points, respectively. However, these changes
were not statistically significant.
Notably, this is the first time since CSISG tracking began in
2007 that customer satisfaction with Public Buses
outperformed the MRT system with statistical significance.
Within the Air Transport sector, three sub-sectors were Figure 1A: CSISG Land Transport sector/sub-sector
measured: Airport, Budget Airlines, and Full Service Airlines. performance for 2017 and 2018. Year-on-year changes
were not statistically significant.
While the Airport and Full Service Airlines sub-sectors
performed similarly to last year, scoring 78.0 points and 74.5
points respectively, the Budget Airlines sub-sector improved
significantly, scoring 73.1 points, a 2.7% increase year-on-
year.
These movements are illustrated in Figures 1A and 1B.
Figure 1B: CSISG Air Transport sector/sub-sector
performance for 2017 and 2018. The green arrowheads
denote a statistically significant increase in the CSISG score
compared to 2017.
*Statistical significance for the CSISG study is measured at a confidence interval of 90%.SECOND QUARTER KEY FINDINGS
Rising Proportion of Local Commuters with Fares a Significant Driver of Perceived Quality for
Poor Perceptions of the Train Operator & Low Taxi Services and Transport Booking Apps
Satisfaction with Government Intervention in
The consolidation of Transport Booking Apps and the larger
Public Transportation private hire car industry over the past year has resulted in a
measurable decrease in two fare-related attributes. “Fares
Among local commuters surveyed for the MRT System sub- charged” and “Attractiveness of app promotions and
sector, it was observed that CSISG performance was closely discounts” recorded significantly lower satisfaction with
associated with commuters’ “Satisfaction with government customers, falling 7.7% and 17.1%, respectively.
intervention” and “Trust that the operator was working in their
best interests”. Looking at both the Taxi Services and Transport Booking Apps
sub-sectors, analysis revealed “Fares Charged” as the attribute
As illustrated in Figure 2A, train commuters that rated both with the largest impact on local customers’ Perceived Quality.
these metrics 6 and above (on a 1 to 10 scale), i.e., they were The five most important attributes for driving quality for each
satisfied with government intervention and trusted the operator sub-sector is illustrated in Figure 3.
to be working in their interest, had an average CSISG score of
67.1 points. Conversely, when they gave ratings of 5 and below Point-to-point transport companies may wish to consider how
for these two metrics, their CSISG score was 29.6 points. A to better manage these areas.
similar observation was seen with Public Bus commuters.
Figure 2A: Proportion of Local respondents, and their
corresponding CSISG scores, that were Satisfied (Rated 6-10)/
Not Satisfied (Rated 1-5) with government intervention and
Trusted (Rated 6-10)/Did Not Trust (Rated 1-5) that the Figure 3: Top five drivers of Perceived Quality for the Taxi
operator was working in their best interests. Services (Locals) and Transport Booking Apps sub-sector,
respectively.
Of concern was the increasing proportion of local train
commuters that fell into this latter group, i.e., low ratings for
“Satisfaction with government intervention” and “Trust that
the operator was working in their best interests”. The
proportion rose from 9.5% in 2016 to 15.9% in 2018, as
illustrated in Figure 2B.
Figure 2B: Rising Proportion of Local Train respondents that
were Not Satisfied with government intervention and Did Not
Trust that the operator was working in their best interests (i.e.,
Rated 1 to 5 for both metrics).
*Statistical significance for the CSISG study is measured at a confidence interval of 90%.Narrowing Satisfaction Performance Between Full CSISG BACKGROUND
Service and Budget Airlines
CSISG scores are generated based on the econometric
The Budget Airlines sub-sector recorded its third consecutive modelling of survey data collected from end-users after the
annual increase in CSISG score. Compared to Full Service consumption of products and services.
Airlines, which saw relatively more modest improvements in
scores, the difference in satisfaction levels between the two Company scores are weighted based on a separate incidence
sub-sectors has been narrowing. This is illustrated in Figure study. This incidence study helps determine each company’s
4A. sample profile and the local-tourist weights. Sub-sector scores
are derived as a weighted average of company scores, in
proportion to the local and tourist incidence interactions with
the constituent companies. Sector scores are derived by
aggregating the sub-sector scores proportionately to each sub-
sector’s revenue contributions. Finally, the national score is
weighted according to each sector’s contribution to GDP.
CSISG scores customer satisfaction on a scale of 0 to 100
with higher scores representing better performance.
Under a quarterly measure-and-release system, distinct
industry sectors measured within each calendar quarter have
their results released the following quarter. Companies in the
Retail and Info-Communications sectors were measured in the
first quarter, Air Transport and Land Transport in this second
quarter, Food & Beverage and Tourism sectors in the third
quarter, and finally the companies of Finance & Insurance and
Figure 4A: CSISG 2014-2018 performance for the Full Healthcare sectors, in the fourth quarter. The national score for
Service and Budget Airlines sub-sectors. The green arrows 2018 will then be computed using the data collected over
indicate a significant year-on-year improvement. these four quarters.
For this second quarter of 2018, the Air Transport sector
comprised of the Full Service Airlines, Budget Airlines, and
Furthermore, as illustrated in Figure 4B, for the first time in Airport sub-sectors. The Land Transport sector comprised of
five years, Budget Airline customers’ rating for “Likelihood to the Public Buses, MRT/LRT, Taxi Services, and Transport
Repurchase”, i.e., their propensity to fly with the airline again, Booking Apps sub-sectors.
surpassed that of Full Service Airline customers.
CSISG 2018 FIELDWORK PROCESS
Survey data was collected between April and July of 2018.
Responses were collected via face-to-face interviews with
Singapore residents at their homes and departing tourists and
transit passengers at Changi Airport.
The Q2 fieldwork garnered 3,539 face-to-face interviews with
locals and 2,710 with tourists and transit passengers at the
airport.
In total, there were 6,249 unique responses covering 60
companies and entities in the Air Transport and Land Transport
sectors; 25 entities have published scores.
Figure 4B: Ratings for Repurchase Intentions 2014-2018,
for Full Service and Budget Airlines sub-sectors.
This may suggest travellers could potentially substitute Full
Service Airlines’ services with lower priced alternatives, i.e.,
Budget Airlines.
The Full Service Airlines sub-sector could address the decline
in Repurchase Intentions by exploring ways to create wider
differentiation in their service offerings.
*Statistical significance for the CSISG study is measured at a confidence interval of 90%.Contact us
You may contact us for more details of our ISE Corporate Membership and Custom Research.
Institute of Service Excellence
Singapore Management University
81 Victoria Street Tel: +65 6828 0111
Administration Building Fax: +65 6828 0690
Singapore 188065 ise@smu.edu.sg
ise.smu.edu.sg
*Statistical significance for the CSISG study is measured at a confidence interval of 90%.You can also read