Earnings Presentation - Q1 2020 www.savola.com - AWS
←
→
Page content transcription
If your browser does not render page correctly, please read the page content below
Earnings Presentation
Q1 2020
                        www.savola.com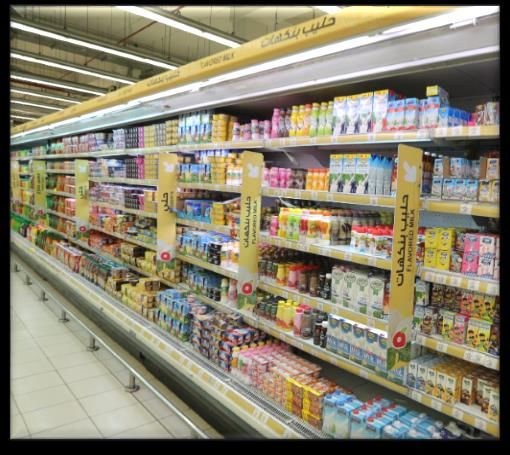
DISCLAIMER

  This presentation might contain forward-looking statements which may be identified by the use of words like
  “plans,” “expects,” “will,” “anticipates,” “believes,” “intends,” “projects,” “estimates” or other words of similar
  meaning. All statements that address expectations or projections about the future, including, but not limited to,
  statements about the strategy for growth, market position, expenditures, and financial results, are forward looking
  statements.
  Forward-looking statements are based on certain assumptions and expectations of future events. The Savola
  Group (Savola or Group), its subsidiaries and its affiliates (the “Companies”) referred to in this presentation cannot
  guarantee that these assumptions and expectations are accurate or will be realized. The actual results,
  performance or achievements of the Companies, could thus differ materially from those projected in any such
  forward-looking statements. The Companies assume no responsibility to publicly amend, modify or revise any
  forward looking statements, on the basis of any subsequent developments, information or events, or otherwise.

  Information contained in this presentation is subject to change without further notice, its accuracy is not
  guaranteed, and it may not contain all material information concerning The Savola Group and its affiliates. We do
  not make any representation regarding, and assume no responsibility or liability for the accuracy or completeness
  of, or any errors or omissions in, to any information contained herein.

                                                                                                                           2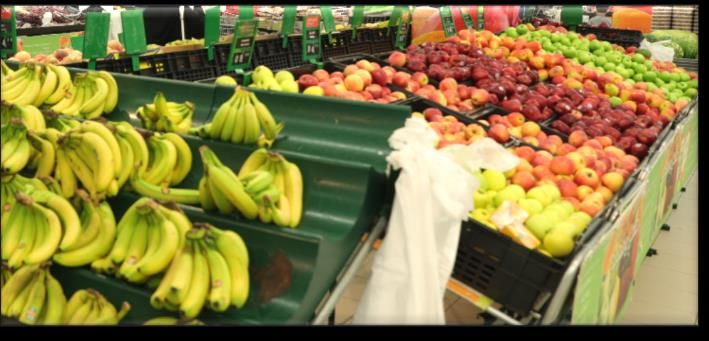
COVID-19 Update
            The Group and its subsidiaries have navigated this crisis well with a commitment to ensure safety
            to all of its stakeholders and to minimize product disruptions in the markets we operate in

 • Savola Group is largely in the food processing and grocery retail space, hence most of our businesses have continued to operate in these
   circumstances and we do not foresee negative material impact in the interim, barring further developments, with the exception to the food
   services segment which have been affected negatively due to curfew and other measures
 • Well stocked inventories and high operational excellence prior and during the crisis has enabled us to maintain business continuity. Our
   supply chain across both food and retail operations are well managed to serve the increased demand for food products
 • We, together with our subsidiaries continue to be proactive to address and mitigate any potential challenges through activated crisis
   management protocols to deal with the current pandemic:
       o   Panda Retail crisis management taskforce continues to ensure health and safety protection of staff and customers at its retail locations
           in addition to increased supply chain activities to ensure no stock outs at any of its locations
       o   Savola Foods implemented specific measures in various countries to ensure safety and wellbeing of its staff and focused approach
           related to strategic sourcing to increase oil shipment volumes wherever possible and as needed
       o   Al Kabeer has implemented a wide range of preventative measures to ensure production facilities continue normal operations, as well
           as, increase buffer stocks of raw material inventory to cater for the high demand
       o   We, as a group, continue to actively monitor the situation and apply preventative measures to ensure continuing operations while
           maintaining the health of our staff and customers across all of our subsidiaries

                                                                                                                                                      3
SNAPSHOT
                                                                  Q1 2020

              •   Q1 2020 Revenue of SAR 6.1 bn (Q1 2019: SAR 5.4 bn)
  GROUP       •   Q1 2020 Net Income of SAR 172.8 mn (Q1 2019: SAR 6.3 mn)

              •   Q1 2020 Revenue of SAR 3.3 bn (Q1 2019: SAR 2.7 bn)
  RETAIL
              •   Q1 2020 Net Income of SAR 10.8 mn (Q1 2019: Net Loss of SAR 192.7 mn)

              •   Q1 2020 Revenue of SAR 2.5 bn (Q1 2019: SAR 2.4 bn)
  FOODS       •   Q1 2020 Net Income of SAR 73.2 mn (Q1 2019: SAR 112.4 mn)

              •   Q1 2020 Revenue of SAR 296.9 mn (Q1 2019: SAR 313.4 mn)
  HERFY
              •   Q1 2020 Net Income of SAR 25.1 mn (Q1 2019: SAR 48.1 mn)

              •   Q1 2020 Revenue of SAR 191.8 mn (Q1 2019: SAR 128.9 mn)
FROZEN FOOD
              •   Q1 2020 Net Income of SAR 20.2 mn (Q1 2019: SAR 18.0 mn)

INVESTMENTS   •   Share of Almarai Net Income of SAR 132.2 mn in Q1 2020 (Q1 2019: SAR 116.0 mn)

                                                                                                   4
GROUP – CONSOLIDATED FINANCIAL HIGHLIGHTS
                                                                                         Margin

 SAR in millions            Q1-19           Q1-20                  Q1-19         Q1-20

                                    14%
                                     -2%

                                                                           15%
                                                                           -2%

         Sales              5,388          6,120    Gross Profit   1,065         1,223

                                                                   19.8%         20.0%

                                    37%
                                     -2%

       EBITDA                              693      Net Income
                            505                                                   173
                                                                     6
                            9.4%           11.3%                   0.1%          2.8%

Note: numbers are rounded
                                                                                                  5
GROUP – REVENUE MIX, NET DEBT & CAPEX

 SAR in millions                                     Revenue by Business                                                                           Revenue by Geography

                                           Q1-19                                       Q1-20                                             Q1-19                                Q1-20

                                          6%                                         5%
                                            2%                                        2%                                             5% 10%                            5% 10%
                                                       44%                                          40%                             9%                               10%

                                  48%                                         53%
                                                                                                                                               75%                                75%

                                 Food Processing           Retail         Food Services            Frozen Food                           KSA         Egypt     Central Asia     Others

                                    Net Debt and Net Debt to Liquid Assets (%)*                                                                              CAPEX

                                           Q1-19                                       Q1-20                                             Q1-19                                Q1-20

                                                                -18%                                                                                         20%
                                                 7,309
                                                                                   6,007

          Net Debt to Liquid Assets (%)          35%                                                                                                                      84
                                                                                    34%                                                       70
          Net Debt

*Net debt excludes lease liabilities, liquid assets refers to the market value of Savola Group’s investment in Almarai and Herfy.
 Note: Numbers are rounded                                                                                                                                                               6
SAR in millions

                                           Q1 2019

Note: Numbers are rounded
                                                                                            505
                                   Reported EBITDA

                                     Store Closure &

                                                                                              35
                                    Project Write-off
                                                                                                                 Q1-19

                                  IFRS16 Net Impact

                                                                      (168)
                                            Q1 2019
                                    Adjusted EBITDA                           372

                                           Q1 2020
                                                                                                     693
                                                                                                                         Adjusted EBITDA

                                   Reported EBITDA

                                  IFRS16 Net Impact
                                                                                    (173)
                                                                                                                 Q1-20

                            Q1 2020 Adjusted EBITDA
                                                                                            520
                                                                                                                                               IMPLICATIONS OF EXCEPTIONAL ITEMS

                                        Q1 2019
                                                            6

                                     Reported NI

                                  Store Closure &
                                                                 34

                                 Project Write-off

                              Reversal of Accruals
                                                     (41)
                                                                                                                 Q1-19

                                                                29

                               IFRS16 Net Impact

                                         Q1 2019
                                                                29

                                      Adjusted NI
                                                                                                                         Adjusted Net Income

                                        Q1 2020
                                                                                                   173

                                     Reported NI
                                                                                                           22

                               IFRS16 Net Impact
                                                                                                                 Q1-20

                                         Q1 2020
                                                                                                           194

                                      Adjusted NI
7
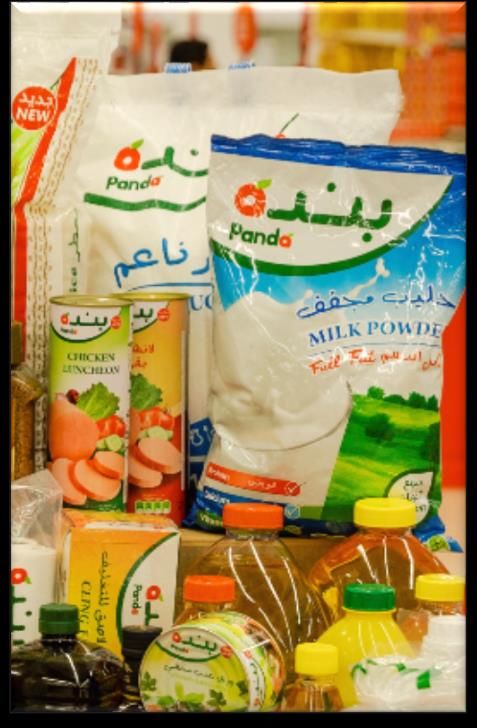
PANDA RETAIL COMPANY
Q1 2020

                       8
RETAIL - HIGHLIGHTS

                        • The performance of our retail business has significantly improved during the quarter,,
                          with strong top-line growth driven by higher customer demand for groceries
       Key Highlights
                        • Panda launched its online channel, Pandaclick, through rebranding an existing platform
                          and scaled it up using Panda’s scale and breadth of operations

                        • Store count remained at 205 stores by end of Q1, including 4 stores in Egypt
        Store Count     • As part of our ongoing footprint optimization, we continue to evaluate our locations and
                          sizes on a proactive basis and we have optimized the size of some existing stores

                        • Panda Retail recorded Revenues of SAR 3.3 bn in Q1 2020, an YoY growth of 23.4%;
                          despite a ~6% YoY reduction in selling space vis-à-vis same quarter last year
         Revenues
                        • The growth is mainly driven by high like-for-like growth in customer count and basket size
                          due to bulk buying observed in different grocery categories

                        • In Q1 2020, Panda Retail reported EBITDA of SAR 240.5 mn
        Profitability   • Net income improved to SAR 10.8 mn driven by topline growth and improvement in gross
                          margins

                                                                                                                       9
RETAIL – FINANCIAL HIGHLIGHTS
                                                                                                                                                                               Margin

  SAR in millions                              Q1-19                               Q1-20                                     Q1-19                          Q1-20

                                                                  23%
                                                                   -2%

                                                                                                                                               27%
                                                                                                                                               -2%

          Sales                                                                 3,296                 Gross Profit
                                               2,671                                                                                                        705
                                                                                                                             557

                                                                                                                             20.8%                          21.4%

                                                        265%
                                                          +265%

                                                                                                                                                     11             36
        EBITDA                                                           240                          Net Income     (193)
                                                                                                                                    (132)
                                         66                                                117
                                                         (26)

                                        2.5%              NA              7.3%              3.6%                     NA              NA              0.3%           1.1%

                                                        Q1-19                               Q1-20                                    Q1-19                          Q1-20
                                                      Adjusted*                           Adjusted*                                Adjusted*                      Adjusted*
                                                       EBITDA                              EBITDA                                   Net Loss                      Net Income
Note: numbers are rounded
                                                                                                                                                                                        10
*Adjusted numbers include adjustments for IFRS16, store closures and project write offs
RETAIL – NUMBER OF STORES BY QUARTER
Super Hyper
145 145 60 60
Dec Additions Closures Mar Dec Additions Closures Mar
2019 2020 2019 2020
Total
Dec-19 Mar-20
Selling Area 205 205 Selling Area
634,399 m2 628,578 m2
Dec Additions Closures Mar
2019 2020
Note: Decline in selling space during the period is driven by resizing a number of our existing stores
11SAVOLA FOODS COMPANY
Q1 2020
12FOODS - HIGHLIGHTS
• The performance of our foods segment, improved over last year, following increased
Key Highlights
demand for food staples including edible oils and pasta
• Volume has increased by 9.8% to 888 KMT in Q1 2020, driven primarily by a >15%
Volume growth in edible oils and ~12% growth in pasta
• Sugar volumes increased by 2.5% to 346 KMT in Q1 2020
• Q1 2020 revenues are 2.8% higher than last year reaching SAR 2.5 bn primarily due to
Revenues growth in edible oils and pasta by ~10% and ~17%, respectively
• Sugar revenues declined 13.6% compared to last year, mainly due to lower sugar prices
• EBITDA improved to SAR 220.7 mn in Q1 2020 compared to SAR 207.0 mn last year
Profitability • Q1 2020 Net Income is SAR 73.2 mn, compared to SAR 112.4 mn last year (including
one-off of SAR >40 mn reversal of accruals last year)
13FOODS – FINANCIAL HIGHLIGHTS
Margin
SAR in millions Q1-19 Q1-20 Q1-19 Q1-20
3% -2%
2%
-2%
Sales 2,408 2,476 Gross Profit 367 375
15.2% 15.2%
7%
-2%
-35%
-2%
EBITDA 207 221 Net Income
112
70 73
8.6% 8.9% 4.7% 2.9% 3.0%
Q1-19
Adjusted*
Net Income
Note: numbers are rounded
14
*2019 Adjusted numbers include adjustment for reversal of accrualsFOODS – OIL SEGMENT ANALYSIS
SAR in millions Volume (MT ‘000) Revenues
YTD-19 YTD-20 YTD-19 YTD-20
15%
+15%
10%
+9.6%
Morocco 448 1,654 Morocco
YoY +7% 5% 6% YoY +9%
1,509
Sudan 5% 4% Sudan
388 6%
YoY +60% YoY +39%
6% 12% 3% 11%
Algeria 3% Algeria
11%
YoY +21% YoY +13%
11% 10% 12%
Turkey Turkey
13%
YoY +11% 10% YoY +8%
Central Asia 17% Central Asia
YoY +29% 27% 18% YoY +5%
Egypt 24% Egypt
YoY +17% YoY +36%
KSA 17% 21% KSA
YoY -2% 18% 19% YoY -5%
32% 28%
27% 23%
Note: The above includes net distribution volume and excludes specialty fat business that used to be combined with the edible oil category and is now part of the emerging categories shown in slide 21
15FOODS – SUGAR SEGMENT ANALYSIS
SAR in millions Volume (MT ‘000) Revenues
YTD-19 YTD-20 YTD-19 YTD-20
2%
+2%
-14%
-13.6%
346 712
338
Egypt 9% Egypt
11%
YoY -20% 12% YoY -23%
615
KSA KSA
YoY +6% 10% YoY -12%
91% 89%
88%
90%
Note: Sugar volumes and revenues include only the contribution from our consolidated sugar operations (USC and ASC), and include the net volume and revenue from our KSA sugar distribution operations
16Al Kabeer
Q1 2020
17FROZEN FOOD - HIGHLIGHTS
• Consumers increased demand for longer life products and food stocking behavior due
to lock down measures has positively contributed to our frozen food segment
Key Highlights
• Al Kabeer started the year with strong growth driven by management efforts and
growth in the category; the company witnessed significant growth in March
• Revenues increased by ~49% reaching SAR 191.8 mn in Q1 2020 compared to SAR
Revenues 128.9 mn last year, largely driven by ~50.0% increase in Saudi Arabia, as well as,
increases across the lower gulf during the quarter.
• In Q1 2020, gross profits increased by ~37.5% compared to last year, reaching SAR
66.2 mn from SAR 48.1 mn last year.
• Q1 2020 EBITDA and net income were about ~ 12.0% higher than last year, reaching
Profitability SAR 26.1 mn and SAR 20.2 mn, respectively.
• The decrease in margins were primarily driven by higher raw material prices, larger
share of sales coming in from modern trade and an increase in operating expenses
18FROZEN FOOD – AL KABEER
Margin
SAR in millions Q1-19 Q1-20 Q1-19 Q1-20
49%
-2%
38%
-2%
192
Sales 129 Gross Profit 66
48
37.3% 34.5%
12%
-2%
12%
-2%
EBITDA 23 26 Net Income 18 20
18.0% 13.6% 14.0% 10.5%
Note: numbers are rounded
19FINANCIAL SUMMARY
20FINANCIALS – Q1 2020
(all figures are in SAR millions)
Segment Wise Financials
YTD March 2020 YTD March 2019
Revenue Gross Profit EBIT Net Income EBITDA Revenue Gross Profit EBIT Net Income EBITDA
Food*
Oil-Mature Markets 1,305 242 126 78 146 1,209 226 96 95 118
Oil-Start-up Markets** 349 34 15 8 18 300 33 19 11 22
Total Oil 1,654 276 141 86 165 1,509 259 115 107 140
Sugar 615 67 21 (12) 41 712 92 42 17 62
Pasta 155 29 10 6 14 132 14 2 (2) 6
Emerging Categories*** 51 3 (4) (6) 1 55 2 (5) (9) (1)
Total Foods 2,476 375 168 73 221 2,408 367 154 112 207
Retail
KSA 3,267 700 72 14 239 2,650 553 (124) (191) 65
Egypt 29 5 (3) (3) 2 21 4 (3) (2) 0
Total Retail 3,296 705 69 11 240 2,671 557 (128) (193) 66
Herfy 297 77 35 25 78 313 94 59 48 99
Frozen Food 192 66 21 20 26 129 48 20 18 23
Real Estate - - 3 3 3 - - 4 4 4
Al Marai-Savola Share - - 132 132 132 - - 116 116 116
HQ/Elimination/Impairments (140) (0) (20) (92) (8) (133) (0) (20) (99) (10)
Total 6,120 1,223 408 173 693 5,388 1,065 206 6 505
Adjustments
Store Closure and Project Write-off - 34
Reversals of Accrual - (41)
Net Impact of IFRS16 22 29
Adjusted Profit 194 29
* All the numbers are rounded for the purpose of presentation and have been represented under different categories
** Start-up markets include Algeria, Morocco and Sudan
*** Includes specialty fats, seafood, croissant...etc.
21You can also read