Cycling Cities A Policy Brief from the Policy Learning Platform on Low-carbon economy - Interreg Europe
←
→
Page content transcription
If your browser does not render page correctly, please read the page content below

Cycling Cities
A Policy Brief from the Policy Learning Platform on
Low-carbon economy
                                         JUNE 2020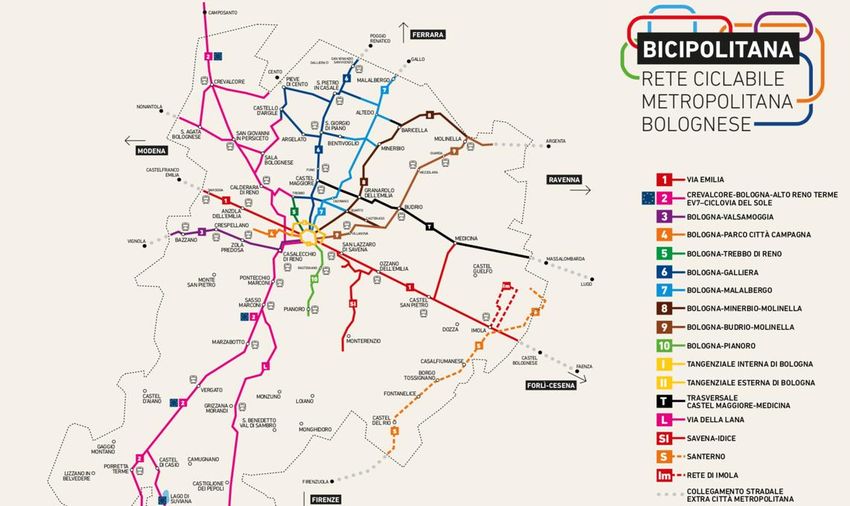
Policy Learning Platform on Low-carbon economy

Table of contents

Summary ............................................................................................................................... 3
The multiple virtues of cycling................................................................................................ 3
Cycling facts and figures ....................................................................................................... 4
Barriers and motivators for citizens to take to cycling ............................................................ 5
Barriers for cities in promoting cycling ................................................................................... 6
Getting the city ready for bikes .............................................................................................. 6
   Strategic planning for cycling ............................................................................................. 6
   Infrastructure for safe cycling, links to other transport modes and safe parking .................. 8
Getting people ready to bike (more) .....................................................................................10
   Education: how to cycle? ..................................................................................................11
   Behaviour change: getting people to pick up the bike more and more ..............................11
Data collection and monitoring .............................................................................................13
Future trends & Cycling and Covid-19 ..................................................................................14
European support for cycling ................................................................................................15
Key learnings & recommendations .......................................................................................17
Sources and further reading .................................................................................................18

Policy brief: Cycling Cities                                        2
Policy Learning Platform on Low-carbon economy

Summary

Cycling has many socio-economic, health and environmental benefits that its promotion should be
a logical policy choice. And while most cities are choking under ever-increasing motor traffic, more
and more policy makers wish they could turn their city into a ‘Cycling City’. This policy brief helps
turn these dreams into reality with good practices, guidance and recommendations backed by real-
life examples from European cities and regions.

It is common knowledge that countries like Denmark and the Netherlands are cycling leaders in
Europe, and it would be easy to fill this policy brief with examples and good practices from these
two front-runner countries alone. However, excellence, especially when it is too far from one’s own
reality, can be discouraging and hard to relate to, and while it is always a joy to look at the next
great project to support biking in Copenhagen or Amsterdam, the authors have decided to focus
on good practices from regions and cities that are catching up, to show that it is very much possible
today to set the goal of becoming a Cycling City within the next decade, and achieve this with
concrete steps and visible impacts even in the short term of one political mandate.

The multiple virtues of cycling

Cycling is a form of activity and a means of transport that offers multiple benefits not only to those
engaged in the activity but also to the wider public. For the cyclist, it is a convenient, low-cost,
individual means of transport with significant health benefits that works very well for short-to-
medium length trips, including last-mile solutions. For the general public, when compared to cars,
cycling reduces the carbon footprint of mobility, does not emit any health-endangering particles, is
silent, reduces road congestion and requires much less road and parking space.

A 2013 study of the European Cyclists’ Federation (ECF) quantified the following cycling benefits:
health improvements; congestion-easing; fuel savings; and reduced CO2 emissions; air
pollution, and noise pollution. The six categories’ combined benefits were valued at 143.2–
155.3bn EUR.

The largest single benefit of cycling is on the health side. It is noteworthy that poor air quality is a
major environmental health concern estimated to take an annual toll of 400,000 premature death
in the EU. Twenty-three Member States exceed their air pollution limits, and the 5 largest EU
countries risk being taken to court for repeated breaches of their NOx limits.

In addition, the study found that two sectors specifically benefit from cycling: the tourism industry
(due to recreational and tourism cycling), as well as the bicycle industry (retail and employment
effects in manufacturing industry), and it estimated the benefit in these two categories to about
62bn EUR. Taken together, the study found that that the annual economic benefit of cycling in the
EU-27 amounts to at least 205bn EUR.

The ECF Jobs and Job Creation in the Cycling Economy study from 2014 states that around
655,000 people work in the cycling related sectors in the EU, most of them in cycle tourism. If
cycling’s modal share was doubled, more than 400,000 additional jobs could be created, reaching
a total of more than 1 million jobs in the cycling economy. Of particular interest to mobility policy
makers is the finding that cycling has a higher employment intensity per million EUR of turnover
than other transport sectors, thus offering a higher job creation potential. Furthermore, cycling jobs

Policy brief: Cycling Cities                       3
Policy Learning Platform on Low-carbon economy

are more geographically stable than other sectors, they benefit local economies, and they offer
access to the labour market to lower qualified workers.

Naturally, benefits must be put into relation with costs. A UK Department of Health report found
that that investing in cycling is usually good value for money and had benefit-to-cost ratios of an
impressive 13:11, making cycling-related public investments money extremely well spent.

       Figure 1 – Overview of jobs in the cycling sector in 2014 and with a doubling of modal share2

Cycling facts and figures

Good statistics about cycling are hard to come by, as there is no unified EU methodology to count
cycling, and each local study uses different indicators and different base years, which makes it hard
to compare results. Thus, the ‘modal split’ indicating the share of cycling compared to other modes
of transport in the total traffic volume of a country, region, or city, can only be estimated.

The ECF deducts from different surveys that on a European average, 0.32 bicycle trips are made
per adult person per day and that the average EU modal share for cycling is 8%. This EU average
hides the disparate reality of cycling’s modal share between Northern and Southern Europe,
between cities and urban area and within countries. In a 2014 Eurobarometer, 36% of Dutch
citizens said they predominantly used a bike in their daily routine, whereas Malta, Cyprus and
Portugal had only 0-1% of routine bikers. An OECD report found that in Europe the average cycle
trip distance was around 3 km, and that 30–40% of the distances cycled are related to home-work
trips, with home-leisure trips making up 20–45% of the person-kilometres.

A worrying set of statistics came from the Special Eurobarometer 472: Sport and physical activity
(Feb 2018): Nearly half of Europeans never exercise or play sport, and the proportion has increased
gradually in recent years. While two in five Europeans (40%) exercise or play sport at least once a
week, half of respondents (46%) never exercise or play sport (including cycling). As physical activity
reduces the risk of heart diseases, obesity and cancer, policy makers are increasingly searching
for ways to motivate their population to get into motion.

1
  In comparison, UK government guidance on the evaluation of major projects says that a ‘high’ value-for money project must
have a benefit-to-cost ratio of at least 2.5 http://assets.dft.gov.uk/publications/value-for-money-assessments-
guidance/vfmguidance.pdf
2
  Jobs and Job Creation in the Cycling Economy, Transport & Mobility, 2014

Policy brief: Cycling Cities                                  4
Policy Learning Platform on Low-carbon economy
Barriers and motivators for citizens to take to cycling
Before looking at the barriers it is interesting to take a look at the motivations for cycling. We learn
from a recent survey of the City of Copenhagen that people take the bike mostly because it’s the
fastest and easiest way to move across the city. Notably, people do not cycle because it’s good for
the environment, but because it’s good for them as individuals: faster, easier; healthy, cheap and
convenient. These are the arguments that are likely to have an impact on people.
Figure 2 – Copenhageners’ Reasons for Cycling3
On the other hand, what keeps people from cycling? The ECF4 cites results from a UK poll that
puts perceived danger on the top position among the reasons people are put off by cycling: bad
driving, dangerously designed roads, substandard infrastructure, perception of danger, and lack of
facilities. In last place: weather and hills.
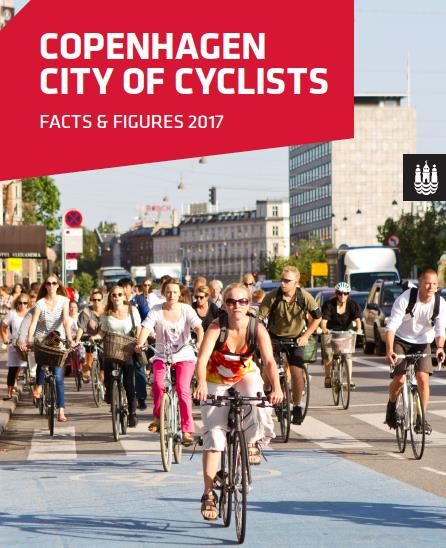
These replies match with the ones given by Copenhageners when asked what could tempt them
to cycle more, as depicted in Figure 3, below. We understand that safely and infrastructure are key.
Figure 3 – What would make Copenhageners cycle more?5
3
Copenhagen City of Cyclists, Facts & Figures 2017
4
SUMP 2.0 –Practitioner briefing: Cycling, ECF, 2019
5
Copenhagen City of Cyclists, Facts & Figures 2017
Policy brief: Cycling Cities 5
Policy Learning Platform on Low-carbon economy

Barriers for cities in promoting cycling

Given the multiple benefits of cycling, and that policy makers do understand them: what might keep
cities from promoting cycling more radically and more widely? This question has led to a case study
in Hamburg6 and better insight into the dilemmas of every-day local policy making.

           “… the major barriers are physical, political and institutional, and social and cultural.
        Specifically, the city lacks enough physical space, political support, and the evaluation of
        travel behavior and demand. Also, some private stakeholders are reluctant to give up on-
       street car parking space for cycling lanes, and the negotiation process is difficult and time-
                                               consuming.”

To avoid confrontation, but still do something to support cycling, many cities have opted for half-
hearted approaches and quick fixes in recent years, introducing individual measures. Most
prominently (and often with the help of private enterprises) bike-sharing schemes have spread
widely, making bicycles available for a small fee to citizens mainly in city centres. However, single
measures without a coherent strategy and strong political support are usually less effective than a
clearly voiced vision underpinned by a strategic plan over time.

Getting the city ready for bikes

Policy makers in cities with low cycling culture often look at the question of how to increase the
modal share of cycling as a chicken and egg problem and wonder if it’s wise to spend scarce public
money on infrastructures if there is low demand for it anyway. Experience has shown, however,
that it is recommended to start by making the city ready to accommodate a higher share of cyclists
and to work on behaviour change and motivation after that, or in parallel, but not alone.

Strategic planning for cycling

It is important to establish the role of cycling in the overall city mobility strategy. How to do this is
illustrated by a good practice from the Helsinki area that establishes a ‘mobility hierarchy’ similar
to the waste hierarchy. It puts walking on top, followed by cycling and public transport, freight, and
last in line: passenger cars. This hierarchy guides all mobility planning and budgeting decisions.
For cities that have Sustainable Urban Mobility Plans (SUMPs), cycling would be included therein.
A very valuable practitioner briefing on “Supporting and encouraging cycling in sustainable urban
mobility planning” has been published in September 2019 on ELTIS as part of the updated SUMP
guidelines. This 16-page publication is directed to local policy makers and is a good place to start.
Strategic planning also has the positive side-effect of target setting across time horizons. This
creates a vision and a goal which can be worked towards and that can be communicated about.

Another resource for policy makers is the 2017 EU Cycling Strategy. This extensive document
came from a wide stakeholder consultation orchestrated by the ECF and was intended to be
officially adopted by the EC under the previous Commission, which did not happen. Nonetheless,

6
    Barriers to Implementing Pro-Cycling Policies: A Case Study of Hamburg, Luqi Wang, 2018

Policy brief: Cycling Cities                                   6
Policy Learning Platform on Low-carbon economy
the document takes up the main ingredients of a good cycling strategy and is built around four
objectives:
1) Cycling should be an equal partner in the mobility system;
2) Grow cycle use in the EU by 50% on average in 2020-2030;
3) Cut rates for cyclists killed and seriously injured by half (in km cycled) in 2020-2030;
4) Raise EU investment in cycling to 3bn EUR in 2021-27; and 6bn EUR from 2028-2034.
Once cycling has its place among the other modes of transport in a SUMP it is judicious to develop
a proper cycling strategy that fits with the overall mobility strategy, as achieved by the Spanish
regional capital Zaragoza, which has developed its dedicated Bicycle Master Plan (see below).
For such a holistic cycling master plan to come alive, political leadership is essential, and it
should not only come from the city mobility department, but rather benefit from a broad group
including the mayor and the departments of land use, health, environment and finance.
GOOD PRACTICE: Bicycle Master Plan of Zaragoza
The Bicycle Master Plan is a sustainable mobility policy promoting cycling in Zaragoza and its
surroundings. The objectives are to encourage more sustainable mobility in the city and the
use of bicycles as daily transport; to facilitate access to public bicycles to the greatest number
of inhabitants of Zaragoza and regular users of the municipal road network; to guarantee the
safety of cyclists and pedestrians in the spaces shared by them with motor vehicles; and to
educate towards a respectful culture for the use of sustainable transport.
To integrate the bicycle into the urban transport system in a complete way, a coherent action
must be carried out in the areas of engineering (creating an infrastructure network); security
(new systems to prevent bicycle theft); behaviour (defining the rights of all road users); and
evaluation (to analyse the degree of compliance with the established objectives).
Education also has a fundamental role for the integration of cycling as a usual mode of
transport. The use of bicycles causes changes in mobility that must be accepted as something
positive for society, and in this way achieve a cultural change in the vision of urban mobility.
The holistic planning has shown impact: while the average use of bicycles in Spain is 9% of the
population, in Zaragoza it is 19%.
For more information, visit the DEMO-EC website
Policy brief: Cycling Cities 7Policy Learning Platform on Low-carbon economy
Infrastructure for safe cycling, links to other transport modes and safe parking
The expert community is unanimous: the decisive factor for more bicycle use is cycle-friendly
infrastructure.
The design of the cycling road network is a crucial element of the infrastructure planning process.
It is good practice to gather data or user input for the network design, to understand from where to
where people travel and which routes they prefer taking. The planning should also be extended to
the functional area rather than to a single route or street in order to meet the mobility needs of city
dwellers.
This requirement has been successfully addressed in the good practice BICIPOLITANA in the
Italian city of Pesaro: the new bike network has been strategically named similar to the subway
network (metropolitana), and it uses the same logic of coloured lines explained on maps to take
cyclists from A to B on an array of main and secondary bike lanes spanning the whole town.
Other Italian cities are adopting similar approaches, which shows the attraction and replicability of
this good practice, at least at national level. Thus, Bologna has published its own bicipolitana plans
just this April 2020 (see below).
Figure 4 – Cycling city network planned in Bologna7
In the same vein, the city of Tartu has planned its new cycling network as a coherent set of paths
with logical linkages (see good practice below).
7
https://incronaca.unibo.it/archivio/2020/04/29/il-sindaco-vogliamo-ricominciare-bene-non-soltanto-ricominciare
Policy brief: Cycling Cities 8Policy Learning Platform on Low-carbon economy
GOOD PRACTICE: Construction of cycling roads in Tartu
Tartu is a rather compact city territory and most of the destinations are easily accessible by foot
or by bike. Yet, the proportion of cyclists was quite small with 3% of all movements. In order to
increase the proportion of light traffic from everyday movements and to improve connections
between downtown and suburbs (including surrounding municipalities), the city decided to build
new bicycle roads of at least 50-60 km.
The planning of roads was based on the principle that a logical network of bicycle paths would
be created and all the main directions going out of town would be covered. Road design was
also based on the daily routing of people identified through surveys. Along with the creation of
new bike roads, existing roads were also repaired and bicycle traversing opportunities for more
than 100 kilometers on the roads were improved during the project. The total investment
amounted to 10 Mn EUR mostly for construction works. As a result of the project, the share of
cycling in everyday movements has grown by more than 6% and continues to rise.
For more information, visit the OptiTrans Website.
GOOD PRACTICE: Cycle & Ride Infrastructure in Dublin
In order to identify the infrastructure requirements needed to improve modal interchange on the
Luas (Dublin’s Tram Service), Transport Infrastructure Ireland performed an accessibility review,
including a system-wide survey for identifying passenger needs to implement cycling measures.
The resulting infrastructure improvements were based upon passenger needs and feedback,
including a significant increase in bike parking and bike lockers, an additional network of cycle
lanes to link directly to the tram; and improved lighting, CCTV, signage, mapping and covered
shelters for cycle parking
Emphasis was placed on the quality of design and materials in order to convey a sense of
positivity, safety and security. The average cost for infrastructure amounted to 109,000 EUR for
each stop.
The impact shows both bike and tram journeys have significantly increased.
• Improved access to stops with short-cuts and new pedestrian crossings provided direct
access from schools, hospitals and visitor attractions. Tram passenger journeys increased
by 52% to 41.8m in 2018 (27.5m in 2010);
• Cyclists in Dublin have more than doubled since 2011 to 95,000 cyclists daily. Bike
parking, shelters and lockers were located adjacent to stops, to maximise visibility and
promote use. The tram system now has over 700 free bike parking places (an increase of
340) located beside 67% of stops.
For more information, visit the MATCH-UP website
Policy brief: Cycling Cities 9Policy Learning Platform on Low-carbon economy Network coherence does not solely refer to the cycling network as such. Best practice conceives integrated cycling and public transport networks, linking cycling to trains and trams, subways or other urban and peri-urban rail-based transport in view of a multi-modal network design. The MATCH-UP project, which focuses on the optimisation of the places where people change between transport modes and considers to this end four main types of low-carbon means of transport (Walking/cycling; Rail transport; Public transport; Green vehicles), offers many good practices and guidance worth looking into. As logical consequence, bike parking infrastructure should then be built near stations to encourage modal change from one sustainable mode of transport to another. Dublin has expertly addressed this need, first assessing needs via a user survey, then following up with safe bike parks including lighting and surveillance cameras, addressing the lingering problem of bike theft at stations (see good practice on previous page). It is not only the network coherence which is important. The planned routes should then be implemented with infrastructure investments that provide for a safe cycling space with enough distance from cars, on separate bike paths, or with physical separators from fast-moving motor vehicles. Thus, Tartu has followed up on the network planning with significant construction works resulting in over 100 km of new cycling paths. Brussels has simply reallocated one car lane at some of its multi-lane arteries, separated it over night by concrete blocks from the rest of the road, painted it red and made it into a cycling lane (see cover picture). Another measure to increase safe cycling space is the transformation of streets into cycling streets. This measure typically inverts the road use hierarchy and forces cars to slow down to 20km/h and give way to bikes and pedestrians at all times. This works well for traffic-calming, but not for transit roads. To conclude the infrastructure chapter, one should not forget that the bicycles themselves are sometimes considered as part of this when made available through bike-sharing services. Bike- sharing schemes have spread widely in all major cities across Europe, some supported with public funding, some as entirely private enterprises. Where bike sharing stations are located adjacent to train stations or major transportation hubs as in Zaragoza or Brussels, this also strengthens the network coherence and inter-modality. Getting people ready to bike (more) When the city is ready to accommodate cyclists, many will turn naturally to cycling or use their bikes more than previously just because a designated safe space for cycling is available. But a larger part of the population will need to be educated, nudged or incentivised to cycle more, and the section below summarises an array of successful measures that should be seen as complementary to each other. Not all need to be implemented by public bodies, but the role of policy makers and administrations is always to provide the impetus, to show political will and to kick things off. Showing leadership by example is certainly a strong message, and what more powerful picture than seeing the Dutch Prime Minister on his bike going to work? Especially for this part of measures, the enrolment and close cooperation with various stakeholders is important: schools, local cycling associations, employer organisations, and not-for-profits. Policy brief: Cycling Cities 10
Policy Learning Platform on Low-carbon economy

Education: how to cycle?

Nothing is as easy as riding a bicycle? Nonetheless, countries with strong cycling culture offer
training on how to cycle and how to behave on the street as a cyclist. The German Police goes
regularly into schools to teach kids how to cycle and how to be a responsible traffic participant. The
Netherlands have gone even further and organise cycling exams.

    GOOD PRACTICE: Cycling exam - Cycle training in real traffic situation

    Every year, the Safe Traffic organization in the Netherlands (VVN) organizes the Traffic Exam,
    consisting of a practical and a theoretical part. During the practical road exam on the bicycle,
    students are tested to see if they can apply the acquired traffic knowledge in real traffic. The
    traffic exam focuses on basic knowledge and basic skills. The project goal is to increase by
    10% the number of children, aged 8-12, that are allowed by their parents to travel on their own.
    To do this, children aged 8-10 improve their practical cycling skills; children 10-12 gain insight
    in traffic situations, and parents get feedback and gain confidence in their child's bicycle skills.

    The city invests around 5, 000 EUR per year in the measure. The costs of the products for
    implementation (for schools) are 14.60 EUR for a five time exam and diploma, and 3.80 EUR
    per manual and written exam. Exercise exams are available free of charge. Volunteers, parents,
    police, and the VVN all help out. Working together with parents, road safety organizations,
    schools is a key success factor.

                                        For more information, visit the SCHOOL CHANCE website.

Starting such training at school is a smart thing to do as it reaches all children and it reaches them
at an age where they are still open and fast at assimilating new information and skills.

Behaviour change: getting people to pick up the bike more and more

To get people who never cycle or cycle very little to try it, like it and do it more is the rationale for a
host of behaviour change good practices from across European countries with low cycling modal
share. The SCHOOL CHANCE project is dedicated to rooting such good behaviour at school and
has collected many examples worth exploring.

Getting adults who have already more fully developed preferences and habits to give these up for
an alternative is harder, and we notice that such behaviour changing good practices often work
with more or less strong incentives to nudge people into cycling more. In the “Better Without Cars”
Campaign (see page 13), drivers were voluntarily encouraged to leave their cars at home on
Thursdays, by offering discounts and special prices, whereas The Netherlands and Belgium work
with fiscal incentives related to employee benefits to encourage commuters to choose to cycle to

Policy brief: Cycling Cities                         11
Policy Learning Platform on Low-carbon economy
work. A good practice from Maastricht involves even the visit of a mobility advisor in companies.
This practice has yielded very good results and is worth considering for inclusion into a SUMP.
GOOD PRACTICE: Employer approach by Maastricht Bereikbaar
The Employers Approach is a regional tool for influencing employees’ mobility behavior as a
way of enhancing direct involvement and participation on personal travel. Instead of offering
mobility via road infrastructure or public transport, with this measure, people are offered advice
and choices on their own mobility. It raises the awareness of employees and offers them new
mobility opportunities.
A broker visits the employers of all bigger companies in the region and makes an analysis of
the transport situation of employees, regarding the geographic, socio-economic and mobility
aspects. The broker then offers alternatives for car travel and the employers can offer the
alternatives to the employees (pilots using tax refunding scheme or direct compensation of
costs).
To foster the measure, employers can use tax benefits (benefits from national tax law) or
compensation of costs for employees using bikes or public transport.
This approach is part of the regional SUMP to stimulate mobility, cycling and public transport.
The amount used for paying the mobility broker is 50,000 EUR. The costs for the pilot deals
were paid by the companies.
The number of drivers who regularly leave their cars for commuting has increased by 32%
between 2014 and 2015. 2,600 employees choose, thanks to Maastricht Bereikbaar, alternative
solutions for commuting. That is 600 more than at the end of the previous year. They use
cycling, e-bikes, public transport or smart working (teleworking or off-peak hour working), on
average 2.5 times per week. This has been found thanks to the impact assessment conducted
among 6,000 employees from 30 companies.
For more information, visit the REFORM website
While positive incentives are one side of the coin, negative incentives, or dissuasions, are the other
way of inducing behaviour change. New and attractive infrastructure, priority for cyclists and
rewards for taking to cycling are all pull-factors. For car drivers, on the other hand, the loss of public
space in the form of fewer driving lanes, fewer and more expensive parking space, speed
limitations, ultra-low emissions zones, charges to enter the city, car-free days, cycling streets etc.
are all dis-incentives for car use that ultimately benefit other modes of transport, including cycling.
In a world where citizens value convenience, making car use less convenient than cycling leaves
its impact in behaviour. This is more visible in the younger and urban population than in the elder
and rural population.
Policy brief: Cycling Cities 12Policy Learning Platform on Low-carbon economy
GOOD PRACTICE: Almada “Better without cars” campaign
In the “Better Without Cars” Campaign, drivers were voluntarily encouraged to leave their cars
at home on one fixed day per week – Thursdays. In return, they were given several incentives,
from special public transport tickets with a reduced price, to discounts for cultural and sporting
activities, as well as for several shops in Almada. Eligible participants included all residents of
the Municipality of Almada as well as non-residents who worked within the Municipality.
Thirteen registration offices have been created within the Municipality. All the public transport
operators (bus, train and boat) and one of the two taxi associations of Almada have been
involved. The price reductions ranged from 17 to 30% of the normal ticket price for access to
public transport and several sport, retail and cultural activities. The approximate budget for the
project implementation and marketing was 75,000 EUR, of which part was the City Council own
resources.
For more information, visit the RESOLVE website
Data collection and monitoring
Before and after each measure, modern policy
making knows, it is important to count, measure, and
collect data. This goes for determining actual traffic
flows, and modal shares before and after policy
intervention. Data helps understand what works and
what does not.
Collecting data is paramount for planning,
implementation and impact assessment of cycling
measures. Any method to collect data is acceptable,
be it sensors, mechanical, or human counters.
Surveys are also encouraged to detect trends and
query users.
Overall, we observe that there is little data available
on cycling, and where data is available, is it not
comparable due to diverging methodologies.
The most advanced cycling nations also have the best practices when it comes to data collection,
as demonstrated by the annual facts & figures handbook of “Copenhagen, city of cyclists”.
But others like Thessaloniki are catching up and can report policy changes achieved within the
REFORM project. In March 2018, a call for proposals was launched by the Regional Operational
Programme of the Region of Central Macedonia; as a result, a “Sustainable Urban Development
Observatory of the urban area of Thessaloniki” was created, which will also collect cycling data.
Policy brief: Cycling Cities 13Policy Learning Platform on Low-carbon economy
Future trends & Cycling and Covid-19
Cycling is clearly on the rise as a simple means to address many societal problems that culminate
in urban areas, and many policy makers are keen to increase its modal share in their territories.
This is also good to counter another trend, which is the one towards more obesity and less
movement observed throughout Europe.
Europeans live longer and have more quality retirement time to enjoy after an active work life. While
senior citizens have started the trend towards electric bikes, other parts of the population have
now also discovered them as means to make it possible to cover longer distances by bike, to
transport greater loads, to overcome physical obstacles, such as inclinations, and to allow groups
of people with diverse physical fitness to enjoy recreational activities together. E-bike sales are
constantly growing as a result, and no end is in sight. Mobility policy makers should take these
developments into account.
Figure 4 – E-bike sales in EU-28. Source: EU Cycling Strategy, 2017, ECF
Another cycling sub-sector that is on the rise is that of cargo bikes for last-mile deliveries. Bikes
with sturdy frames and transport boxes are being introduced by renowned logistics companies. The
German City Kempten supports companies that want to introduce them in their daily operations,
and cargo bike-sharing schemes emerge all across Europe. The Slovenian city of Maribor has even
set new rules for last-mile delivery in the city centre to avoid air pollution and regulate delivery in
the pedestrian zone. Sustainable Urban Logistics Plans (SULPs) are becoming more common,
starting from the capital cities and they reserve a space for cargo bikes, too. In the countries with
strong cycling cultures, private citizens are using the cargo bikes to ferry their kids around town
and to carry the shopping home. Often, such cargo bikes are e-bikes, combining the two trends in
one feature.
The COVID-19 pandemic might have a lasting disruptive effect on mobility in cities. While public
mass transport is risky, and many countries have prohibited car use for leisure, cycling has turned
out to be the individual, flexible and corona-safe mode of local transport, and many people have
taken out their bikes or purchased new ones. “Bike sales soar as UK takes to cycling” titles the UK
newspaper Guardian on 23 May 2020 to capture the impact of COVID-19 on citizen’s travel
behaviour. Vendors report unprecedented growth in sales and bike repair shops have customers
queuing. Electric bike sales are also up as elder people look for alternatives to public transport or
a car. The World Economic Forum writes “14 million Britons could chose cycling over a car following
the COVID-19 pandemic.” It remains to be seen if this behaviour change is temporary or the new
normal beyond COVID-19.
Policy brief: Cycling Cities 14Policy Learning Platform on Low-carbon economy
Some large cities have recently taken unprecedented measures to spur this trend and to offer its
citizens a safe space for walking and cycling. Berlin, Paris, Brussels and Milan for example are
rolling out both permanent infrastructure and pop-up ‘corona cycleways’ in a wave of measures
that includes free bicycle repairs and even cycling lessons. In previously car-dominated Brussels,
pedestrians and cyclists have priority everywhere in the centre since May 2020 and can use the
entire street. Streets have become ‘slow streets’ limiting the speed of cars and busses to 20km/h.
Outside of the inner circle and practically overnight, big city highways such as Rue de la Loi have
received bike lanes secured by concrete separators from the car lanes.
The bystander is watching in awe and wondering if policy makers are using the momentum created
by the pandemic to push through seemingly over-night radical measures that form part of a long-
term plot, while the stakeholders are held in lock-down and cannot protest and thus create a ‘fait-
accompli’, or if these measures are merely a fast response to the virus-induced sudden need. In
line with good practice and the recommendations for policy makers, it would be preferable if there
was a coherent strategy behind all this.
European support for cycling
Interestingly, there is no European cycling strategy, no EU target, nor any legal framework that
focuses solely on cycling. For years, when talking about greening the transport sector, EU-level
efforts have privileged R&I on green transport fuels, from hydrogen over biofuels to batteries more
recently. Sector stakeholders with support of the European Parliament called for an EU-level
cycling strategy and prepared a proposal in 2017 (EU Cycling Strategy) that was intended to lead
to a pan-European masterplan for cycling promotion to be officially adopted by the European
Commission under the previous Commission, which did not happen due to time constraints in 2019.
Again, cycling was omitted in the EU Green Deal, even though it offers a simple solution to so many
complex problems that show mainly in an urban setting. We expect at least that the coronavirus
pandemic has catapulted cycling into the minds of mobility policy makers, and maybe it will finally
find its way into an EU-level strategy with the upcoming Strategy for sustainable and smart mobility,
which is due later in 2020 and that shall replace the outdated Transport White Paper from 2011.
Thus, strategy-wise, there is no EU level support. But another alliance of international organisations
made up of the WHO and the UN Economic Commission for Europe is planning for the adoption of
the first ‘Pan-European Master Plan for Cycling Promotion’ in November 2020. The objective is to
establish a policy framework across sectors and actors to achieve environmentally friendly,
economically viable, socially fair and healthy mobility all over Europe.8
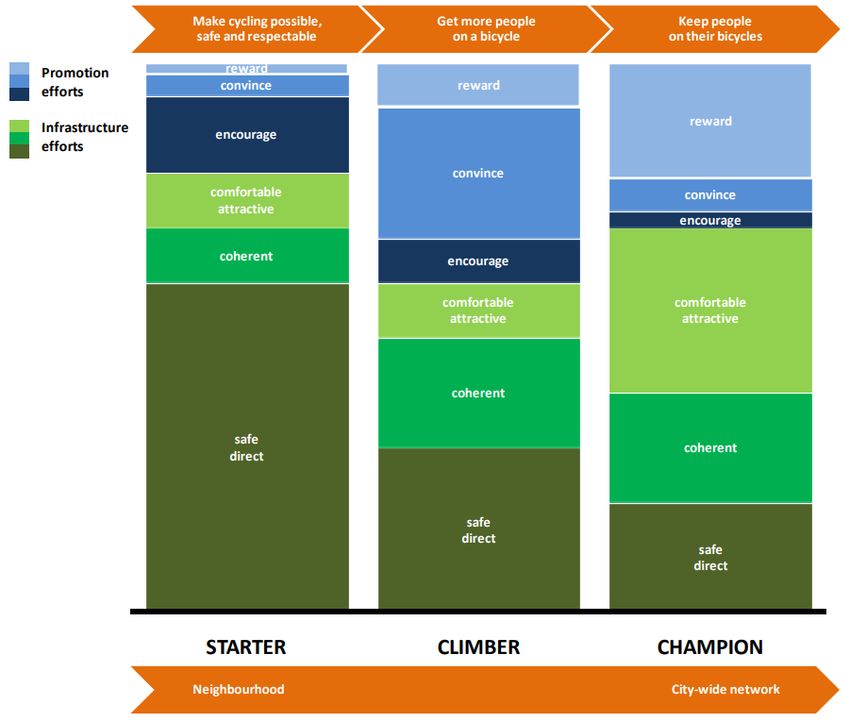
European Commission DG Mobility and Transport have established a number of initiatives for
supporting cycling in the EU, including guidance for cycling projects and case studies from ‘starter’,
‘climber’ and ‘champion’ cities. The EC guidance includes topics related to integrating cycling into
SUMPs, preparing city cycling strategies and plans and cycle training, amongst many others.
Further good practices and advice is also available via the Eltis portal, the Civitas initiative and the
websites of EU-funded cycle projects.
8
See WHO calendar: 5th High-Level Meeting on Transport, Environment and Health (25–27 November, Vienna, Austria)
Policy brief: Cycling Cities 15Policy Learning Platform on Low-carbon economy
Figure 5 – Cycling development stages. Source: DG Mobility and Transport 9
In terms of financing the transition, the European Union provides funding via the European
Structural and Investment Funds (ESIFs) which can support the development of cycle
infrastructure. Under the current ESIFs, the relevant Investment Priorities are IP4, ‘supporting the
shift towards a low-carbon economy in all sectors’, and IP7 ‘Promoting sustainable transport and
improving network infrastructures’. The ESIFs can be used for co-funding investment in cycling
infrastructure, awareness raising and education campaigns, and support for the cycling industry,
though this is determined by national and regional priorities in their Operational Programmes.
The ECF provides guidance to regional transport planners for accessing European funds, including
a step-by-step guide for accessing ESIFs, including a tool for finding where cycling is mentioned in
Operational Programmes. Though now a little outdated (for 2014-2020), their publication, ‘Cycling
for Growth: Using European Funds for Cycling’ provides additional information on ESIFs and other
resources, most of which will continue into the next programming period (2021-2027).
The new Regional Development and Cohesion Policy in 2021-2027 will focus on five priorities, with
opportunities in the priorities, ‘Greener, carbon free Europe’ and ‘Connected Europe’. Now is the
time to begin lobbying your managing authorities to fund your cycling projects!
9
https://ec.europa.eu/transport/themes/urban/cycling/guidance-cycling-projects-eu/planning-cycling-cities/preparing-city-cycling-strategies-and-
plans_en
Policy brief: Cycling Cities 16Policy Learning Platform on Low-carbon economy Key learnings & recommendations General aspects • Cycling has many benefits, not only in the area of mobility. Compared to the related necessary public investment to support cycling, the benefit-cost ratio is very positive, as proven by a UK Government study. This makes public money spent on cycling a very good investment. • Cycling concerns not only mobility policy, but also health policy, due to its very important health benefits. Mobility policy makers could seek support from health policy makers to foster cycling. This happens already at macro-scale where the World Health Organisation teams up with the UN Economic Commission for Europe to design guidelines for a healthy mobility. Getting the city ready for cycling • Cycling deserves its own strategy and should be more than an assembly of individual measures. Cycling should ideally be part of an overall urban mobility planning (e.g. a SUMP) and get its own strategy, as done in Zaragoza’s Cycling Master Plan. • Rather than building stretches of cycling lanes here and there, mobility planners are advised to plan for coherent cycling network development that connects the different parts of the urban functional area with a set of primary arteries and secondary lanes. The Italian BICIPOLITANA concept from Pesaro and Bologna are nice and replicable illustrations of such high-level network planning coupled with a great visual way to explain and communicate this network. Likewise, the city of Tartu planned its cycling roads as a logical network of bicycle paths covering all the main directions going out of town. • Network coherence also implies planning for the connection of cycling paths to rail transport, allowing for a convenient and safe modal shift. Safe bike parking ensuring theft protection through lights and cameras should be installed near stations as done in Dublin. • Safety and infrastructure are key to make people want to cycle more. Especially in cities without deeply rooted cycling culture, physical barriers separating bikers from motorised vehicles are advisable to increase the real and perceived safety for cyclists. • Another measure to increase safe cycling space is the transformation of streets into cycling streets. Getting the citizens ready to cycle • When the city is ready to accommodate cyclists, many will turn naturally to cycling or use their bikes more than previously just because a designated safe space for cycling is available. But a larger part of the population will need to be educated, nudged or incentivised to cycle more, and the section below summarises an array of successful measures that should be seen as complementary to each other. • People do not cycle because it’s good for the environment, but because it’s good for them as individuals: faster, easier; healthy, cheap and convenient. These are the arguments that are likely to have an impact on people. • Good habits should be rooted early on in as many people as possible: schools are an excellent place to start cycling education and to get children to cycle regularly. The SCHOOL CHANCE project has many good practices related exactly to this. The Netherlands proposes cycling exams for all kids, while the German Police goes into primary schools to teach how to cycle and how to respect rules. • To shift adults’ mobility behaviour (away from the car and to the bicycle), the use of incentives and disincentives together is a promising strategy. Policy brief: Cycling Cities 17
Policy Learning Platform on Low-carbon economy

•   Disrupting the habits of daily car use with e.g. a car-free day, is a cheap and effective way of
    encouraging citizens to take to the street in actives modes of mobility. The city of Almada has
    gone further by incentivising commuters to drop the car once per week against incentives.
•   Sending a mobility advisor into companies to consult employees on alternatives to car use to
    go to work is an effective good practice from Eindhoven, especially since it is coupled with fiscal
    incentives. In Belgium, bike purchases by companies for their staff are fully tax deductible.
•   Disincentives for car use, such as reduced road and parking space, parking and city centre
    entrance fees, stringent air quality restrictions, slowed down traffic, etc. are also working in
    favour of other modes of transport that do not suffer these inconveniences, such as public
    transport and cycling.

Measure & monitor & evaluate
• Data on cycling and user travel preferences should be regularly collected, before measures, to
   plan their implementation, and ex-post to evaluate the impact and understand if it works well.

Trends & COVID-19
• E-bikes are on the rise and impact what a bike can do and who can bike. Policy makers should
   be aware of this trend and include it in their strategy considerations
• Cargo-bikes are getting more popular for last-mile delivery e.g. for parcels and are finding their
   way into the first cities’ logistics strategies
• The corona pandemic has created a surge in demand for bikes and is changing urban travel
   behaviour rapidly as citizens seek a safe and flexible means for local transport
• Some cities have used the lock-down to implement radical pro-cycling measures, such as
   Brussels, London or Berlin.

Sources and further reading

•   Calculating the economic benefits of cycling in EU-27, ECF, 2013
•   Jobs and Job Creation in the Cycling Economy, Transport & Mobility Leuven, 2014
•   EU Cycling Strategy, ECF, 2017
•   Policy brief on SUMPS, Policy Learning Platform, 2018
•   Supporting and encouraging cycling in sustainable urban mobility planning, ELTIS, 2019
•   Copenhagen City of Cyclists, Facts & Figures 2017
•   Barriers to Implementing Pro-Cycling Policies: A Case Study of Hamburg, Luqi Wang, 2018

                                                            Cover image copyright: GreenMatters srl

Policy brief: Cycling Cities                      18
#lowcarbon #cycling #urban
#regionaldevelopment
Interreg Europe Policy Learning Platform on
Low-carbon economy
Thematic experts:
Simon Hunkin & Katharina Krell
s.hunkin@policylearning.eu k.krell@policylearning.eu
https://interregeurope.eu
June 2020You can also read