Dairy Buffalo Life Cycle Assessment (LCA) Affected by a Management Choice: The Production of Wheat Crop - MDPI
←
→
Page content transcription
If your browser does not render page correctly, please read the page content below
sustainability

Article
Dairy Buffalo Life Cycle Assessment (LCA) Affected by a
Management Choice: The Production of Wheat Crop
Elio Romano 1 , Pasquale De Palo 2 , Flavio Tidona 3 , Aristide Maggiolino 2                             and Andrea Bragaglio 2, *

                                          1   Council for Agricultural Research and Economics, Research Centre for Engineering and Agro-Food
                                              Processing, CREA-IT, 24047 Treviglio, Italy; elio.romano@crea.gov.it
                                          2   Department of Medicine Veterinary, University of Bari “Aldo Moro”, 70010 Valenzano, Italy;
                                              pasquale.depalo@uniba.it (P.D.P.); aristide.maggiolino@uniba.it (A.M.)
                                          3   Council for Agricultural Research and Economics, Research Centre Animal Production and Aquaculture,
                                              CREA-ZA, 26900 Lodi, Italy; flavio.tidona@crea.gov.it
                                          *   Correspondence: andrea.bragaglio@uniba.it

                                          Abstract: Life cycle assessment (LCA) was performed in dairy buffalo farms representative of South-
                                          ern Italian farming systems, similar due to several characteristics, with the exception of wheat
                                          production. This work evaluated the impacts derived from this management choice, comparing
                                          farms with wheat crop (WWC) or not (NWC). In agreement with the literature, economic allocation
                                          was chosen as a useful strategy to attribute equivalents to by-products, i.e., culled animals; the same
                                          criterion was also adopted to assign pollutants to wheat grain, limited to WWC farms. Environ-
                                          mental impacts in terms of Global Warming Potential (GWP, kg CO2 eq), Acidification Potential
                                          (AC, g SO2 eq), Eutrophication Potential (EU, g PO4 3- eq), Agricultural Land Occupation (ALO, m2 y)

                                   and Water Depletion (WD, m3 ) were estimated. The production of wheat crop significantly affected
                                          (p < 0.05) the Agricultural Land Occupation (ALO) category as WWC farms need adequate land.
Citation: Romano, E.; De Palo, P.;
                                          WWC farms could allow a significant reduction in eutrophication (EU) compared to NWC farms
Tidona, F.; Maggiolino, A.; Bragaglio,
A. Dairy Buffalo Life Cycle
                                          (p < 0.05).
Assessment (LCA) Affected by a
Management Choice: The Production         Keywords: life cycle assessment; dairy buffalo; forages; wheat crop; allocation
of Wheat Crop. Sustainability 2021, 13,
11108. https://doi.org/10.3390/
su131911108
                                          1. Introduction
Academic Editor: Giacomo Falcone               Water buffalo (Bubalus bubalis) is a species that provides multiple products worldwide
                                          such as draught power, meat, milk, skin and manure. In Italy, buffalo farming has been
Received: 18 September 2021
                                          conducted for centuries in extensive conditions based on marshland environments. Nowa-
Accepted: 4 October 2021
                                          days, most of the Mediterranean Italian Buffalo breed buffaloes are reared under intensive
Published: 8 October 2021
                                          conditions to produce milk, almost entirely processed in mozzarella cheese. The production
                                          of buffalo mozzarella cheese is steadily increasing, +26.1% from 2013 to 2017, driven by
Publisher’s Note: MDPI stays neutral
                                          the constant export increase, especially in Europe, the United States of America and Great
with regard to jurisdictional claims in
                                          Britain, and by the growing international interest in this product, as witnessed by the recent
published maps and institutional affil-
                                          introduction of dairy buffalo in Germany and Great Britain [1–3].
iations.
                                               Most of these animals are reared in the Protected Designation of Origin (PDO) area
                                          comprising the Campania, Lazio, Apulia and Molise regions, where recently buffalo
                                          husbandry has moved to more intensive farming conditions with a feeding system based
                                          on three different rations corresponding to the three main buffalo productive stages, i.e.,
Copyright: © 2021 by the authors.
                                          lactating cows, dry cows and growing heifers [4]. Berlese et al. [1] also highlighted that in
Licensee MDPI, Basel, Switzerland.
                                          these conditions the animals have no access to pasture and water for wallowing.
This article is an open access article
                                               Additionally, those areas are historically vocated to produce wheat, mainly to manu-
distributed under the terms and
                                          facture pasta, which is exported worldwide.
conditions of the Creative Commons
Attribution (CC BY) license (https://
                                               In Northern Italy, mozzarella cheese is sold directly to consumers through a short
creativecommons.org/licenses/by/
                                          supply chain. In this context, dairy plants started transforming buffalo milk not exclusively
4.0/).

Sustainability 2021, 13, 11108. https://doi.org/10.3390/su131911108                                  https://www.mdpi.com/journal/sustainability
Sustainability 2021, 13, 11108                                                                                            2 of 20

                                 in mozzarella cheese but also in other products, such as ripened cheeses and ricotta, which
                                 are appreciated by consumers [1].
                                      Although there is growing attention on the environmental impact of livestock farm-
                                 ing, to our knowledge, few studies focused on milk buffalo are available. In particular,
                                 few LCA studies have been developed on the allocation of a by-product such as wheat
                                 grain (Triticum durum Desf.).
                                      As indicated by several authors [5–7], dairy systems often produce crop commodities
                                 (cereals), thus in cases of multifunctional processes the environmental impact should
                                 be shared among products. The aim of this study was to compare the environmental
                                 impact of buffalo milk, provided with two different management systems, integrated with
                                 economic allocation.

                                 2. Materials and Methods
                                 2.1. The Farms
                                      All the farms of this study, located in the Apulia and Basilicata regions, are specialized
                                 in buffalo dairy farming, with animals kept in confinement. They adopt sexed semen
                                 mainly for the heifers to keep high-value animals, and their profiles are described in Table 1.
                                 The primary data were obtained from six farms distributed in two groups: No Wheat Crop
                                 (NWC) and With Wheat Crop (WWC). Despite the fact that the feeding of both groups
                                 is balanced with a 2:1 ratio = corn silage:wheat/straw, only the WWC group does not
                                 purchase supplementary forages, such as hay and straw. The WWC farms had different
                                 arable lands but a similar incidence of wheat income. The NWC1, WWC2 and WWC3 farms
                                 are located in the Protected Designation of Origin (PDO) area of Foggia Province (Apulia
                                 Region), whereas Basilicata (Potenza and Matera Provinces) is excluded from the PDO.
                                 According to widespread knowledge, Mediterranean Italian Buffalo breed animals show a
                                 noticeable heterogeneity in size, and this characteristic would affect management, feeding
                                 and productions, also conditioning dry matter intake of feed and milk yields.

                                 Table 1. Profile of the farms and of the two groups. Urea 46%N and ammonium nitrate 27%N.

                                                                   No Wheat Crop (NWC)            With Wheat Crop (WWC)
                                                                NWC1       NWC2       NWC3      WWC1       WWC2       WWC3
                                      Geographical place
                                                                Foggia    Potenza    Potenza    Matera     Foggia     Foggia
                                          (Province)
                                      Total crop area, Ha          20        65         80         65        225        270
                                            Hay, Ha                20        50         40         40         50        140
                                          Barley, Ha                -         -         10          -          -          -
                                       Maize silage, Ha             -        15         30          -         15         15
                                       Maize grain, Ha              -         -          -          -         10         20
                                          Wheat, Ha                 -         -          -         25        150         95
                                        Herd, heads n.            197       303        446        203        479        613
                                      Lactating cows, n.           60       120        150         52        160        185
                                         Dry cows, n.             25         50         80         60        180        185
                                          Heifers, n.              90        80        185         50        100        175
                                     Young < 365 days, n.          20        45         25         35         30         60
                                            Bulls, n.               2        8          6           6          9         8
                                          Urea, t y−1               -       10.0       20.0       37.5       45.0       59.5
                                   Ammonium nitrate, t y−1          -         -        7.0          -          -          -
                                       Phosphate, t y−1             -         -          -          -        0.8        1.6
                                   Potassium chloride, t y−1        -         -        5.2          -          -          -
                                     Concrete area (shed,
                                                                 1500       4000       3500       1000       6000      11,000
                                         services), m2
                                    Milking parlor size, m2      200        200         400       150        300        300
                                       Milk tank, liters         1400       6000       5000       2500       4000       6000
                                       Diesel, liters y−1       18,800     23,500     76,500     21,200     64,700     70,500
                                     Electricity, kWh y−1       45,700     65,000     97,000     50,000     76,000     87,600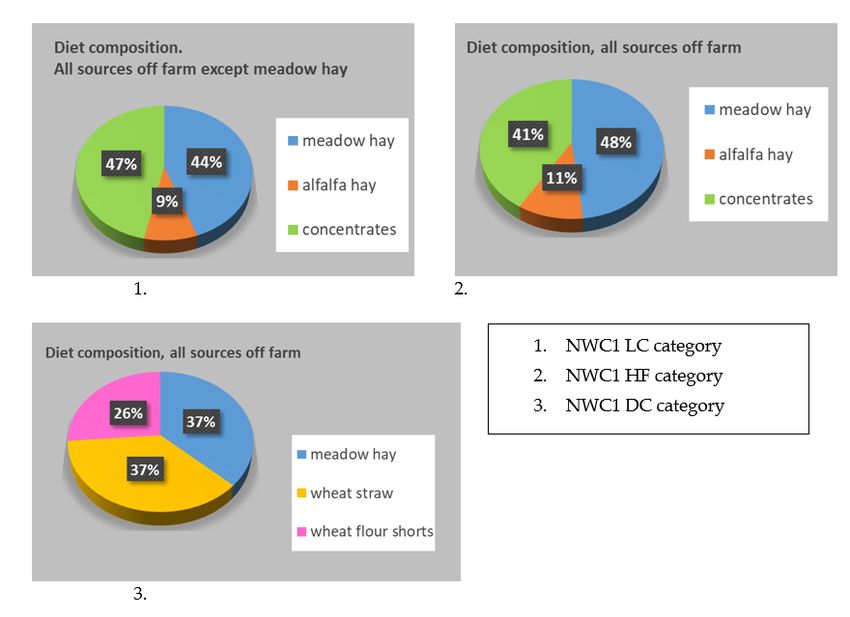
Sustainability 2021, 13, 11108                                                                                          3 of 20

                                 2.2. Life Cycle Assessment (LCA) Methodology
                                      The farms were analyzed with an LCA approach, based on ISO 14040 and ISO
                                 14044 methodology [8,9]. The principles and framework for LCA include four distinct
                                 phases: (1) definition of the goal and scope (including functional unit and limits of the
                                 system); (2) life cycle inventory (LCI) analysis (including input and output data collection
                                 for all processes); (3) life cycle impact assessment (LCIA); (4) life cycle interpretation.

                                 2.2.1. Goal and Scope Definition
                                      In this study, the environmental impacts of milk obtained from two different farming
                                 managements in terms of Global Warming Potential (GWP, kg CO2 eq), Acidification
                                 Potential (AC, g SO2 eq), Eutrophication Potential (EU, g PO4 3- eq), Agricultural Land
                                 Occupation (ALO, m2 y) and Water Depletion (WD, m3 ) were assessed. The functional unit
                                 was 1 kg of normalized buffalo milk, with a reference milk fat and protein (fat and protein
                                 corrected milk, FPCM) content of 8.3 and 4.73%, respectively. Raw milk was transformed
                                 into FPCM with the following equation [10,11]:

         FPCM (kg/yr) = ({[(g of fat/L − 83) + (g of protein/L − 47.3)] × 0.00687} + 1) × milk production (kg/yr)          (1)

                                 2.2.2. System Boundary Definition
                                      The system boundaries considered in the study were comprised “from cradle to farm
                                 gate” (Figures 1 and 2). All the on-farm operations (e.g., animal feeding and care, milking
                                 procedures) and sources pertaining to forage production (e.g., arable land, agrochemicals,
                                 water) were considered. The consumption of energy and the emissions from activities
                                 conducted off-farm were retrieved from databases provided by SimaPro 8.03 [12]. The trans-
                                 port of off-farm feeds, fossil fuels and bedding materials and their emissions were also
                                 included in the assessment.

                                 2.2.3. Allocation Criterion
                                      Dairy systems are typically multifunctional processes that coproduce meat from
                                 culled animals and surplus calves, for example, in addition to milk. In particular, the farms
                                 involved in this study are located in Southern Italian regions (Apulia and Basilicata), where
                                 the cultivation of wheat grain (Triticum durum Desf.) is largely widespread. This research
                                 focused on the presence of this peculiar coproduct, considered a relevant managing factor,
                                 to obtain two advantages for the three wheat-based farms:
                                 1.   A significant income in addition to milk.
                                 2.   The wheat also provides straw, adopted as fodder (mainly for dry cows) and litter.
                                      The With Wheat Crop (WWC) farms benefit from full forage self-sufficiency.
                                     For these reasons, the economic allocation criterion was applied to both the by-product
                                 wheat grain and culled cows, in agreement with Pirlo et al. [11].
                                     Young females are kept as replacers in the amount described by the owners, whereas
                                 male calves are sold at the 15th day of life; thus, the inputs and outputs provided by these
                                 animals were not considered.

                                 2.2.4. Inventory Analysis and Input Data
                                      The inventory data on livestock production, crop cultivations, straw for litter, inputs
                                 of purchased feed, electricity, diesel consumption and farm extension (divided in crop Ha
                                 year−1 ) were processed as primary data. The consumption and emission factor of natural
                                 gas adopted in the farms (water heating) was excluded due to the low impact and because it
                                 was not possible to have precise information about it. The feed consumption was retrieved
                                 by interviews with the farmers, the kind of water (i.e., well, tape) used in the farms was
                                 also obtained with interviews, whereas the consumption was assessed. In addition, a brief
                                 description about milk performances is reported in Table 2.
                                      The inventory analysis involved the buildings, as sheds and concrete paved areas,
                                 whereas the structures and the bunkers (for corn silage) to stock the forages were excluded.
Sustainability 2021, 13, 11108                                                                                                             4 of 20

                                                A productive life of 50 years was assumed for these constructions, as suggested by the
                                                Ecoinvent 3 allocation database. The on-farm feed was assumed to be transported for
                                                1 km with a tractor (Transport, tractor and trailer, agricultural (GLO), market for, Alloc,
                                                Def, S) whereas the bought feed, carried by truck (Transport, freight lorry > 32 metric
                                                ton, EURO 5, RER), was computed based on the distance from the farm, as suggested
                                                by Bragaglio et al. [13]. The sunflower meal feed, in most cases, is also imported [14];
                                                thus, a 2700 km travel distance by truck from Ukraine was assessed. According to other
                                                authors [15], a 10,000 km journey by ship (Transport, freight, sea, transoceanic ship (GLO),
                                                market for, Alloc, Def, S) for soybean and cotton seeds from South America and a 12,000 km
                                                journey for palm oil from Malaysia were assumed.
                                                      Finally, the journey from the Italian harbor to farm gate was added to this computation.
                                                For fossil fuel provision, we also considered transport by truck: transport freight lorry of
                                                3.5–7.5 metric ton, EURO 5, RER.
                                                      The water consumption was distinguished in specific categories, provided by the soft-
                                                ware Simapro 8.03: the water needed for transoceanic crops, the Italian well water mainly
                                                adopted for maize and the water adopted for the industrial processes (for example, wheat
                                                flour shorts). A description of the formulation and composition of the diets administered
                                                by the six farms is shown in Tables 3 and 4, respectively, for cows (lactating and dry, LC and
                                                DC), heifers (HF) and young animals (91–365 days old, YA). The diets of the calves until
                                                the 90th day, based on milk replacers, weaning meal and a small amount of hay as sources
                                                of fiber, are very similar and were not reported in the table. Their amounts were loaded
                                                into the software and processed.

                 Table 2. Dairy performances and milk components of No Wheat Corn (NWC) and With Wheat Corn (WWC) farms.

                 Item                    Unit              NWC1             NWC2              NWC3             WWC1           WWC2          WWC3
             FPCM yield                 kg/year           254,405           370,400           481,800          146,000        438,000       474,850
         Average FPCM per
                                        kg/head             3137              3087             2374              2076           2025          1897
             lactation *
           Fat mean ± SD                  %             7.38 ± 0.31       7.46 ± 0.45       7.83 ± 0.40      7.54 ± 0.41     8.30 ± 0.41   8.57 ± 0.53
         Protein mean ± SD          %      4.63 ± 0.12                    4.25 ± 0.16       4.48 ± 0.07      4.42 ± 0.21     4.65 ± 0.09   4.68 ± 0.14
Sustainability 2021, 13, x FOR PEER REVIEW
            Bacterial count                 76,670 ±                       316,224 ±        131,667 ±          91,167 ±       73,077 ±      97,947 ±
                                 cfu/mL
              mean ± SD                       50,796                         25,215          113,900            37,649         67,661        47,339
                                                * Assuming 270 and 95 days for lactation and dry period, respectively [4].

                                                Figure 1. System boundaries of No Wheat Crop (NWC) system.
                                            Figure 1. System boundaries of No Wheat Crop (NWC) system.
Sustainability 2021, 13, 11108   Figure 1. System boundaries of No Wheat Crop (NWC) system.                                  5 of 20

                                   Figure 2. System boundaries of With Wheat Crop (WWC) system.
                                 Figure 2. System boundaries of With Wheat Crop (WWC) system.
Table 3. No Wheat Crop (NWC) diets. Animal categories: lactating cows (LC), dry cows (DC), heifers (HF), young animals (YA);
# Vicia faba minor; * kg/head/day.

                                              NWC1                            NWC2                            NWC3
              Category                LC     DC  HF          YA       LC     DC  HF          YA       LC     DC  HF          YA
        Forage kg/head/day
            Meadow hay                8.0     5.5     3.5     2.0    10.0     7.0     5.0     3.0     3.2      -     3.2      1.5
            Alfalfa hay               2.0      -      1.8      -      -        -       -       -       -       -      -        -
              Straw                    -      5.5      -       -      -       4.0     2.0     1.0      -      7.0    2.0       -
            Maize silage               -       -       -       -     8.0      5.0     3.0     2.0    19.0     6.0    13.0     2.0
  Raw concentrate kg/head/day
         Maize flour/grain            4.0      -      1.3      -       -       -       -       -      4.0      -       -      0.5
              Barley                  1.5      -      0.4     1.0      -       -       -       -      2.0     2.0      -      1.0
          Soybean meal                1.1      -       -       -       -       -       -       -       -       -       -       -
         Wheat flour shorts            -      2.0      -       -       -       -       -       -       -       -       -       -
      Market concentrate g/head/day
      Soybean seeds (roasted)         310      -       -       -       -       -       -       -       -       -       -       -
          Soybean seeds
                                      240      -     480     400     2600      -     800     400     1650    260     200     150
        (dehulled/flaked)
         Sunflower meal               480      -     440     360     2000      -     600     260     450     380     300     220
           Cotton seeds               540      -       -       -     1600      -     500     220     450      -       -        -
           Maize flour                450      -       -       -      300      -     100      80      -      130     100       -
           Fava bean #                480      -       -       -       -       -      -        -      -       -       -        -
        Wheat flour shorts            280      -     480     400       -       -      -        -      -      700     560      80
            Beet pulp                 280      -       -       -       -       -      -        -      -       -       -      350
            Linseeds                  240      -       -       -       -       -      -        -      -       -       -        -
           Wheat flour                220      -       -       -       -       -      -        -      -       -       -        -
               Bran                     -      -     440     360       -       -      -        -     800     680     540     400
         Maize germ meal                -      -     220     180       -       -      -        -      -      130     100       -
         Maize distillers               -      -      60      50       -       -      -        -     800     130     100      80
             Palm oil                  60      -       -       -       -       -      -        -      -       -       -        -
            Molasses                   50      -      60      50       -       -      -        -      -      130     100      80
    Chemical composition (%)
        Dry matter (DM) *            17.8    11.7     8.2     4.4    18.1    11.4     8.3     5.0    18.2    12.1    10.5     4.6
       Crude protein (%DM)           12.45    9.65   15.50   15.00   14.00    9.70   12.35   14.20   14.25    9.05   11.80   14.50
       Ether extract (%DM)           5.80    3.50    3.45    3.70    3.15    2.75    2.90    3.40    4.40    3.25    3.15    4.15
        Crude fiber (%DM)            22.70   36.60   28.00   18.70   27.60   35.90   26.65   32.20   21.40   29.85   25.20   18.95
           Ash (%DM)                 7.60    7.00    8.35    8.35     7.25    3.90    5.45    4.10    7.20   7.05    7.45    6.75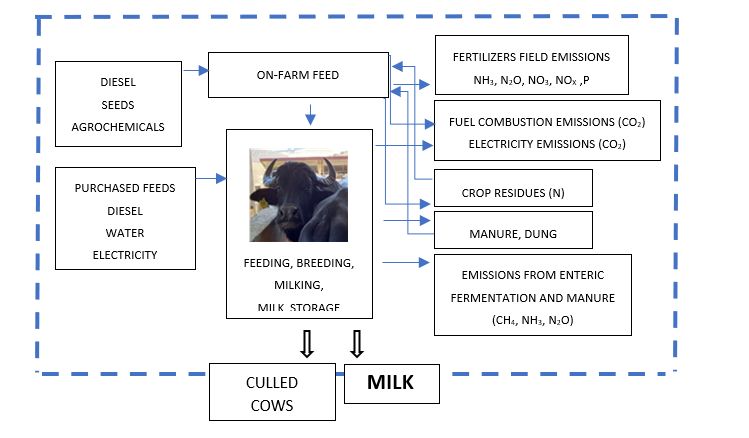
Sustainability 2021, 13, 11108                                                                                                6 of 20

Table 4. With Wheat Crop (WWC) diets. Animal categories: lactating cows (LC), dry cows (DC), heifers (HF), young animals (YA);
§ Avena sativa L. with Vicia sativa L.; # Vicia faba minor; ‡ Pisum sativum L.; * kg/head/day.

                                            WWC1                               WWC2                            WWC3
              Category              LC     DC  HF           YA         LC     DC  HF          YA       LC     DC  HF          YA
         Feed kg/head/day
             Oat hay                -        -       -        -        3.0      -      1.5     2.0     3.5     8.0    10.0     3.5
       Mixed meadow hay §          10.0      -      5.0      2.8        -       -       -       -       -       -      -        -
              Straw                 -       7.5      -        -        1.5     8.5     2.0     1.0     2.0     3.0     -        -
           Maize silage             -        -       -        -       15.0      -      3.0     1.5    15.0      -      -        -
  Raw concentrate kg/head/day
         Maize grain/flour           -       -       -        -        6.5     2.0     4.0     1.0     4.0      -       -       -
              Barley                 -       -       -        -         -       -       -       -       -       -       -       -
          Soybean meal               -       -       -        -        2.9     0.8     2.0     0.5     1.0      -       -       -
           Fava bean #               -       -       -        -         -       -       -       -      2.0      -       -       -
               Pea ‡                 -       -       -        -         -       -       -       -      1.0      -       -       -
        Market concentrate
           g/head/day
           Maize flour             3200    750     1100     660         -       -       -       -       -       -       -     400
          Soybean seeds
                                   1800    400     400      240         -       -       -       -       -       -       -     100
        (dehulled/flaked)
      Soybean seeds (roasted)        -       -     1100     660         -       -       -       -       -       -       -      80
              Barley               1400      -       -        -         -       -       -       -       -       -       -       -
            Molasses               400      50     120       70         -       -       -       -       -       -       -      50
               Bran                200     900     360      220         -       -       -       -       -       -       -     270
             Palm oil               100      -       -        -         -       -       -       -       -       -       -       -
         Sunflower meal              -     300       -        -         -       -       -       -       -       -       -     250
            Beet pulp                -     100     900      550         -       -       -       -       -       -       -       -
        Wheat flour shorts           -       -       -        -         -       -       -       -       -       -       -     380
    Chemical composition (%)
        Dry matter (DM) *          16.0     9.5     7.9      4.6      17.5    10.3     9.6     4.5    17.1     9.8     8.9     4.5
       Crude protein (%DM)         13.50    8.20   12.15    12.40     14.10    8.30   14.55   12.60   13.30    9.90   12.00   13.80
       Ether extract (%DM)         3.60    2.15    3.20     3.30      5.30    3.40    5.75    5.55    4.30    2.75    3.00    3.45
        Crude fiber (%DM)          22.25   32.60   22.20    21.80     22.30   33.50   21.60   23.00   25.35   36.70   35.00   29.65
           Ash (%DM)               4.85    5.80    4.25     4.25       5.20    4.25    4.90    5.00    5.15   3.30    3.00    4.10

                                 2.3. Emissions
                                      Total emissions were estimated for the farms, according to the main difference that
                                 is wheat production, i.e., NWC and WWC. The fuel combustion, electricity consumption,
                                 enteric emissions, crop residue emissions, manure management and the emissions due to
                                 chemical fertilization were considered.

                                 2.3.1. Enteric Emissions
                                      The Refinement (2019) of the Intergovernmental Panel on Climate Change (IPCC) [16,17]
                                 methodology was adopted, considering the relationship between gross energy intake and
                                 emissions. According to the updated IPCC guidelines for the specific factors within the
                                 Tier 2 method, Equation (2) was adopted.

                                                                   EF = [GE × (Ym/100) × x/55.56]                                   (2)

                                 where:
                                     EF = emission factor, kg, CH4 head−1 x−1 ;
                                     GE = gross energy intake, MJ head−1 , provided by different ingredients, expressed as
                                 dry matter;
Sustainability 2021, 13, 11108 7 of 20
Ym = methane conversion factor, percent of GE in feed converted to methane. Ym in
dairy buffaloes is assumed to be 6.5, as indicated in Table 10.12 (updated);
x = the mean period, expressed in days, assumed for each livestock category, 90,
270 and 365 days, respectively, for dry cows, lactating cows and heifers. The enteric
emissions of calves are not considered;
55.65 = the energy content of methane (MJ/kg CH4 ).
The data on the GE supplied by different feed sources (e.g., hay, straw and soybean
meal) were provided by INRAE [18]. The different percentages of feed were also considered
for the assessment of the GE.
2.3.2. Methane Emissions from Manure Management
As suggested by the Refinement (2019) of the IPCC methodology, the Tier 2 method
relies on two primary types of inputs that affect the calculation of methane emission
factors from manure: the manure characteristics and the animal waste management system
characteristics (AWMS). Equation (3) was also adopted to assess these emissions:
EF = (VST *x) × [ B0(T) × 0.67 * ΣS,k *MCFS,k /100 × AWMS(T,S,k) ] (3)
where:
EF = CH4 emission factor for livestock category T, kg CH4 animal−1 days−1 ;
VST = daily volatile solid excreted for livestock category T, kg dry matter animal−1 days−1 ;
x = basis for calculating annual VS production, days year−1 ;
B0(T) = maximum methane producing capacity for manure produced by livestock
category T, m3 CH4 kg−1 of VS excreted. IPCC guidelines suggest a default value of 0.10 for
dairy buffaloes (Table 10.16 (updated));
0.67 = conversion factor of m3 CH4 to kilograms CH4 ;
MCF(S,k) = methane conversion factors for each manure management system S by
climate region k, %. IPCC guidelines suggest a default value of 47% for animals kept in
a paddock without distinguishing by climatic areas and relative humidity (Table 10.17
(updated)).
AWMS(T,S,k) = fraction of livestock category T’s manure handled using manure man-
agement system S in climate region k, dimensionless. IPCC guidelines suggest default
values of 3, 34 and 63%, respectively, for paddock, slurry and solid management in Western
Europe (Table 10A.6 (updated)).
The VS content of manure and urine was estimated, in accordance with the Tier
2 method, with Equation (4) (updated):
VS = [GE × (1 − DE%/100) + (UE × GE)] × (1 − ASH/18.45) (4)
where:
VS = volatile solid excretion per day on a dry-organic matter basis, kg day−1 ;
GE = gross energy intake, MJ day−1 ;
DE% = digestibility rate of the feed. Different amounts of feed were also considered
for the assessment of the DE, also considering the livestock categories. Different feeding
periods were considered: from birth to the 90th day (weaning ration) and up to a year for
the calves; 365, 95 and 270 days for the heifers, dry and lactating cows. Similarly for the
GE, the data provided by INRAE [18] were adopted for the digestibility;
(UE × GE) = urinary energy expressed as fraction of GE. Typically, 0.04 GE can be
considered urinary energy excretion by most ruminants, and this value was adopted in the
current study;
ASH = the ash content of manure calculated as a fraction of the dry matter feed intake,
specifying the different sources, as indicated in Tables 3 and 4;
18.45 = conversion factor for dietary GE per kg of dry matter (MJ kg−1 ).Sustainability 2021, 13, 11108 8 of 20
2.3.3. N2 O Emissions from Manure Management
Although the IPCC guidelines indicate some criteria useful to assess nitrogen excre-
tion, we followed the approach reported by Romano et al. [7] because some studies showed
that buffaloes have a greater efficiency of N utilization compared with cattle [19,20]. Con-
sequently, we adopted the equations suggested by Patra et al. [21] aimed to estimate the
nitrogen excretion (urinary and fecal) in buffaloes. The N intake was counted by knowing
the crude protein amount distinguished by livestock categories and farms.
The N2 O emissions were then assessed adopting the IPCC 2019 guidelines [16,17].
Direct N2 O Emissions
As suggested by IPCC 2019 [15], the Tier 1A method was applied, adopting Equation (5)
(updated).
N2 OD (mm) = [ΣS [ΣT,P ((NT,P × NexT,P ) × AWMST,S,P ) + Ncdg(s)] × EF3S ] × 44/28 (5)
where:
N2 OD (mm) = direct N2 O emissions from manure management in the country,
kg N2 O year−1 , assuming for each livestock category 95, 270, and 365 days, respectively,
for dry and lactating cows, heifers and female calves;
N(T,P) = number of heads in each livestock category T on the farm, for production
system P;
Nex(T,P) = annual average N excretion per head of livestock category T, on the farm,
for production system P, previously assumed with the equation before;
AWMS(T,S,P) = fraction of total annual nitrogen excretion for each livestock category T
that is managed in the manure management system S in the country, also considering the
production system P (Tier 1A approach), dimensionless. These default values are provided
by Table 10A.6 (updated);
Ncdg(s) = annual nitrogen input via co-digestate in the country, kg N yr−1 , where the
system (s) refers exclusively to anaerobic digestion. Not included in this study;
EF3(S) = emission factor for direct N2 O emissions from the manure management
system S in the country, kg N2 O-N/kg N in the manure management system S; i.e., 0.01 and
0.002 for solid storage and paddock. These values are provided by Table 10.21 (updated)
for solid storage [16] and by Table 11.1 (updated) for paddock [17]. In particular, for this
manure management a value suggested for dry climates was adopted;
S = manure management system;
T = category of livestock;
44/28 = conversion of (N2 O-N) mm emissions to N2 O mm emissions.
Indirect N2 O Emissions
Specific equations are useful to estimate nitrogen losses; subsequently, these data will
be used to assess the indirect emissions due to volatilization and leaching. The Tier 1A
method is applied to estimate both losses and the following equations (Equations (6) and (7)
(updated)) are adopted to assess N due to leaching and volatilization, respectively:
NVOLATILIZATION-MMS = [ΣS [ΣT,P ((NT,P × NexT,P ) × AWMST,S,P ) + Ncdg(s) × FracgasMS(T,S) ]] (6)
NLEACHING-MMS = [ΣS [ΣT,P ((NT,P × NexT,P ) × AWMST,S,P ) + Ncdg(s) × FracleachMS(T,S) ]] (7)
where:
NVOLATILIZATION-MMS = amount of manure nitrogen that is lost due to the volatiliza-
tion of NH3 and NOx, assuming for each livestock category 95, 270 and 365 days, respec-
tively, for dry and lactating cows, heifers and female calves; kg N year−1 ;
NLEACHING-MMS = amount of manure nitrogen that is lost due to leaching, assuming
for each livestock category 95, 270 and 365 days, respectively, for dry and lactating cows,
heifers and female calves; kg N year−1 ;Sustainability 2021, 13, 11108 9 of 20
N(T,P) = number of heads in each livestock category T on the farm, for production
system P;
Nex(T,P) = annual average N excretion per head of livestock category T, on the farm,
for production system P;
AWMS(T,S,P) = fraction of total annual nitrogen excretion for each livestock category T
that is managed in the manure management system S in the country, also considering the
production system P (Tier 1A approach), dimensionless;
Ncdg(s) = annual nitrogen input via co-digestate in the country, kg N yr−1 , where the
system (s) refers exclusively to anaerobic digestion. Not included in this study;
P = productivity class, high or low, of the system (Tier 1A approach);
FracgasMS(T,S) = fraction of managed manure nitrogen for livestock category T that
volatilizes as NH3 and NOx in the manure management system S. The default value 0.12 is
provided by Table 10.22 (updated) and is adopted for solid storage for “other animals” [16];
FracleachMS(T,S) = fraction of managed manure nitrogen for livestock category T that
is leached from the manure management system S. The default value 0.02 is provided by
Table 10.22 (updated) and is adopted for solid storage for “other animals” [16].
The emissions of N2 O due to the volatilization and leaching of manure were assessed
with the following equations (Equations (8) and (9)), adopting the previously calculated
N losses:
N2 OG (mm) = (NVOLATILIZATION-MMS × EF4 ) × 44/28 (8)
N2 OL (mm) = (NLEACHING-MMS × EF5 ) × 44/28 (9)
where:
N2 OG (mm) = indirect N2 O emissions due to volatilization of N from manure manage-
ment in the farm, assuming for each livestock category 95, 270 and 365 days, respectively,
for dry and lactating cows, heifers and female calves, kg N2 O year−1 ;
EF4 = emission factor for N2 O emissions from atmospheric deposition of nitrogen
on soils and water surfaces, kg N2 O-N (kg NH3 -N + NOx-N volatilized)−1 . The default
value is 0.005 (dry climate) kg N2 O-N (kg NH3 -N + NOx-N volatilized)−1 and is given in
Chapter 11, Table 11.3 (updated) [17].
N2 OL (mm) = indirect emissions due to leaching and runoff from manure management
in the farm, assuming for each livestock category 95, 270 and 365 days, respectively, for dry
and lactating cows, heifers and female calves, kg N2 O year−1 ;
EF5 = emission factor for N2 O emissions from nitrogen leaching and runoff, kg N2 O-N/kg
N leached and runoff. The default value of 0.011 kg N2 O-N (kg N leaching/runoff)−1 is
given in Chapter 11, Table 11.3 (updated) [16].
2.3.4. Ammonia
The ammonia emissions provided by the livestock were also calculated. In agreement
with other studies [7,22], the emission factor 17/14 was adopted to estimate the NH3
amount pertinent to each farm.
2.3.5. CO2 Emissions from Livestock, Emissions from Crop, Soil Residues and
Synthetic Fertilizers
The CO2 emissions from livestock were not estimated because the annual net CO2
emissions are assumed to be zero as the CO2 photosynthesized by plants is returned
to the atmosphere as respired CO2 [16]. N2 O and CO2 emissions from soils and crop
residues are included in each crop input selected in the SimaPro database, although several
categories were modified and accordingly loaded. The N2 O emissions provided by urea
and ammonium nitrate were also considered with Tier 2 and Tier 1 methods, respectively,
for direct and indirect emissions, distinguished by the following equations:
N2 ODIRECT -N = (FSN × EF1i ) (10)
where:Sustainability 2021, 13, 11108 10 of 20
N2 ODIRECT -N = direct N2 O–N emissions from N inputs provided by urea and ammo-
nium nitrate applied to the soils, kg N2 O–N year−1 ;
FSN = annual amount of synthetic fertilizer N applied to soils, kg N year−1 ;
EF1i = emission factor for N2 O emissions from N inputs, kg N2 O–N (kg N input)−1 .
The default value for dry climates is available in Table 11.1 (updated) [17].
N2 OATD -N = (FSN × FracGASF ) × EF4 (11)
where:
N2 OATD -N = indirect amount of N2 O–N produced from atmospheric deposition of N
volatilized from managed soils, kg N2 O–N year−1 ;
FSN = annual amount of synthetic fertilizer N applied to soils, kg N year−1 ;
FracGASF = fraction of synthetic fertilizer N that volatilizes as NH3 and NOx, kg N
volatilized (kg of N applied)−1 . In Table 11.3 (updated), the default values for urea and
ammonium nitrate-based emissions are available (0.15 and 0.05, respectively) [17];
EF4 = emission factor for N2 O emissions from atmospheric deposition of N on soils and
water surfaces, [kg N–N2 O (kg NH3 –N + NOx–N volatilized)−1 ], available in Table 11.3
(updated) for dry climate, i.e., 0.005 [16].
N2 OLEACH-N = (FSN × Frac LEACH ) × EF5 (12)
N2 O LEACH-N = indirect amount of N2 O–N produced from leaching and runoff of N
additions to managed soils where leaching/runoff occurs, kg N2 O–N year−1 ;
FSN = annual amount of synthetic fertilizer N applied to soils, kg N year−1 ;
Frac LEACH-N = fraction of all N added to managed soils in regions where leach-
ing/runoff occurs that is lost through leaching and runoff, kg N (kg of N additions)−1 .
In Table 11.3 (updated), the default value is 0.24 [17];
EF5 = emission factor for N2 O emissions from N leaching and runoff, kg N2 O–N
(kg N leached and runoff)−1 . The default value is 0.11 in Table 11.3 (updated) [17].
The conversion of N2 O–N emissions to N2 O emissions was obtained by the following
equation:
N2 O = N2 O-N × 44/28 (13)
2.3.6. Emissions from Electricity and Diesel Fuel
The CO2 equivalents, provided by the combustion of fossil fuels and from electricity
use, were estimated considering the amount of diesel fuel and the kWh of electricity
consumed for farm operations. The consumption and emission factor of natural gas
adopted in the farms was excluded. The amount of purchased diesel was quantified
through interviews, such as the electricity consumption. As suggested by ENAMA [23],
a standard value of 0.85 kg per liter as diesel density and a 3.13 eq. emission factor
to estimate CO2 release from the combustion of 1 kg of diesel were adopted. As for the
electricity mix, we used the Italian emission factor (0.47 eq.) adopted in other studies [1,4,7].
2.4. Impact Assessment and Software
The software SimaPro 8.01 PhD, Pré Consultants 2015 was employed to estimate the
environmental impacts. Two methods were adopted to assess the impact categories: (i) EPD
2013 for GWP, computed according to the CO2 equivalent factors in a 100-year time horizon,
Acidification Potential (AP, g SO2 eq) and Eutrophication Potential (EP, g PO4 3- eq), and (ii)
ReCiPe Midpoint (H) for Agricultural Land Occupation (ALO, m2 y) and Water Depletion
(WD, m3 ) [13,24,25]. Table 5 shows the impact categories and the characterization factors
used to evaluate the potential environmental burden assessed with the EPD 2013 method.Sustainability 2021, 13, 11108 11 of 20
Table 5. Characterization factors of the main elementary flows of the impact categories investigated with EPD 2013.
Category Main Elementary Flow Characterization Factor Source
CO2 1
Global Warming Potential,
CH4 28 IPCC 2019 [15]
kg CO2 eq
N2 O 265
NH3 1.6
Acidification, kg SO2 eq NOx 0.76 Huijbregts 1999 [25]
SO2 1.2
NO3 0.1
Eutrophication, kg PO4 3 eq
P2 O3 3.06 Heijungs et al. 1992 [26]
As indicated by Gerssen-Gondelach et al. [27], Agricultural Land Occupation (ALO) is
defined as the area of land needed to produce the FU chosen—in our research, 1 kg FPCM
provided by buffalo. When the land occupation is not directly available with the inventory
analysis of a study, these authors suggested the following equation:
m2 /kg FPCM = total grassland or cropland requirement (Ha) × 10,000 (m2 )/kg FPCM (14)
SimaPro Pré Consultants, thanks to the ReCiPe method, allows us to investigate the
Water Depletion (WD), processing the raw materials based on studies about water scarcity
(WS), water stress index (WSI) and water productivity. The main algorithms adopted in
the software, developed by Hoekstra [28,29], considered the environmental relevance of
water productivity and the water footprint in water-rich areas.
3. Statistical Analysis
We calculated the GWP, AC, EU, ALO and WD of each farm using the LCA model.
Then, these data were analyzed by one-way (general linear model procedure) ANOVA,
using the production system as an independent variable. The data were analyzed using the
“stats” package of R software [30], and then the Tukey test was adopted, developed with the
LTukey function of the “laercio” R package [31]. In agreement with Silva and Azevedo [32],
the Tukey test was chosen for carrying out the comparison test as it is characterized by
greater rigor than other post hoc statistical comparison tests and has a greater control of
type I error.
4. Results and Discussion
Buffalo dairy farms also produce meat and crop commodities, thus the environmental
impact should be shared among the co-products [33]. According to other studies focused
on bovine milk and meat [7,24,34], the allocation criterion was adopted. In particular,
the economic allocation resulted in a more suitable strategy applicable for buffalo farms.
In agreement with Pirlo et al. [11], in this study, the economic allocation criterion was
applied, which was preferred to mass allocation because it better represents the societal
cause of buffalo farm environmental impacts.
4.1. Role of the Allocation
The economic allocation mitigated the impacts, mainly in the WWC system. This cri-
terion was applied to determine the weight of the co-products, avoiding the expansion of
system boundaries. The inputs related to the crop (seeds, land, fuels and agrochemicals)
were loaded into the software without lightening them when considering straw, which is
always reused (in WWC1, WWC2 and WWC3) as feed or litter. In the three WWC farms,
all the grain is sold as food for human consumption and all the straw is reused, and the
overproduced straw is stored as farm stock. As previously indicated, the meat provided by
male calves was excluded, whereas culled cows were involved in both systems. As reportedSustainability 2021, 13, 11108 12 of 20
by Mahath et al. [35], the following equation was adopted to subtract the equivalents from
the functional unit (FU):
AFeco = (Veco × P)milk /Σ (Veco × P)milk, wheat grain, live weight culled cows (15)
where:
AF is the allocation factor;
Veco is the economic value (EUR/kg);
P is the total production on-farm (kg/year), milk as FPCM, wheat as harvested grain
without straw; live-weight cattle as culled cows only.
The economic values of the milk, wheat grain and culled cows were obtained from
interviews with the owners and were applied to evaluate the economic allocation. Economic
values, mass amounts and percentages are reported in Table 6.
Table 6. Yields and economic incomes (%) derived from milk, wheat grain and culled cows (No Wheat Crop, NWC; With
Wheat Crop, WWC).
NWC1 NWC2 NWC3 NWC Mean WWC1 WWC2 WWC3 WWC Mean
Milk income EUR/kg 1.60 1.60 1.55 1.58 1.50 1.50 1.60 1.53
Milk yield/year kg 254,405 370,400 481,800 368,868 146,000 438,000 470,850 351,617
Total milk income EUR 407,050 592,640 746790 582,160 219,000 657,000 752930 542,977
Wheat income EUR/kg - - - - 0.33 0.30 0.27 0.30
Wheat yield/year kg - - - - 75,000 450,000 332,000 285,670
Total wheat income EUR - - - - 24,750 135,000 89,775 83,175
Culled cows income
300 300 300 300 300 300 300 300
EUR/head
Culled cows head/year 8 20 25 18 5 16 16 12
Total culled cows income
2400 6000 7500 5300 1500 4800 4800 3700
EUR
Milk income % 99.41 99.00 99.01 99.14 89.30 82.45 88.85 86.86
Wheat income % 0.00 0.00 0.00 0.00 10.09 16.94 10.59 12.54
Culled cows income % 0.59 1.00 0.99 0.86 0.61 0.60 0.57 0.59
4.2. LCA Categories. Results and Discussion
Table 7 shows the cradle-to-farm-gate life cycle results, related to the two different
systems, i.e., NWC and WWC. The WWC group showed a total self-sufficiency in hay
and straw supply, and in particular, the absence of purchased straw is related to the
wheat crop. This arable area has significantly affected the Agricultural Land Occupation
category as the production of wheat crop needs adequate land requirements. Additionally,
WWC systems could also allow a significant reduction in eutrophication. These impacts
exert a relevant effect on farm management, as shown by the PCA biplot (Figure 3), where
the three WWC farms are grouped close together in the second quadrant. Although
Berlese et al. [1] attributed to eutrophication a larger contribution of purchased feed than
crops, in this study, the higher PO4 3- equivalents shown by the NWC system seem to
find an explanation in the wider use of maize silage. Indeed, the comparison between
NWC2/3 and WWC2/3 highlights the administration of corn silage in the NWC farms to
all the livestock categories (Tables 3 and 4).Sustainability 2021, 13, x FOR PEER REVIEW 15 of 22
Sustainability 2021, 13, 11108 13 of 20
SYSTEM Table 7. DescriptiveGWP
FARMS characteristics AC EU
and Tukey’s test. ALO WD
kg CO2-eq g SO2-eq g PO43—eq m2y−1 m3
GWP AC EU ALO WD
SYSTEM FARMS NWC1 kg CO2 eq 4.65 g SO eq50.23 g PO 13.27
3- 8.52
2 y−1 2.26 m3
2 4 eq m
No Wheat Crop NWC2 5.14 39.96 14.42 10.64 1.55
NWC1 4.65 50.23 13.27 8.52 2.26
NWC3 4.95 37.81 15.62 11.56 1.56
No Wheat Crop NWC2 5.14 39.96 14.42 10.64 1.55
NWC3 mean NWC4.95 4.91a 37.81 42.66a 14.43a
15.62 10.24b
11.56 1.79a1.56
mean NWCstandard deviation
4.91a 0.24 42.66a 6.63 1.17
14.43a 1.56
10.24b 0.411.79a
standard deviation 0.24 6.63 1.17 1.56 0.41
WWC1 5.30 38.07 11.73 13.70 1.84
With Wheat Crop WWC1 WWC2 5.30 5.51 38.07 30.75 11.21
11.73 15.69
13.70 1.571.84
With Wheat Crop WWC2 WWC3 5.51 4.75 30.75 39.24 11.21
12.17 15.69
15.04 1.651.57
WWC3 4.75 39.24 12.17 15.04 1.65
mean WWC 5.19a 36.02a 11.70b 14.81a 1.69a
mean WWC 5.19a 36.02a 11.70b 14.81a 1.69a
standard deviation
standard deviation 0.39 0.39 4.60 4.60 0.480.48 1.01
1.01 0.140.14
NWC1
WWC1 WWC
WWC2
WWC3
NWC
NWC3
NWC2
Figure
Figure 3. Biplot
3. Biplot of the
of the PCA PCA analysis
analysis with
with thethe centroids
centroids ofofthe
thetwo
twogroups.
groups.Centroids
Centroids are
are shown
shown by
by bold
boldboxes
boxesasasWWC
WWC and
NCW,and NCW, respectively.
respectively.
The multivariate analysis of the main components has shown how the choice of the
The multivariate analysis of the main components has shown how the choice of the
variables that describe the present study, and which are represented by the LCA de-
variables that describe the present study, and which are represented by the LCA descriptors
scriptors (GWP, AC, EU, ALO, WD), allows us to obtain two main components that ex-
(GWP, AC, EU, ALO,
plain altogether WD),
almost 90%allows
of the us to obtainoftwo
variability the main
overallcomponents that explain
dataset. In particular, thealtogether
first
almost
component, set as the horizontal axis of the biplot, explains 65.2% of the overall variability, set as
90% of the variability of the overall dataset. In particular, the first component,
while
the the second
horizontal axiscomponent, setexplains
of the biplot, as the vertical
65.2%axis of the
of the biplot,
overall explains 24.3%
variability, while of
thethesecond
overall variability.
component, set as the vertical axis of the biplot, explains 24.3% of the overall variability.
Thebiplot
The biplotobtained
obtainedfrom
from the
the PCA
PCA analysis
analysis (Figure
(Figure 3)3) allows
allowsus usto
toobserve
observethat
thatthe
the two
two variables
variables that clearly
that clearly discriminate
discriminate the observed
the observed farmsfarms
are are
the the
ALOALOandandthethe GWP,
GWP, placing
the WWC farms on the right of the floor, well separated from the NWC farms on the left of
the floor. The first farms are in fact characterized by higher ALO and GWP values than the
second group.
Regarding the second component, we observed an influential effect of the EU variable
between two NWC farms for higher values than WWC farms, creating a vertical separation.Sustainability 2021, 13, 11108 14 of 20
Therefore, in the upper part of the biplot there are farms with lower EU values, while in the
lower part of the biplot there are farms with higher EU values. In the upper left part, there
is a farm belonging to the NWC group, which differs for higher values of WD and AC, but it
must be remembered that the statistical analysis of variance did not show such statistically
significant differences. The analysis then places the position of the centroids, defined as
points whose coordinates are the average of the coordinates of the group elements obtained
from the diametrically opposite components, top right for WWC farms and bottom left for
NWC farms.
GWP: The impact on climate change was assessed using the IPCC characterization
factors for the 100-year time horizon, according to the EDIP (2013) method, adopted in
the study. As for climate stability, permanent grasslands store nearly as much carbon as
forests (EIP-AGRI 2014) [36], and the carbon sequestration potential of permanent pastures
was estimated between 0.01 and 0.3 Gt (gross tons of volume) C year−1 [37,38], but all the
farms involved in our research were without pasture. On other hand, the crop, field and
fertilizer emissions were assessed with equations provided by IPCC guidelines [17].
Usually, the impacts are influenced by the weight of the functional unit (FU); for
example, Berlese et al. [1] found a GWP of 6.4 kg CO2 eq per kg of FPCM, higher than
values reported by Pirlo et al. [11] (5.1 kg CO2 eq per kg of FPCM) and also higher
than our values (4.91 and 5.19 kg CO2 eq for NWC and WWC, respectively). Indeed,
the milk production observed by Berlese et al. [1] was 1409 kg FPCM/buffalo per lactation,
in comparison to the mean value showed by Pirlo et al. [11] of 2251 kg FPCM/buffalo per
lactation—a comparable amount with ours (2866 and 2000 kg FPCM/buffalo per lactation,
respectively, for NWC and WWC systems). As suggested by Gerber et al. [39], the milk
production of a farm is a crucial parameter because, in general, high productivity reduces
environmental impact. Although NWC farms showed a higher milk yield than WWC
farms, the CO2 equivalents were not affected.
AC: In this study, no significant differences were found between the two systems.
The values obtained in this study were very similar to those reported by Berlese et al. [1]
(37.3 ± 3.97 g SO2 eq), and lower than those reported by Pirlo et al. [11] (65 g SO2 ), where
all the farms were corn silage-based.
A study focused on dairy buffaloes [4] compared a pasture-based system with a
confined rearing system, showing that the main contribution for SO2 equivalents was
derived from the production of maize silage in the confined system. In agreement with
these authors, our research showed that, despite the absence of differences between NWC
and WWC farms for acidification potential, the higher trend for mean, minimum and
maximum values in NWC farms could be explained by significant inputs related to the
maize crop.
In the no-pasture-based system, the ammonium was identified by the authors as the
first polluting substance followed by SO2 and NOX . Even though the research investi-
gated bovine milk, Guerci et al. [40] found for grazing cattle (pasture only) very low SO2
equivalents—7.44 g. This result may be attributed to the low use of inorganic fertilizers in
pasture-based systems.
In addition, although the emissions of ammonia from manure management are recog-
nized as significant contributors to acidification [4,41], the farms investigated in this study
showed comparable manure handling, and the highest values observed in the NWC1 farm
suggested a clarification. Research focused on dairy cattle [42] highlighted that the con-
tributions to acidification were spilt among feed productions (both on- and off-farm),
with a share of 31–57%. Moreover, Bragaglio et al. [12] found that the largest source of
SO2 equivalents is the production of concentrates. The purchasing of off-farm feed (total
amount of concentrates, alfalfa hay, straw and more than 50% of hay meadow) concerning
the NWC1 farm would explain the high AC value. In Figures 4 and 5, an explanatory
comparison of feed sources between NWC1 and WWC1, the two farms without corn silage,
is also given.feed (total amount of concentrates, alfalfa hay, straw and more than 50% of hay meadow)
concerning the NWC1 farm would explain the high AC value. In Figures 4 and 5, an ex-
planatory comparison of feed sources between NWC1 and WWC1, the two farms without
Sustainability 2021, 13, 11108 15 of 20
corn silage, is also given.
Sustainability 2021, 13, x FOR PEER REVIEW 18 of 22
Figure4.
Figure 4. The
The graphs
graphs show
show the
the different
different percentage
percentage compositions
compositions of
of diets
diets (lactating
(lactating cows,
cows, LC;
LC; heifers,
heifers, HF;
HF; dry
dry cows,
cows, DC)
DC) in
in the
the NoNo Wheat
Wheat Crop
Crop 1 (NWC1)
1 (NWC1) farm.
farm.
Figure 5. The
Figure graphs
5. The show
graphs thethe
show different percentage
different percentagecompositions
compositionsofofdiets
diets(lactating
(lactating cows, LC; heifers,
cows, LC; heifers,HF;
HF;dry
drycows,
cows,DC)
DC) in
in the With Wheat Crop 1 (WWC1) farm.
the With Wheat Crop 1 (WWC1) farm.
EU: This LCA descriptor, related to acidification, is affected by the conduction system
and by environmental conditions, such as temperature, relative humidity or rainfall. Table
7 suggests that NWC farms showed significantly (p < 0.05) higher values (14.43 g PO43—
eq) than WWC farms (11.70 g PO43—eq), which showed a more homogenous profile as a
system (Figure 3). Sabia et al. [41] identified a functional unit (FU) of 1 kg of weight gainSustainability 2021, 13, 11108 16 of 20
EU: This LCA descriptor, related to acidification, is affected by the conduction system
and by environmental conditions, such as temperature, relative humidity or rainfall. Table 7
suggests that NWC farms showed significantly (p < 0.05) higher values (14.43 g PO4 3- eq)
than WWC farms (11.70 g PO4 3- eq), which showed a more homogenous profile as a system
(Figure 3). Sabia et al. [41] identified a functional unit (FU) of 1 kg of weight gain in
the period needed to reach the age of puberty in buffalo heifers and compared animals
kept in the pasture or in confinement. They reported higher values of eutrophication
potential (g PO4 3- ) in the confined system. Similar findings, although focused on marine
eutrophication (g N equivalents), were also reported by other authors [4]. The authors
explained the different impacts because the main source of pollution was the production of
corn silage, as also observed in dairy cattle by Bartl et al. [43].
As indicated in the third PCA biplot quadrant (Figure 3), the NWC2 and NWC3 farms,
producing corn silage, are characterized by high PO4 3- equivalents. In comparison with
NWC corn silage-based farms, WWC farms showed a different administration of this
forage. In NWC2 and NWC3 farms, all the livestock categories are feed with corn silage,
whereas in the WWC2 farm this is provided to lactating cows, heifers and young animals.
Finally, in the WWC3 farm its administration is reserved only for lactating cows.
ALO: Table 7 shows that lower values were found in the NWC system (p < 0.05)
compared to the WWC system. Many studies estimated the land use (LU), land use change
(LUC) or the agricultural land occupation (ALO) impacts of organic vs. conventional
or pasture-based vs. confined farming modes. Often, impact categories show higher
values in organic or pasture-based systems, as the low yields (milk and forages) and
management efficiency partially explain these results [7,43,44]. In this research, mean yields
in NWC and WWC farms of 2866 and 2000 kg FPCM/buffalo per lactation, respectively,
were recorded. In addition, WWC farms showed the lowest milk production, as shown in
Table 2. The arable land of these farms is characterized by a high extent required for wheat
crop (38, 66 and 35% for WWC1, WWC2 and WWC3, respectively); moreover, the fodder
self-supply is also ensured by a significant hay area. Finally, the low number of lactating
cows in the three WWC farms (Table 1), in addition to explaining the low productions,
would suggest a less specialized management compared to the NWC mode. This aspect
needs to be confirmed with studies involving a larger number of farms.
The adoption of economic allocation, useful to subtract the pollutants attributable to
the co-produced wheat grain, has not allocated enough m2 year−1 equivalents, such as to
identify the WWC system neither equally nor less impacting than the NWC one.
WD: This LCA category should be considered from a global perspective, since fresh-
water is a global resource, with growing global freshwater demand while global freshwater
availability is limited [29]. In agreement with this framework, several studies are focused
on the water footprint, distinguishing green water, blue water and grey water.
In our research, no significant differences were found comparing the NWC and the
WWC system (1.79 ± 0.41 vs. 1.69 ± 0.14 m3 ). Sabia et al. [4] stated that no data are
available on WD in dairy buffaloes, while conflicting results are available for dairy cattle.
In Noord-Brabant (Netherlands), De Boer et al. [45] observed that 66 l of consumptive water
was needed for 1 kg of FPCM, whereas at world level a water footprint of 1207 m3 /ton
of milk [46] and a consumption of 544 l per 1 kg di FPCM [45] have been reported. In the
other impact categories, dairy buffaloes [11] showed impacts 4-fold higher than dairy
cattle [40] due to their lower milk production (roughly 4-fold lower even in terms of
FPCM), even though input levels and categories and animal and farm dimensions were
roughly similar.
In agreement with these studies [11,41], other authors found [47–50], in a similar
Mediterranean environment, comparable results (0.38–0.55 m3 and 0.52 m3 per kg bovine
FPCM, respectively), with a 4-fold ratio.
In the PCA biplot (Figure 3), the NWC1 farm showed, as indicated in Table 7, a differ-
ent profile from the other NWC farms, with lower m3 equivalents. Despite the absence of
irrigated crops (corn), WD could be explained by information acquired from the interviews:Sustainability 2021, 13, 11108 17 of 20
drinking water (human use) was indicated as an exclusive source, also adopted to clean
the milking parlor. Although the NWC1 and WWC1 farms are characterized by a total
absence of crop sources of grain (e.g., oat, barley, maize), additionally the NWC1 farm
suffers from a lack of self-supply of forages (all the alfalfa and almost 50% of meadow hay
were purchased).
5. Conclusions
This work performed an LCA of buffalo dairy farms, selected for similar general char-
acteristics but different farming managements. A proportion of 1:2 of no maize silage and
with maize silage was chosen as a system profile for both NWC and WWC farms. The main
goal was the environmental impact assessment of dairy buffalo farming, according to
forage self-sufficiency and combination with wheat crop production. WWC farms were
characterized by a high availability of wheat straw, adopted as litter and administrated
as fodder. In addition, a large arable area ensured a significant amount of hay; therefore,
it was necessary to only purchase concentrates. The excess of straw and hay was managed
with storage and, considering their low economic value, the allocation of the surplus would
probably not have subtracted pollutants from the functional unit, i.e., FPCM. The produc-
tions of wheat crop entail adequate land requirements and the low milk yield observed in
the WWC farms probably exacerbated the high values of Agricultural Land Occupation in
agreement with other studies.
Interestingly, a high land occupation and low production, widespread in Mediter-
ranean pasture-based systems, are often characterized by poor nutritional values of
grazing grass.
The ALO results suggest that full self-sufficiency of forages would not be enough to
describe a virtuous profile of the farms. Probably higher hay yields would have allowed
the farms to obtain lower values of land occupation.
In order to estimate the possible reduction in the emissions due to the modification
of some input variables, the performed analysis considers the possibility of reducing the
fertilizers used in the agricultural stage. In particular, precision agriculture would allow
targeted fertilization, leading to a reduction in the amount of agrochemicals for similar
yields; a possible additional step could be to distinguish the different stages (tillage, fertil-
ization, harvesting) with respect to the overall impact (midpoint categories). Afterwards,
the base case could be compared with the improved scenario according to the normalized
ReCiPe endpoint categories.
The PO4 3 equivalents (EU) seemed to be mainly conditioned by the feeding strategies.
Although in the life cycle assessment the impacts are often mitigated by high FU yields,
this trend has not been highlighted in eutrophication.
As reported, dairy systems are often multifunctional processes; however, the al-
location of by-products does not always mitigate the impacts. In particular, this study
showed that a high availability of forages may have mitigated eutrophication (WWC farms),
but it may have more heavily affected another disputed impact category: Agricultural
Land Occupation.
Author Contributions: Conceptualization, P.D.P. and A.B.; methodology, A.B. and F.T.; software,
A.B., E.R. and A.M.; validation, P.D.P. and E.R.; formal analysis, F.T. and E.R.; investigation, A.B.;
resources, P.D.P. and A.M.; data curation, E.R.; writing—original draft preparation, E.R., P.D.P., F.T.,
A.M. and A.B.; writing—review and editing, F.T., E.R. and A.B.; visualization, P.D.P.; supervision,
A.M. and F.T.; project administration, P.D.P. and A.B.; funding acquisition, A.B. All authors have read
and agreed to the published version of the manuscript.
Funding: Andrea Bragaglio’s research activity is granted by the European Union and Italian Ministry
of Education, University and Research in the program PON 2014–2020 Research and Innovation,
framework Attraction and International Mobility-1839894, Activity 1. The project was approved by
the Italian Ministry of Education, University and Research.
Institutional Review Board Statement: Not applicable.Sustainability 2021, 13, 11108 18 of 20
Informed Consent Statement: Not applicable.
Data Availability Statement:
a) CLAL, 2019. Production of Mozzarella di Bufala Campana PDO. Italy. https://www.clal.it/
index.php/section=mozzarella_bufala_campana (accessed on 5 August 2021).
b) FAOSTAT, 2020. www.fao.org/faostat/en/#data (accessed on 5 August 2021).
c) INRAE, www.inrae.fr. https://mediatheque.inrae.fr/ (accessed on 5 August 2021).
d) ENAMA, 2005. Handbook of fuel consumption for agricultural subsidized use (Prontuario
dei consumi di carburante per l’impiego agevolato in agricoltura). Available from: http://www.
enama.it/php/pageflip.php_pdf_enama_int_prontuario.pdf&dir/it/pdf/monografie (accessed
on 5 August 2021).
e) R Core Team. R: A Language and Environment for Statistical Computing; R Foundation for
Statistical Computing: Wien, Österreich, 2019; Available online: https://www.R-project.org/
(accessed on 15 August 2021).
f) Laercio Junio da Silva. laercio: Duncan Test, Tukey Test and Scott-Knott Test. R Package
Version 1.0-1. 2010. Available online: https://CRAN.R-project.org/package=laercio (accessed
on 15 August 2021).
Acknowledgments: The authors are grateful to Giovanna Calzaretti and Francesco Giannico for their
technical support. The authors are grateful to Laura Maresca, veterinary surgeon.
Conflicts of Interest: All authors declare that they do not have any conflicts of interest that could
inappropriately influence this manuscript.
References
1. Berlese, M.; Corazzin, M.; Bovolenta, S. Environmental sustainability assessment of buffalo mozzarella cheese production chain:
A scenario analysis. J. Clean. Prod. 2019, 238, 117922. [CrossRef]
2. Borghese, A. Buffalo livestock and products in Europe. Buffalo Bull. 2013, 32, 50–74.
3. CLAL, 2019. Production of Mozzarella di Bufala Campana PDO. Italy. Available online: https://www.clal.it/index.php/section=
mozzarella_bufala_campana (accessed on 5 August 2021).
4. Sabia, E.; Napolitano, F.; Claps, S.; De Rosa, G.; Braghieri, A.; Pacelli, C. Dairy buffalo life cycle assessment as affected by heifer
rearing system. J. Clean. Prod. 2018, 192, 647–655. [CrossRef]
5. Pirlo, G. Cradle-to-farm gate analysis of milk carbon footprint: A descriptive review. Ital. J. Anim. Sci. 2012, 11, e20. [CrossRef]
6. Mu, W.; Van Middelaar, C.E.; Bloemhof, J.M.; Engel, B.; De Boer, I.J.M. Benchmarking the environmental performance of
specialized milk production systems: Selection of a set of indicators. Ecol. Indic. 2017, 72, 91–98. [CrossRef]
7. Romano, E.; Roma, R.; Tidona, F.; Giraffa, G.; Bragaglio, A. Dairy farms and Life Cycle Assessment (LCA). The allocation criterion
useful to estimate undesirable products. Sustainability 2021, 13, 4354. [CrossRef]
8. ISO 14040, Environmental Management—Life Cycle Assessment—Principles and Framework; International Organization for Standardiza-
tion ISO Central Secretariat Chemin de Blandonnet, 8CP 401—1214 Vernier; ISO: Geneva, Switzerland, 2006.
9. ISO 14044, Environmental Management—Life Cycle Assessment—Requirements and Guidelines; International Organization for Standard-
ization ISO Central Secretariat Chemin de Blandonnet, 8CP 401—1214 Vernier; ISO: Geneva, Switzerland, 2006.
10. Di Palo, R. Produzione di Latte Nella Bufala con Diete Tradizionali e con l’impiego di Acidi Grassi. Ph.D. Thesis, University of
Naples, Naples, Italy, 1992.
11. Pirlo, G.; Carè, S.; Fantin, V.; Buttol, P.; Terzano, G.M.; Masoni, P.; Pacelli, C. Factors affecting life cycle assessment of milk
produced on 6 Mediterranean buffalo farms. J. Dairy Sci. 2014, 97, 6583–6593. [CrossRef]
12. PRe Consultants, 2013. Introduction to LCA with SimaPro. Available online: www.pre-sustainability.com/download/SimaPro8
IntroductionToLCA.pdf (accessed on 16 August 2021).
13. Bragaglio, A.; Napolitano, F.; Pacelli, C.; Pirlo, G.; Sabia, E.; Serrapica, F.; Serrapica, M.; Braghieri, A. Environmental impacts of
Italian beef production: A comparison between different systems. J. Clean. Prod. 2018, 172, 4033–4043. [CrossRef]
14. FAOSTAT. 2020. Available online: www.faofaostat/en/#data (accessed on 5 August 2021).
15. Nguyen, T.L.T.; Hermansen, J.E.; Mogensen, L. Environmental consequences of different beef production systems in the EU.
J. Clean. Prod. 2010, 18, 756–766. [CrossRef]
16. IPCC. Chapter 10: Emissions from livestock and manure management. In Agriculture, Forestry and Other Land Use; Refinement
to the 2006 IPCC Guidelines for National Greenhouse Gas Inventories; IPCC: Geneva, Switzerland, 2019; Volume 4, pp. 1–87.
Available online: https://www.ipcc-nggip.iges.or.jp/public/2019rf/pdf/4_Volume4/19R_V4_Ch10_Livestock.pdf (accessed on
5 August 2021).
17. IPCC. Chapter 11: N2 O emissions from managed soils, and CO2 emissions from lime and urea application. In Agriculture,
Forestry and Other Land Use; Refinement to the 2006 IPCC Guidelines for National Greenhouse Gas Inventories; IPCC: Geneva,
Switzerland, 2019; Volume 4, pp. 1–54. Available online: https://www.ipcc_nggip.iges.or.jp/public/2019rf/pdf/4_Volume4/1
9R_V4_Ch11_Soils_N2O_CO2.pdf (accessed on 5 August 2021).You can also read