Daisen: A Framework for Visualizing Detailed GPU Execution - arXiv
←
→
Page content transcription
If your browser does not render page correctly, please read the page content below
Eurographics Conference on Visualization (EuroVis) 2021                                                                                  Volume 40 (2021), Number 3
                                        R. Borgo, G. E. Marai, and T. von Landesberger
                                        (Guest Editors)

                                                Daisen: A Framework for Visualizing Detailed GPU Execution

                                                           Yifan Sun1         , Yixuan Zhang2          , Ali Mosallaei3       , Michael D. Shah4         , Cody Dunne4   , and David Kaeli4

                                                                       1   William & Mary, 2 Georgia Institute of Technology, 3 Lexington High School, 4 Northeastern University
arXiv:2104.00828v1 [cs.DC] 2 Apr 2021

                                                                    Part A. Filter box     Part B. Primary Y-Axis       Part C. Secondary Y-Axis
                                                                   Filter component        Select a primary metric to   Select a second metric to plot
                                                                   name(s) to allow for    plot the performance         the performance metric
                                                                   search and compare      metric versus time           versus time for comparison

                                                                                                                                                                                       (B) Task View

                                                                                                                                                                                 (C) Component View

                                          (A) Overview                                                                                                                                                 (D) Legend

                                        Figure 1: Daisen provides a web-based interactive visualization tool that enables the examination of GPU execution traces. (A) The Overview
                                        Panel shows key performance metrics against time of all hardware components using small multiples, (B) the Task View demonstrates the
                                        hierarchical relationships between tasks, (C) the Component View displays all the tasks executed in a hardware component (after selecting
                                        one component of interest from the Overview), and (D) the legend bar shows all the tasks involved in the Component View and the Task View
                                        with color encoded. Note that the labels ABCD do not appear on the visualization interface.

                                                 Abstract
                                                 Graphics Processing Units (GPUs) have been widely used to accelerate artificial intelligence, physics simulation, medical
                                                 imaging, and information visualization applications. To improve GPU performance, GPU hardware designers need to identify
                                                 performance issues by inspecting a huge amount of simulator-generated traces. Visualizing the execution traces can reduce the
                                                 cognitive burden of users and facilitate making sense of behaviors of GPU hardware components. In this paper, we first formalize
                                                 the process of GPU performance analysis and characterize the design requirements of visualizing execution traces based on
                                                 a survey study and interviews with GPU hardware designers. We contribute data and task abstraction for GPU performance
                                                 analysis. Based on our task analysis, we propose Daisen, a framework that supports data collection from GPU simulators and
                                                 provides visualization of the simulator-generated GPU execution traces. Daisen features a data abstraction and trace format
                                                 that can record simulator-generated GPU execution traces. Daisen also includes a web-based visualization tool that helps GPU
                                                 hardware designers examine GPU execution traces, identify performance bottlenecks, and verify performance improvement.
                                                 Our qualitative evaluation with GPU hardware designers demonstrates that the design of Daisen reflects the typical workflow
                                                 of GPU hardware designers. Using Daisen, participants were able to effectively identify potential performance bottlenecks and
                                                 opportunities for performance improvement. The open-sourced implementation of Daisen can be found at gitlab.com/akita/vis.
                                                 Supplemental materials including a demo video, survey questions, evaluation study guide, and post-study evaluation survey are
                                                 available at osf.io/j5ghq.
                                                 CCS Concepts
                                                 • Computer systems organization → Single instruction, multiple data; • Human-centered computing → Information visu-
                                                 alization;

                                        © 2021 The Author(s)
                                        Computer Graphics Forum © 2021 The Eurographics Association and John
                                        Wiley & Sons Ltd. Published by John Wiley & Sons Ltd.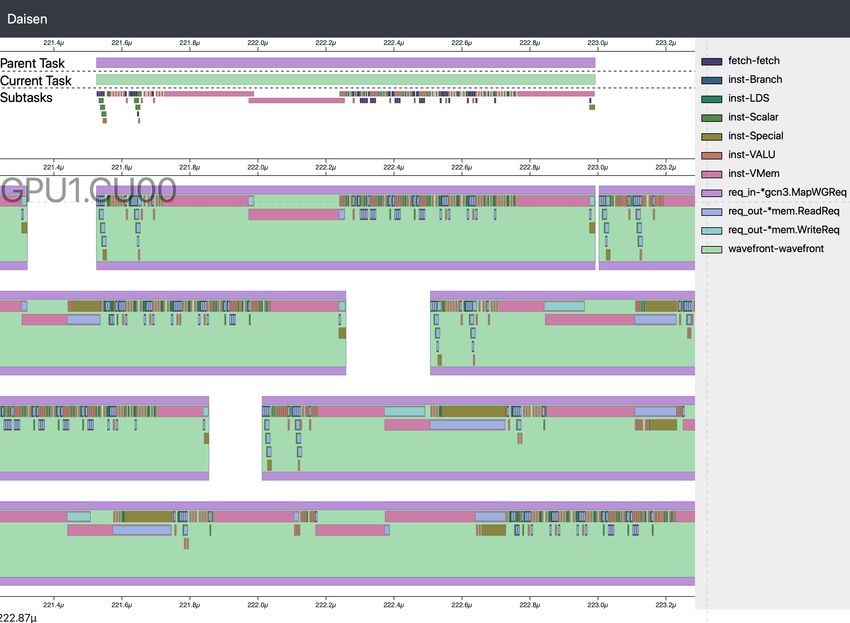
Y. Sun, Y. Zhang, A. Mosallaei, M. Shah, C. Dunne, & D. Kaeli / Daisen: A Framework for Visualizing Detailed GPU Execution

1. Introduction                                                               • The design and implementation of Daisen, a web-based visu-
                                                                                alization tool that visualizes massively-parallel GPU execution
Graphics Processing Units (GPUs) were originally designed to
                                                                                traces. Our evaluation with domain experts demonstrates that
accelerate 3D graphics rendering. In the last decade, developers
                                                                                Daisen can help GPU hardware designers identify performance
have found additional general-purpose use cases that take advan-
                                                                                bottlenecks, make informed and evidence-based design deci-
tage of GPU’s architectures. Developers have been using GPUs to
                                                                                sions, and efficiently debug performance issues.
accelerate a wide range of applications that require high perfor-
mance, including large-scale physics simulation [NHKM14], med-
ical imaging [YTZ∗ 08], data visualization [ME09], artificial intel-          2. Background on How GPUs Work
ligence [OJ04], and blockchain hashing [MM18]. A GPU is capa-
                                                                              GPUs are computing devices that can perform a large number of
ble of performing thousands of calculations in parallel. Empirical
                                                                              data-processing operations concurrently. In this section, we briefly
studies have demonstrated that GPU’s massive parallel processing
                                                                              describe how GPUs and GPU simulators work, and summarize the
capabilities can speed up algorithms by 5-70X as compared to CPU
                                                                              challenges of visualizing highly parallel hardware architectures.
implementations [ANM∗ 12, SASK19].
                                                                              GPU programming. GPUs work alongside CPUs in a coordinated
   GPU hardware designers aim to improve the design of a GPU to               effort to process data. A programmer writes a CPU program (i.e.,
run applications faster. Prior to implementing a new design on real           host program) that prepares data and then copies the data over to the
hardware and sending the design to fabrication, extensive simula-             GPU to process. After the required data is copied, the host program
tions of the proposed design must be carried out. Simulations allow           starts the GPU program (i.e., launching kernels). GPU vendors usu-
hardware designers to compare the performance of the proposed                 ally provide programming APIs (e.g., CUDA, OpenCL) to perform
designs with a baseline over a wide range of benchmarks (i.e., stan-          memory copy and kernel launching tasks.
dard and representative applications) [BYF∗ 09, UJM∗ 12, GUK17,
SBM∗ 19, KSAR20]. It is challenging to identify and make sense                   A program that runs on a GPU is called a kernel. As depicted
of performance bottlenecks encountered, since this may involve                in Figure 2 (a), a kernel is composed of a large number of work-
the designer manually inspecting gigabytes (GBs) of simulator-                items that can be executed concurrently on a GPU. A work-item
generated GPU-execution traces (i.e., highly detailed records of              is similar to a CPU thread that runs a series of instructions (e.g.,
events that occur during GPU program execution) [ZUSK15].                     add, multiply) to process data. Several work-items (typically 32 or
Given the complexity and the massive scale of the execution trace             64, determined by the hardware) can be grouped into a wavefront.
data, visualizations can help GPU hardware designers inspect ex-              Wavefronts (typically 1–8) are further grouped into a work-group.
ecution states, identify potential performance issues, and improve               Software elements (e.g., kernels, work-groups, wavefronts,
the efficiency of the GPU hardware design process [AFTA10].                   work-items) need to be mapped to hardware resources for execu-
   Existing performance analysis tools [GKM82] typically assume               tion. We illustrate how the kernel is executed on a GPU with Fig-
the underlying execution data is organized using call graphs (a               ure 2 (b) and (c). The CPU launches the whole kernel on a GPU
graph representation where the nodes are functions and the links              for execution. On the GPU side, the Command Processor receives
are function calls). While call graphs are a reasonable represen-             the kernel launch request from the CPU and divides the kernel
tation for tracking software execution, they are not suitable for             into work-groups. After this, the Command Processor dispatches
hardware execution. The problem is that a “function” is a soft-               the work-groups to the Compute Units. Compute Units, similar
ware concept and is not used by hardware. Several visualization               to CPU cores, are responsible for calculating the program output.
tools [IBJ∗ 14, RWP∗ 19, XXM18, FMR∗ 17] have been developed                  When work-groups are dispatched to a Compute Unit, the work-
to visualize parallel execution. However, these tools mainly focus            groups are broken down into wavefronts. Instructions that make up
on visualizing high-performance distributed computing and cannot              each wavefront wait to be scheduled by a central scheduler in each
be directly applied to hardware design. Visualization tools for ex-           Compute Unit. The central scheduler dispatches instructions to the
amining GPU execution traces, such as AerialVision [AFTA10] and               proper execution units (e.g., Branch Unit, SIMD unit), according
M2S-Visual [ZUSK15], only show specific metrics for specific fea-             to the type of each instruction. For a majority of the calculations,
tures (e.g., instruction execution, cache access). Additionally, these        the instruction is sent to the SIMD units (digital circuits that can
tools lack a straightforward methodology to compare metrics when              process instructions from multiple work-items at the same time).
evaluating complex hardware tradeoffs.                                           GPUs can process many work-items concurrently. E.g., the
   We introduce Daisen, a framework that helps GPU hardware de-               AMD R9 Nano GPU [AMD15] (default to MGPUSim and used in
signers collect and visualize GPU execution traces. We contribute:            our case study and evaluation) has 64 Compute Units; each Com-
                                                                              pute Unit has 4 SIMD units, and each SIMD unit can calculate in-
• A task analysis and task abstraction of GPU performance anal-               structions from 16 work-items in one cycle. Thus, the whole GPU
  ysis. To the best of our knowledge, there is no formal study that           can calculate 64 × 4 × 16 = 4096 instructions simultaneously. As
  examines the design requirements of GPU execution trace visu-               the GPU runs at a 1 GHz frequency (1 nanosecond per cycle), it can
  alization to facilitate GPU hardware design. To fill this gap, we           execute 4 trillion instructions in 1 second with all the SIMD units.
  conduct a survey and interviews with domain experts to charac-              Given this volume of instructions that a GPU runs, it is essential to
  terize practices and workflows in GPU performance analysis.                 support visualizing this large dataset while still providing the capa-
• A data abstraction that is designed to capture simulator-                   bility of interactively viewing and zooming into the execution at an
  generated traces of GPU executions.                                         extremely fine granularity (e.g., sub-nanosecond level).

                                                                                                                                                   © 2021 The Author(s)
                                                                                 Computer Graphics Forum © 2021 The Eurographics Association and John Wiley & Sons Ltd.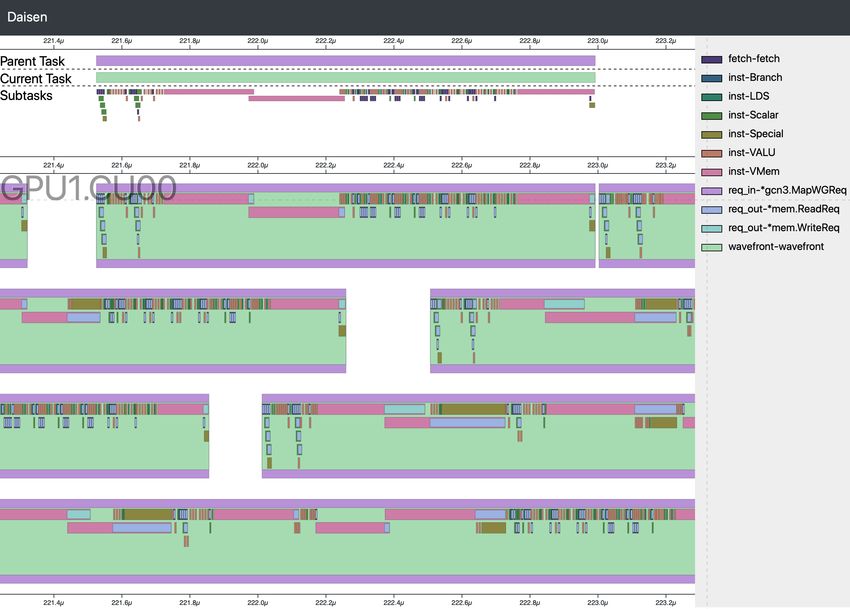
Y. Sun, Y. Zhang, A. Mosallaei, M. Shah, C. Dunne, & D. Kaeli / Daisen: A Framework for Visualizing Detailed GPU Execution

   Work-Item       Wavefront       Work-Group                                             CPU      Compute Unit
                                                                                                   Wavefront Pool                    Branch Unit    LDS Unit
                                                                                         Grid                                   Wavefront
                                      GPU
                                                                         Command Processor         Wavefront Pool
                                                                                                                                      VMem Unit    Scalar Unit   Memory Access

                                                                         Work-Group                                                   SIMD Unit    SIMD Unit

                                                                                                                    Scheduler
                                                                                                                                      Work-Item    Work-Item             L1 Cache
                                                                L1 Cache Compute Unit
                                       Memory      L2 Cache                                        Wavefront Pool
                                                                L1 Cache Compute Unit
                                       Memory      L2 Cache                                                                     Wavefront                                L2 Cache
                                                                L1 Cache Compute Unit
                                       Memory      L2 Cache                                        Wavefront Pool                     SIMD Unit    SIMD Unit
                                                                L1 Cache Compute Unit                                                 Work-Item    Work-Item
                                         ... ...     ... ...      ... ...   ... ...                                                                                       Memory
                                                                                                                                                                         Controller

(a) A grid of work-items formed               (b) The organization of a GPU.                              (c) The organization of a Compute Unit                   (d) The memory
    when launching a kernel.                                                                                                                                           hierarchy
                                        Figure 2: An overview of the GPU execution model and hardware organization.

   Moreover, Compute Units read data from memory (see Figure 2                                  threads. Perfopticon [MHHH15], specifically designed for evaluat-
(d)). After data is copied from the CPU, it is stored in the GPU’s                              ing SQL query performance, could identify issues in query execu-
main memory. Due to physics limitations, the main memory is too                                 tion. Perfopticon used nested Gantt charts to represent the relation-
slow to feed the data required by the Compute Units. To increase                                ship between nested SQL queries.
throughput, GPU designers place faster, but smaller, storage close
                                                                                                   Existing software-oriented performance visualization tools lack
to Compute Units. Caches are organized in tiers, labeled as “Level
                                                                                                the proper abstractions needed to visualize GPU hardware exe-
1” (L1) or “Level 2” (L2) caches, with the L1 caches being small-
                                                                                                cution. Hardware executions involve high degrees of parallelism,
est, fastest, and placed closest to the Compute Unit. In many appli-
                                                                                                though without function calls, demanding new data abstractions
cations, the memory system implementation limits the performance
                                                                                                and new visualization strategies. To address this research gap, our
of the whole GPU. Visually examining the memory system is cru-
                                                                                                work aims to bridge event-based data representations (typically
cial for understanding overall GPU performance.
                                                                                                used to represent hardware execution) and call-graph-based data
GPU simulators. GPU simulators [BYF∗ 09, UJM∗ 12, GUK17,                                        representations by building an abstraction of hardware behavior
SBM∗ 19, KSAR20] recreate hardware behaviors with just a CPU.                                   leveraging hierarchical tasks.
Hardware designers can run simulators and gather key performance
                                                                                                Visualizing parallel distributed computing. Most visualiza-
metrics (e.g., execution time, number of instructions executed). A
                                                                                                tions frameworks targeted parallel computing performance focus
simulator can also dump details (i.e., traces) to a file to record all
                                                                                                on large-scale distributed systems, and highlight the communica-
the events that occur during a simulation. Since the trace is highly
                                                                                                tion between computing nodes. Bhatele et al. [BGI∗ 12, ILG∗ 12]
detailed, simulating a millisecond GPU execution can generate sev-
                                                                                                developed Boxfish to visualize the multi-dimensional node organi-
eral GBs of trace data.
                                                                                                zation on parallel systems, capturing the communication patterns
                                                                                                between the nodes in a parallel distributed computing environ-
3. Related Work                                                                                 ment. Ross et al. [RWP∗ 19] presented a tool that visualized not
                                                                                                only the network traffic but also the behavior of the parallel simu-
Performance visualization tools can help engineers to identify bot-                             lation that models the communication. ChampVis [PGN∗ 19] pro-
tlenecks and make evidence-based performance-improvement de-                                    vided a solution to compare different hardware executions. The ca-
cisions. Here we survey several such tools.                                                     pabilities of distributed-system network visualization have been ex-
                                                                                                tended recently with automatic route suggestions [FMR∗ 17] and
Call-graph visualizations. Many visualization tools for debug-
                                                                                                anomaly detection [XXM18, BLX∗ 20]. However, hardware visual-
ging performance issues in CPU programs rely on call graph
                                                                                                ization poses different challenges (e.g., sub-nanosecond visualiza-
data. These tools can be categorized into three groups: 1. Icicle
                                                                                                tion, large number of component types), and hence, existing solu-
plots [KL83] or flame diagrams [Gre16] are commonly used to
                                                                                                tions cannot be directly used.
show the hierarchical relationship between function calls and their
execution time. Example tools include perf [Per], gperftools [gpe],                             GPU performance visualization. GPU vendors have created pro-
callgrind [Val], Chrome Developer Tools [chr20], and Very                                       filers to enable developers to examine GPU performance (e.g.,
Sleepy [Ver]. 2. Node-Link visualizations (e.g., pprof [ppr],                                   the Radeon GPU Profiler [rad20] and the NVIDIA Visual Pro-
kcachegrind [KCa]) show function call relationships and use the                                 filer [Cor14]). Academia has also developed visualization tools
size of nodes and links to visualize execution time. 3. Pipeline-                               to understand CPU-GPU heterogeneous execution [GPMSS∗ 18].
based visualization tools use multi-stage Gantt-chart [Cla22] to                                However, these tools mainly focus on high-level performance
show function executions (e.g., TraceVis [RZ04]). These tools were                              metrics in GPU software development and cannot show sub-
mainly developed for single-threaded CPU execution and cannot                                   nanosecond hardware execution details. Due to the lack of detailed
easily be used to visualize complex multi-threaded behavior.                                    GPU execution information, it is challenging for hardware design-
                                                                                                ers to use industrial profilers to examine hardware behaviors.
  Recently, new tools are developed to visualize multi-threaded ex-
ecutions. Isaacs et al. [IBJ∗ 14, IBL∗ 15] used logical times to align                            There are a few tools developed specifically for visualizing GPU
and compare the communication and dependency patterns between                                   hardware execution. Rosen [Ros13] proposed a solution to visu-

© 2021 The Author(s)
Computer Graphics Forum © 2021 The Eurographics Association and John Wiley & Sons Ltd.
Y. Sun, Y. Zhang, A. Mosallaei, M. Shah, C. Dunne, & D. Kaeli / Daisen: A Framework for Visualizing Detailed GPU Execution

ally inspect how GPUs access shared and global memory during                 nience sampling for recruitment (e.g., under-representation of sub-
CUDA kernel executions. AerialVision [AFTA10] provides a time-               populations in the sample). Therefore, we avoid making absolute
lapse view for tracking the changes of several performance metrics.          claims when analyzing and reporting our survey results, necessitat-
It presents a view of the statistics associated with individual lines        ing care when interpreting the results.
of source code to help identify the root cause of bottlenecks. M2S-
                                                                             Task analysis. Based on the survey results and interviews, we per-
Visual [ZUSK15] was customized to visualize execution traces
                                                                             formed a task analysis to characterize domain problems followed
generated by Multi2Sim [UJM∗ 12]. However, these existing tools
                                                                             by task abstraction that aims to recast user goals from domain-
lack the ability to easily compare metrics across hardware com-
                                                                             specific languages to a generalized terminology for better under-
ponents. New visualization solutions are desired to simplify GPU
                                                                             standing and generalizability [Mun14] (see Figure 3). We chose a
performance analysis.
                                                                             Hierarchical Task Abstraction [ZCD19] as performance analysis in
                                                                             hardware design is a dynamic process that typically involves mul-
4. Task Analysis and Abstraction                                             tiple hierarchical abstractions.

To characterize the workflow of GPU system performance analysis,                The overall goal of GPU hardware designers is to improve GPU
we conducted a survey study and interviewed 5 GPU hardware de-               performance by proposing new GPU hardware designs (Task 0).
signers (none of them are authors of this paper, upon approval from          The first step is to evaluate the current design’s performance (Task
our Institutional Review Board). Below, we describe the processes            1). In the first iteration, designers evaluate the performance of the
of the survey study, interview sessions, and the domain characteri-          baseline design by running a simulation (Task 1.1) and collecting
zation including data, task analysis and abstraction.                        performance metrics and GPU execution traces (Task 1.2).

Study design and participants. We conducted a survey study                      After collecting the execution traces, GPU hardware designers
with 37 computer hardware designers (none of them are authors                need to identify performance bottlenecks (Task 2), checking if the
of this paper) with experience analyzing parallel computing system           components are overloaded or underloaded (Task 2.1). To com-
performance. We created the survey using Google Forms (see sup-              plete this, designers need to find the component (Task 2.1.1), select
plemental materials) which was distributed via social media (e.g.,           the metrics to examine (Task 2.1.2), and compare with anticipated
Twitter, Slack). The survey contained three sections. The first sec-         values (Task 2.1.3). After identifying the load on a component,
tion aimed to understand users’ prior experience with performance            the designer needs to find the root cause for each underloaded or
analysis, such as how often respondents analyze computing system             overloaded component (Task 2.2) by comparing directly connected
performance and use simulators during their daily work, what level           components (Tasks 2.2.1) and parallel components (Task 2.2.2).
of difficulty they experience when identifying and making sense of              To explore a hypothetical performance bottleneck, the GPU
performance issues, and how much they feel that they need tools              hardware designer typically examines execution details during a
to help them examine performance issues. This section contained              short time period (usually under 0.1 microsecond, Task 2.3). The
seven items using a five-point Likert-style scale, with choices rang-        designer will first check the tasks that are executing in a partic-
ing from (1) Strongly Disagree to (5) Strongly Agree. The sec-               ular hardware component (Task 2.3.1). For example, they check
ond section aimed to help us characterize workflows and strategies.          all the instructions executing in a Compute Unit to see which in-
Four open-ended questions were asked to understand what simula-              structions are preventing the Compute Unit from making further
tors they have used and the tools that help them identify perfor-            progress. They also check the task hierarchy (Task 2.3.2). For ex-
mance issues, and to examine their process for identifying perfor-           ample, a designer may want to check which memory accesses are
mance issues. The last section included five questions regarding             conflicting with a memory load instruction.
respondents’ positions and affiliations, length of working on per-
formance analysis, and whether or not they would be willing to be               After identifying the bottleneck of the current platform, the GPU
contacted for clarification questions and follow-up studies. Partici-        hardware designers need to propose new designs that can mitigate
pants had various working experience on performance analysis: 10 years (n=2).                                            scope of this work. After developing a new design, designers need
                                                                             to repeat Task 1. This time, however, they need to compare the
   We also conducted semi-structured interviews with 5 GPU hard-             result with the baseline design (Task 1.3) and examine whether the
ware designers to understand their daily practices of perform-               bottleneck is resolved as expected (Task 1.4). If the performance of
ing GPU performance analysis. The goal was to further refine                 the new design cannot reach the performance goal, designers will
the design requirements and characterize practices and common                look for a new performance bottleneck in the new design (Task 2).
workflows when using simulators. The first two authors open-                 Designers may need to repeat Tasks 1–3 many times until they find
coded [Tho06] the survey responses and interview transcripts, and            a solution that satisfies the design requirements. Due to the page
identified themes iteratively through discussion and affinity dia-           limitation, more detailed task analysis with examples are relegated
gramming that helped us organize the codes.                                  to supplemental materials.
   The aim of the survey and interview was to examine the work-                 Task abstraction. Based on the task analysis, we performed a
flow of carrying out performance analysis and guide us to help char-         task abstraction that aims to recast tasks from domain-specific lan-
acterize domain tasks and processes. However, we are aware that              guages to a generalized visualization terminology to achieve better
the survey results may have potential biases since we used conve-            understanding and readability [Mun14]. We generate task abstrac-

                                                                                                                                                  © 2021 The Author(s)
                                                                                Computer Graphics Forum © 2021 The Eurographics Association and John Wiley & Sons Ltd.
Y. Sun, Y. Zhang, A. Mosallaei, M. Shah, C. Dunne, & D. Kaeli / Daisen: A Framework for Visualizing Detailed GPU Execution
0.
Improve GPU architecture performance
Plan 0: do 1-2-3 iteratively
1. 2. 3.
Evaluate current design Identify performance Propose new design to
bottlenecks improve performance
Increasing Task Specificity
Plan 1: do 1.1- 1.4; skip 1.3-1.4 for the first time
1.1 1.2 1.3 1.4
Run simulation Collect performance Compare with baseline Evaluate if bottlenecks
metrics and traces being resolved
Collect evidence Compare metrics Evaluate hypothesis
Plan 2: do 2.1- 2.2- 2.3
2.1 2.2 2.3
Determine the component Examine why the component Verify the factors that
is overloaded/underloaded was overloaded/ underloaded cause performance issues
Focus on instance Identify main cause Evaluate hypothesis
Plan 2.1: do 2.1.1- 2.1.3 iteratively Plan 2.2: do 2.2.1-2.2.2 Plan 2.3: do 2.3.1- 2.3.2 iteratively
2.1.1 2.1.2 2.1.3 2.2.1 2.2.2 2.3.1 2.3.2
Filter components Select metrics Compare with ideal Compare metrics of Compare metrics of Examine tasks Navigate the
of interest of interest metrics values directly-connected parallel components excuting on the task hierarchy
components component
Filter observations Find metrics Compare values Compare metrics Compare metrics Examine observations Explore relationships
Figure 3: Hierarchical Task Abstraction [ZCD19] of GPU hardware performance analysis: Each task is shown as a box with an ID that
indicates the associated level of the hierarchy. The vertical lines connect the tasks and their subtasks. Labels on the vertical lines (i.e., plan)
are used to identify the task sequences. Horizontal lines that sit beneath the corresponding boxes mean that there are no subsequent subtasks.
Task abstractions derived from the tasks are highlighted in dashed green boxes Task abstraction .
tions guided by Amar et al.’s [AES05] low-level components of vi- Table 1: A summary of data abstraction
sual analytics and Lam et al.’s framework [LTM18] that focuses on
connecting analysis goals and steps in design studies. The abstrac- Field Format Description Example
tions, labeled green in Figure 3, are integrated with the Hierarchical ID Text The unique identifier of a task, which was ran- 5C9dX8
domly generated to guarantee uniqueness
Task Abstraction guided by Zhang et al.’s work [ZCD19]. Parent ID Text The ID of the parent task 7F3sY2
Category Text The category of the task belongs to Instruction
Design requirements. We identified a set of design require- Action Text The job of the task Read Memory
Location Text The hardware component that carries out the task CPU1.Core1
ments (DR) of GPU execution trace visualization based on the task Start/ End Time The time that a hardware component starts to pro- 0.00014566s
analysis. DR1: Support visualizing a large number of concurrently- cess/ completes processing the task
executing tasks. Hardware elements typically achieve a high de-
gree of parallelism. Thousands of components may execute differ- task events requires extra processing. (2) It is difficult to capture
ent tasks at the same time. Each component may also execute a the hierarchical relationship of the tasks with exiting formats. (3)
large number of tasks in parallel. DR2: Create a mapping between While the design of prior formats considered query performance,
software concepts and hardware concepts. It is essential to exam- it is challenging to use when working with file-based traces. Using
ine how the software elements (e.g., memory access) are executed a database program can address this issue and provide low-latency
on hardware components (e.g., caches). If designers question why a query services for a wide range to query types.
software element is not executed early enough, they need to investi- We summarize all the trace entities as tasks. Each task contains
gate why the hardware elements are busy. DR3: Allow for efficient multiple properties, including ID, parent ID, category, action, loca-
browsing through the execution and zooming down to focus on a tion, start/end time, and details (see Table 1). Each task is assigned
short duration gradually. Simulation traces record executions that a unique ID. A task is also assigned information describing which
last from milliseconds to seconds. Meanwhile, researchers need to category it belongs to and the job of the task, captured in the “Cat-
identify hardware behavior at a sub-nanosecond level. egory” (e.g., “Request Out”, “Request In”, “Instruction”) and “Ac-
tion” (e.g., “Read Memory”, “Execute ADD Instruction”) fields,
5. Data Abstraction respectively. The name of the component that carries out the task is
recorded in the “Location” field. Each task has a Start time and an
We first map data into a unified format. The goal is to build a
End time. Tasks are organized hierarchically using a tree structure.
cohesive and comprehensive data collection framework to help
Each task has a “Parent ID” field that tracks a task’s parent task,
users make sense of the volumes of data and identify perfor-
except for the root task representing the entire simulation.
mance issues. We elect not to use prior parallel computing log for-
mats [KBB∗ 06, KBD∗ 08, CGL00] because: (1) Existing formats We record component-to-component communication with two
trace events rather than tasks. Pairing start-task events with end- special task categories: (i) “Request Out”, and (ii) “Request In”.
© 2021 The Author(s)
Computer Graphics Forum © 2021 The Eurographics Association and John Wiley & Sons Ltd.Y. Sun, Y. Zhang, A. Mosallaei, M. Shah, C. Dunne, & D. Kaeli / Daisen: A Framework for Visualizing Detailed GPU Execution
Part A. Filter box Part B. Primary Y-Axis Part C. Secondary Y-Axis
Filter component Select a primary metric to Select a second metric to plot
name(s) to allow for plot the performance the performance metric
search and compare metric versus time versus time for comparison
(C*) How to Interpret to the Hierarchical Layout
Layer 3a & 3b execute
in parallel
Layer 1 Layer 1
Layer 4
Layer 3a
Layer 2
Layer 3b
Layer 2 Layer 3a Layer 3b
Buffer Pressure Average Request Latency
Approximately The average time of
completing requests is Layer 4
0.014 messages
Mouse click waiting in the buffer approximately
to show the 60 nanoseconds
Component View X-Axis represents time (C)*
Figure 4: The Overview Panel shows multi-dimensional data. (C) Component View (D) Legend
Users can filter components (Part A) using regular expressions and
customize the display of dual y-axes (Parts B&C).
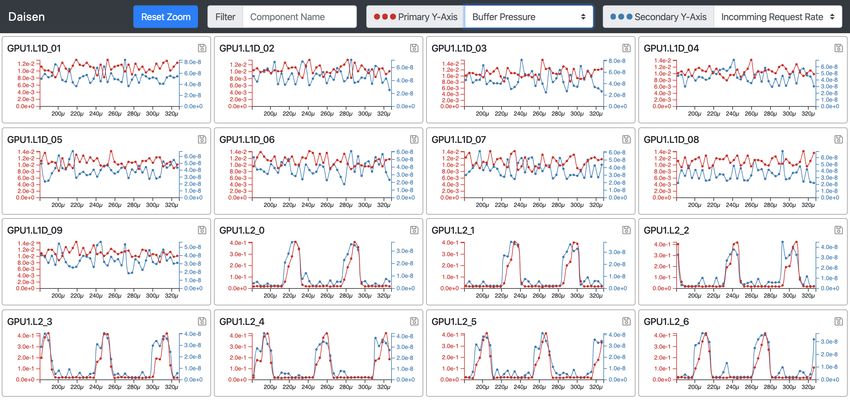
Figure 5: The Component View (C) hierarchically shows all the
tasks executed in a given component. (C*) illustrates how the lay-
Suppose a Compute Unit wants to read data from an L1 cache, out in the Component View maps to the tree structure. The legend
the Compute Unit would initiate a “Request Out” task when the (D) shows the color encoding for the tasks, following the format of
memory read request is created. When the L1 cache receives the Category-Action. (Note: C* is not displayed in the interface.)
request, a “Request In” task is created, setting the “Request Out”
task as the parent task. After the L1 cache reads the data, either
from its local storage or from an L2 cache, the L1 cache sends (see Figure 4 Part B) and the secondary y-axis (see Figure 4 Part C).
the data back to the Compute Unit and ends the “Request In” task. We currently provide 6 metrics for the y-axes, selected according
Finally, when the Compute Unit receives the response, the Compute to the survey responses and feedback from domain experts. Each
Unit ends the “Request out” tasks. By tracking the “Request In” and data point represents the average value for the metric over a small
the “Request Out” tasks, we can fully capture the communication time window. Although averages may hide outliers, they are effec-
between the components. tive for identifying general trends, which is in line with the goal of
the Overview Panel.
6. Visualization Tool When a user zooms or drags in a diagram, the time axes of all
the diagrams will be updated to show the curves of the same time
Next, we introduce Daisen’s visualization tool, an open-source,
period. This creates an alignment effect and can help users compare
web-based, interactive visualization tool that aims to help GPU
the behavior of different components [ZDBS∗ 19]. Once the user ar-
hardware designers evaluate the performance of GPU designs. We
rives at an initial guess for the cause of the performance bottleneck,
highlight its capability of fulfilling the requirements with three
they may need more detailed information to verify the performance
unique perspectives, including the Overview Panel, the Component
bottleneck, as in Task 2.3. The user can first zoom into a short time
View, and the Task View.
period in the Overview Panel and click the component name to see
the tasks executing during that period in the Component View.
6.1. Overview Panel
The Overview Panel (see Figure 4) enables users to see the 6.2. Component View
big picture of the execution and locate interesting time intervals
that require closer investigation — partially fulfilling DR-3. The The Component View, as shown in Figure 1(C), shows all the tasks
Overview Panel displays a series of small multiples, with one dia- executed at a certain component. The Component View aims to
gram per component. We separate the large number of GPU com- help users understand how hardware resources are utilized. The
ponents into multiple pages. current component name (using transparent text) on the top-left
corner of the Component View helps remind users which compo-
We provide a filter box (see Figure 4 Part A) to enable users to nent they are currently viewing.
filter the components of interest, satisfying the requirement of tar-
geted expert users. The filter box also supports task 2.2 (compare Horizontal placement. We use Gantt-like charts to represent tasks
metrics of related components). Users can use regular expressions in the Component View, which is consistent with existing trace vi-
(e.g., "(CU|L1|L2)") to create the combination of the compo- sualization tools [RZ04, chr20], flattening the learning curve and
nents to compare. reducing mental burden [Rog11].
We display all the component diagrams as time-series visualiza- We choose to present the task visually in a hierarchical fashion
tions, with the x-axis indicating the simulation time. Users can se- to avoid clutter and allowing users to clearly understand the rela-
lect key metrics of interest to explore using a drop-down menu. tionship between the tasks (see Figure 5). In the Component View,
They can also choose the metrics for both the primary y-axis root tasks (a task that has no parent task or its parent tasks have a
© 2021 The Author(s)
Computer Graphics Forum © 2021 The Eurographics Association and John Wiley & Sons Ltd.Y. Sun, Y. Zhang, A. Mosallaei, M. Shah, C. Dunne, & D. Kaeli / Daisen: A Framework for Visualizing Detailed GPU Execution
different location) are directly displayed on the canvas. Each task 6.3. Task View
uses its internal space to show its subtasks.
The Component View demonstrates how the hardware is utilized.
It aligns with a typical hardware performance analysis scenario.
Vertical placement. We develop an up-floating layout algorithm to
However, users also need to analyze the performance using a soft-
determine where to place the task bars on the y-axis. We assign the
ware performance analysis approach. They usually need to answer
row number for each task in the order of the task start-time. Each
the question about why a particular task takes such a long time or
task is assigned with the smallest row number (top-most row), as
which subtask takes the longest portion of the total time. Although
long as it does not overlap with any task that is already assigned
the Component View hierarchically displays tasks, it cannot show
with that row number. In this way, we can use the minimum number
subtasks that are not executed in the current task, and hence, does
of rows and show the maximum height possible for each task, while
not allow the user to move up or down the entire task hierarchy,
guaranteeing that tasks do not overlap with each other.
as required in Task 2.3.2. To solve these problems, we supplement
the Component View with a Task View. A user can click on a task
We maximize the bar height to best utilize the vertical space.
in the Component View to enable the Task View. The selected task
However, the bar heights are constrained by two conditions. First,
becomes the “current task”.
no two bars should overlap to ensure readability. Second, we regu-
late the bar height so that same-level bars have the same height, to As shown in Figure 1 (B), the Task View shows three groups of
maintain logical consistency. tasks. The second row of the Task View shows the “current task”.
Above the current task is its parent task. We show the parent task
Users can rely on the number of rectangles stacked at the same for two purposes. First, users can understand the relative timing re-
x-position, indicating how many tasks are executing in parallel, on lationship between the current task and the parent task, answering
a specific component, at a particular time. This shows how busy the question of whether the current task is a major step required to
the component is. The blank spaces on the y-axis are results of the complete the parent task. Second, users can click on the parent task
bar height regularization, and should not be misinterpreted as the to navigate towards the root of the task hierarchy, getting a larger
component being underutilized. We allow y-axis scrolling if there picture of program execution and partially fulfilling DR-3. All the
are too many tasks that are executing concurrently. subtasks of the current task are displayed below the current task.
We reuse the “up-floating” algorithm to maintain consistency with
Color coding. We use color-coding to differentiate tasks based on the Component View and to save space. Showing the subtasks al-
their “Category” and “Action”. Since we cannot exhaustively list lows users to discover how the time is spent to complete the current
all the possible “Category” and “Action” values a priori, we need task. Users can click on one of the subtasks to set that task as the
to dynamically color the tasks. To solve this problem, we use the “current task” or to drill down for a more detailed view. Combined
Cubehelix [Gre11] coloring scheme, as Cubehelix creates contrast with the parent task, the subtasks support navigation up and down
in both the hue and the lightness, ensuring readability and accessi- through the entire task tree, fulfilling DR-3.
bility for colorblind users. When there are too many “Category”–
“Action” pairs, we fall back to code “Categories” to avoid using too The Task View is stacked on top of the Component View. Their
many colors. time axes are always aligned. Dragging or zooming one view al-
ways refreshes both views. Aligning the time axes helps the user
One drawback of using a dynamic color-coding solution is that to easily match the tasks in the Task View (software concept) and
the colors can change as the user interacts with the tool. E.g., when the Component View (hardware concept). When a user hovers over
a user zooms out, more tasks will appear on the screen, using more a task in either the Task View or the Component View, the task is
“Category”-“Action” pairs. To differentiate the tasks, we need to highlighted on both sides to help users establish the connection be-
assign more colors to the tasks. The current recoloring solution tween these two views. A typical use case is that a user may need
changes the colors of tasks that are already on the screen and may to know why a task is not executed immediately after the previous
add extra mental burdens for users. A possible solution is to lock task is completed. To answer this question, the user can check the
the color of the tasks already on the screen and generate new col- task that occupies the component earlier. These two tasks are com-
ors for newly appeared “Categories” and “Actions”. We will leave peting for hardware resources. As we align the Task View and the
improving the dynamic color-coding solution as future work. Component View, it should be straightforward to find the tasks that
the component is executing at the time. The alignment of the Task
Interactive legend. We reserve the right sidebar of the interface to View and the Component View can fulfill DR-2.
provide information that may help users understand the diagrams.
By default, color-coded information is displayed as a legend. The
6.4. Implementation
legend also allows users to find tasks of a particular type easily.
When a user hovers the mouse pointer on a legend element, the We provide a data collection library — an extremely light-weight
tasks in the Component View, as well as the tasks in the Task View, one with only 7 functions defined — that can be invoked from the
will be highlighted with bolder outlines, while the rest is grayed simulator to export trace data. Minimum changes are required to
out. The right sidebar can also provide additional information for record the tasks. For example, we instrumented the MGPUSim’s
each individual task. When the user hovers their mouse pointer on L1 cache model by adding 16 lines of code, as compared to the
a particular task in the Component View, the detailed information ≈3500 lines of code of the original L1 cache model. We have
(listed in Table 1) will be shown above the legend. fully instrumented MGPUSim [SBM∗ 19] and our instrumentation
© 2021 The Author(s)
Computer Graphics Forum © 2021 The Eurographics Association and John Wiley & Sons Ltd.Y. Sun, Y. Zhang, A. Mosallaei, M. Shah, C. Dunne, & D. Kaeli / Daisen: A Framework for Visualizing Detailed GPU Execution
is a standard part of MGPUSim releases. We select to instrument waiting for existing memory accesses to complete, so they cannot
MGPUSim because it is flexible and is widely used in state-of- generate new memory accesses. After making sense of the perfor-
the-art GPU architecture research projects [BSM∗ 20, MSD∗ 20a, mance issue, we concluded that the root cause might lie in the Com-
MSD∗ 20b, BSD∗ 20, LSJ∗ 19, TSAK19]. pute Unit that was not executing enough wavefronts. The global
performance bottleneck was that the Command Processor was not
The visualization tool is implemented with the client-server
running fast enough to dispatch work-groups.
model. Users can start the backend server during the simulation
execution or after the simulation completes. The server application A solution to the problem above is to increase the dispatching
reads data from the database, processes the data, and sends the data speed. As we change the dispatching speed from one work-group
to the frontend upon request. The frontend was implemented using per cycle to two work-groups per cycle, MGPUSim reported that
TypeScript and D3.js. This server-client model does not require the the GPU execution time is reduced from ≈ 51ms to ≈ 44ms, speed-
installation of any library or software except for a web browser on ing up the execution by 1.16×. If we compare the work-group and
the client side. The server-client model also enables multiple users wavefront execution in Figure 6 (e) and (f), we can see that the
to check the results at the same time. Compute Unit had been executing more work-groups at the same
time (see the 6th row). Overall, the findings from Daisen, and the
minor modification of the GPU design, improved device utilization,
7. Case Study and reduced the overall execution time.
We use a case study performed by a domain expert (an author of
this paper) to demonstrate how Daisen can help improve the per- 8. Evaluation
formance of a GPU architecture design. We simulated the execu-
tion of the PageRank benchmark from the Hetero-Mark benchmark To further evaluate Daisen, we conducted user studies with 10 GPU
suite [SGZ∗ 16] running on an AMD R9 Nano GPU [AMD15]. We hardware designers (9 of the 10 also submitted the survey men-
first ran the PageRank benchmark [Ber05] on an R9 Nano GPU tioned above; none of the 10 are authors of this paper). The av-
with MGPUSim. MGPUSim reported the program could run in erage time they had worked in performance analysis was 4.6 years
≈ 51ms. The simulation generated a trace with ≈ 32M tasks, con- (sd = 2.8). The highest degree of education among participants was
suming ≈ 6.1GB disk space. split equally between master’s (n = 4) and doctoral degrees (n = 4),
with one bachelor’s and one associate’s degree.
The first task was to check which component was underloaded
or overloaded to examine if the workload was compute-intensive
or memory-intensive. To check compute intensity, we first checked 8.1. Methodology
the utilization of the SIMD unit (digital circuits that run the cal- We conducted our evaluation study remotely using online commu-
culations) by filtering the SIMD unit by entering “SIMD” in the nication tools (e.g., Zoom). We asked participants to share their
filter box and choosing “Number of Tasks” as the primary y-axis screens to allow us to observe how they interacted with the visu-
in the Overview Panel. According to Figure 6(a), the SIMD utiliza- alization framework. The evaluation study includes five parts. (1)
tion was low, suggesting it was not a compute-intensive workload. Participants were provided with a walk-through tutorial. (2) They
We then checked the “Buffer Pressure” and the “Request Comple- were asked to explore the tool on their own using the “think-aloud”
tion Rate” for the L1 and L2 caches. From Figure 6(b) and (c), we method [Lew82] that encourages verbalizing their thoughts as they
were able to conclude that both the buffers of the L1 and L2 caches move through the visualization. In this process, participants were
were empty for most of the time and the Buffer Pressure value was asked to explore a Matrix Transpose benchmark (1024×1024 ma-
constantly smaller than 1. We can conclude that this work was not trix, a well-known benchmark for GPU computing) running on an
memory intensive either. Since the L1 cache was not given enough R9 Nano GPU. The dataset has a similar scale as compared to
tasks (as suggested by the low buffer pressure), we further exam- the dataset used in the case study. (3) They were asked to iden-
ined the Component View by clicking on the L1 cache widget title. tify any performance bottlenecks they examined. (4) We conducted
In the Component View, we identified long gaps between tasks, in- follow-up semi-structured interviews about their experience inter-
dicating the L1 cache is idle for most of the time. After this, we acting with Daisen, accessing ease-of-use, what users liked and dis-
attempted to make sense of why the L1-Cache tasks did not start liked about Daisen, and what changes they would make to help
earlier. To reason about the process, we selected the second task to them identify performance issues more efficiently. (5) We asked
enable the Task View. We kept using the “parent task” bar in the each participant to fill out a post-study survey (see Figure 7 and
Task View to trace back to the root of the tree. supplemental materials for details) regarding how well Daisen fa-
As we traced back to the Compute Unit, we could check the cilitates performance analysis. The whole session lasted about 90
memory instructions that triggered the L1 cache access. We could minutes for each participant.
identify that the reason why the L1 did not have enough tasks was
that the memory instructions were executed infrequently. Ideally,
8.2. Findings
each Compute Unit can run 40 wavefronts (as shown in Fig-
ure 6(d)), so that there should be a large probability that at least one Our participants gave overall positive feedback on Daisen, espe-
wavefront issues a memory instruction. However, in Figure 6(d), cially how Daisen can be used to help them identify and make sense
we can see that only 3-5 wavefronts were executing in parallel. of performance issues. During the evaluation, 9 out of 10 partici-
These wavefronts might be all executing compute instructions or pants successfully identified that the benchmark was a memory-
© 2021 The Author(s)
Computer Graphics Forum © 2021 The Eurographics Association and John Wiley & Sons Ltd.Y. Sun, Y. Zhang, A. Mosallaei, M. Shah, C. Dunne, & D. Kaeli / Daisen: A Framework for Visualizing Detailed GPU Execution
1.5e-1 3.0e-1
Request Completion
Request Completion
Number Concurrent
1.0e-2 1.0e+7
2.5e-1 3.0e+8
Buffer Pressure
Buffer Pressure
8.0e-3 8.0e+6
Rate (1/s)
Rate (1/s)
1.0e-1 2.0e-1
Tasks
6.0e-3 6.0e+6 1.5e-1 2.0e+8
5.0e-2 4.0e-3 4.0e+6 1.0e-1
1.0e+8
2.0e-3 2.0e+6 5.0e-2
0.0e+0 0.0e+0 0.0e+0 0.0e+0 0.0e+0
0µ 100µ 200µ 300µ 400µ 500µ 0µ 100µ 200µ 300µ 400µ 500µ 0µ 100µ 200µ 300µ 400µ 500µ
Time (s) Time (s) Time (s)
(a) The number of tasks executing in (b) The buffer pressure and the request com- (c) The buffer pressure and the request comple-
a SIMD component. pletion rate of an L1 Cache. tion rate of an L2 Cache.
0µ 50µ 100µ 150µ 200µ 250µ 300µ 350µ 400µ 450µ 500µ 550µ 0µ 50µ 100µ 150µ 200µ 250µ 300µ 350µ 400µ 450µ
GPU1.CU00 GPU1.CU00 GPU1.CU00
137.8µ 138.0µ 138.2µ 138.4µ 138.6µ 138.8µ 139.0µ 139.2µ 139.4µ 139.6µ 139.8µ 140.0µ 140.2µ 140.4µ
0µ 50µ 100µ 150µ 200µ 250µ 300µ 350µ 400µ 450µ 500µ 550µ 0µ 50µ 100µ 150µ 200µ 250µ 300µ 350µ 400µ 450µ
(d) The task view showing there are only 4 con- (e) The work-group and wavefront execution (f) The work-group and wavefront execution
current wavefront running in a Computer Unit . in a Compute Unit in the baseline design. in a Compute Unit in the improved design.
Figure 6: Example screenshots that help with workload characterization in the case study.
intensive benchmark. 7 out of 10 participants pointed out that re- users the ability to verify their hypothesis on different applications
ducing the latency or increasing the bandwidth of the caches and and see which resources cause the constraint in the system.”
the memory controllers can improve performance.
Task View enables navigation between components. Our partic-
ipants used the Task View mainly to navigate across components
Value of visualizing GPU traces in Daisen. Participants appre-
and explore execution relationships between the Task View and the
ciated the GPU simulation visualizations and some expressed ex-
Component View. P04 and P08 particularly liked the Task View’s
citement about using Daisen to examine GPU performance issues.
ability to navigate between components. P08 said “It is really really
They also described how they typically visualize execution infor-
nice to have this type of navigation between tasks and subtasks.”
mation. Half indicated that they first added “print functions” in the
GPU simulator to get more performance information, exported to a Component View helps examine low-level behaviors. Our par-
CSV file and then visualizing the trace data separately (in Python) ticipants mainly used the Component View to get a more in-depth
to explore and identify performance issues. E.g., P03 said “My de- understanding of the performance of a particular component, espe-
bugging is using prints to get any of these numbers. But is also cially when they saw conflicting things happening in an overview.
cumbersome to either have another script to process those files and For example, P03 recalled a situation where he needed a detailed
then read them.” P03 further appreciated Daisen’s capability of pro- view. He explained that when he tried to understand what instruc-
viding visual clues related to performance issues. P03 said “Daisen tions the workload was executing, he needed more evidence to sup-
gives a pretty good picture of this benchmark is suffering because port his hypothesis on how to improve the design with the help of
of certain factors. Then I can take a design step to improve some- the Component View. Similarly, P01 specifically mentioned how
thing.” P07 also liked how Daisen supports visualizing GPU traces, well Daisen helped him understand simulation behavior as com-
comparing it with VTune [Rei05] and nvprof [nvp20], other trace pared with some profilers he had used before. He commented that
visualization tools. P07 mentioned that “nvprof also gives you some existing profiling tools failed to provide sufficient details for mak-
kind of views but can only show which kernels are running (from a ing sense of performance issues.
high-level and coarse-grained perspective). However, Daisen en-
Though all participants foresee themselves using Daisen to fa-
ables users to understand which portion and phases of the applica-
cilitate their research in GPU hardware design and computer archi-
tion are getting low [performance] and have problems.”
tecture research, they suggested a few things that can be improved
to further help them examine GPU performance issues. These fea-
Overview allows quick hotspot identification. 7 out of 10 par-
tures include (1) educational support and tutorings, such as auto-
ticipants started to use the filter box to narrow down the compo-
matic screen recording and more user guidance, and (2) integration
nents after browsing no more than 4 pages. None of the participants
of summary statistics into Daisen to enable users with various lev-
attempted to check all pages. Moreover, 9 out of 10 participants
els of visualization literacy to understand the performance (e.g.,
displayed little difficulty finding the desired components by typ-
statistically summarizing 70% of the instructions being executed).
ing in commonly-used computer architecture terms such as “L1”
or “TLB”. The participants’ way of interacting with the Overview Post-study survey results. Overall, as shown in Figure 7, partici-
Panel suggests our participants (as domain experts) can easily learn pants found that using Daisen helped them understand key charac-
how to use Daisen to solve problems. teristics of workloads (median 7, IQR 0.75), identify performance
issues (median 7, IQR 1.5), locate overloaded hardware compo-
Participants also frequently zoomed in and out to search hot nents (median 7, IQR 1), explore trends in executions (median
spots that took longer in execution. P05 specifically valued being 6, IQR 1), examine software-related factors that cause the perfor-
able to browse behaviors of various components, as “it gives the mance bottlenecks (median 5, IQR 2), identify opportunities to im-
© 2021 The Author(s)
Computer Graphics Forum © 2021 The Eurographics Association and John Wiley & Sons Ltd.Y. Sun, Y. Zhang, A. Mosallaei, M. Shah, C. Dunne, & D. Kaeli / Daisen: A Framework for Visualizing Detailed GPU Execution
Understand workload characteristics interesting components in the Overview Panel and may end up
Identify performance issues browsing pages. Many approaches have been explored to help users
comprehend how visualization works, such as step-by-step wiz-
Locate overloaded hardware components
ards, forums, and animated video tutorials [FGF11, GF10, MGF11,
Identify hardware components' execution trend PDL∗ 11]. In addition to these strategies, we plan to add better navi-
Examine software factors that cause bottlenecks gation support (e.g., grouping, ordering) in the Overview Panel and
Identify opportunities to improve performance provide visual hints about how the components are connected. We
Validate the design by comparing against a baseline also plan to have each component specify the expected metric val-
1 2 3 4 5 6 7 ues, making it easier for beginners to compare metrics.
Limitations. There are several limitations in our current design
Figure 7: Post-study survey results: Participants rated whether
which we are planning to improve. While abstracting hardware ex-
they were able to perform a set of tasks using a 7-point scale, la-
ecution behavior can represent most digital circuit behaviors, some
beled from Strongly Disagree (1) to Strongly Agree (7).
corner cases may not perfectly apply. E.g., DRAMs usually spon-
prove performance (median 7, IQR 0), and validate the new design taneously and periodically initiate a refresh action, which does not
by comparing with a baseline (median 7, IQR 0.75). belong to the task hierarchy tree. We currently do not capture such
behavior but will generalize to a graph data representation. Another
9. Discussion limitation is that we do not highlight communication between GPU
hardware components. In chip design, on-chip network bandwidth
Participant feedback about Daisen was very positive overall. In this is a scarce resource and can limit overall performance. We plan to
section, we reflect on our task analysis, design, and evaluation. add a network view and time-lapse traffic visualization. Moreover,
Our task analysis and abstraction was drawn from our survey and we currently do not support comparing executions between differ-
interview studies with GPU designers. As we described, some tasks ent benchmark executions and different hardware configurations.
are particularly essential for GPU performance analysis, such as Finally, the current design requires a good knowledge of computer
comparing metrics of parallel components (Task 2.3.2). Some other architecture and information about the simulation being visualized.
tasks may be applicable to other sibling domains (e.g., designing Future work also includes using heuristic algorithms as well as nar-
CPUs and domain-specific accelerators); thus, we suggest future rative solutions to highlight potential bottlenecks.
research to adapt the Daisen design to fit design requirements for
other types of digital circuit devices.
10. Conclusion
Generalization vs. specification. One challenge we encountered
Visualizing massively parallel GPU hardware execution has been
when designing Daisen was to balance between generalization and
challenging due to the large number of digital circuit components
specialization. On the one hand, we can pursue generalizability that
and the complex interplay between them. To address this prob-
aims to benefit a wider range of audiences [TLCC17]. On the other,
lem, we have described Daisen, which includes a dedicated data
design studies have focused on seeking solutions for a particular
representation for simulator-generated hardware executions and a
problem domain [Mun08]. Daisen’s design avoids a close binding
web-based interactive visualization tool. Using a case study and
between the visualization style and the component to be examined.
user evaluation studies, we demonstrated how Daisen can be used
Instead, we use the same views to reveal the behavior of most of
to help GPU hardware designers identify performance bottlenecks.
the components on a GPU, such as Compute Units, caches, and
Daisen is currently under active development, with more features
memory controllers.
and improvements being added to the tool. We hope the design of
Our effort to maintain a general framework created some chal- Daisen can serve as the first step of a series of works that can help
lenges. Our participants felt that the component sorting in the hardware designers build explainable computer architecture, since
Overview Panel was not intuitive, and that it took some time only human-understandable computer architecture can avoid costly
for them to understand how components were connected. Al- hardware bugs, performance bottlenecks, reliability issues, and se-
though most participants indicated that they were able to infer the curity vulnerabilities.
component-specific metrics from the component-independent met-
rics, some (P03, P07) also wanted to see traditional component-
Acknowledgments
specific metrics to help them understand the execution. Therefore,
more work is needed to examine the best trade-off between gener- We thank our reviewers for their constructive feedback. We also
alization and specialization. For example, we plan to allow users thank AMD for supporting this work.
to tag the tasks with user-specified properties and use the tags to
visualize component-specific metrics.
References
GPU visualization for non-expert users. We noticed that more
[AES05] A MAR R., E AGAN J., S TASKO J.: Low-level components of
experienced GPU designers more quickly grasped key concepts vi- analytic activity in information visualization. In IEEE Symposium on
sualized in Daisen. This shortcoming raises a question for future Information Visualization, 2005. INFOVIS 2005. (2005), pp. 111–117.
research: how to design a visualization environment for users with doi:10.1109/INFOVIS.2005.24. 5
different levels of expertise and help overcome the steep learn- [AFTA10] A RIEL A., F UNG W. W., T URNER A. E., A AMODT T. M.:
ing curve. For example, non-experts may not be able to pinpoint Visualizing complex dynamics in many-core accelerator architectures.
© 2021 The Author(s)
Computer Graphics Forum © 2021 The Eurographics Association and John Wiley & Sons Ltd.You can also read