Data in the Cloud and Analytics in the Lake - SAS
←
→
Page content transcription
If your browser does not render page correctly, please read the page content below
Data in the Cloud and Analytics in the Lake
Introduction

▪ Working in Analytics for over 5      ▪ Professional Scuba Diver
  years                                  ‒ PADI Divemaster
▪ Part the digital team at BNZ for 3   ▪ Professional Waiter
  years                                  ‒ Fine Dining
▪ Based in the Auckland office
▪ Preferred Languages
  ‒ SQL
  ‒ Python (PySpark)
  ‒ R
Slide 2 Notes

                • The Digital team 300 (and growing) people of out 4,700.
                • 1.2 million customers made up of a mix of personal and
                  business clients.
                • ‘mildly large’ data

                As for myself.
                • I have been at bnz for around 3 years.
                • I do have a small confession, I am not a SAS coder so there
                  wont be any code snippets this talk.
                • My language of choice for Data Engineering and Data Science
                  is Python.

                • Diver
                • Waiter
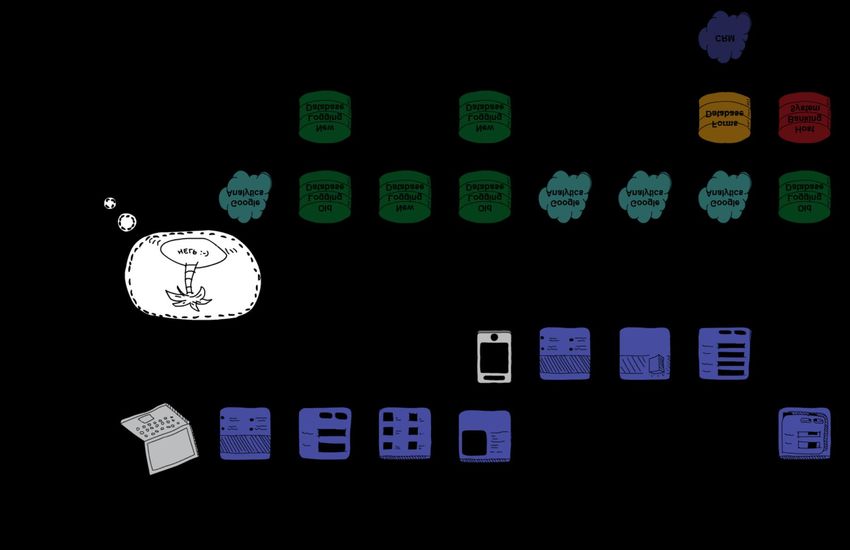
BNZ Digital Channels

             Sales                     Product       Multi User
Product     Funnels     Account        Servicing       Sites
 Pages                  Balances

             Help and                      Quick
Login        Support      In Channel                   In Channel
                          Messaging       Balances
Portal                                                 Sales Offers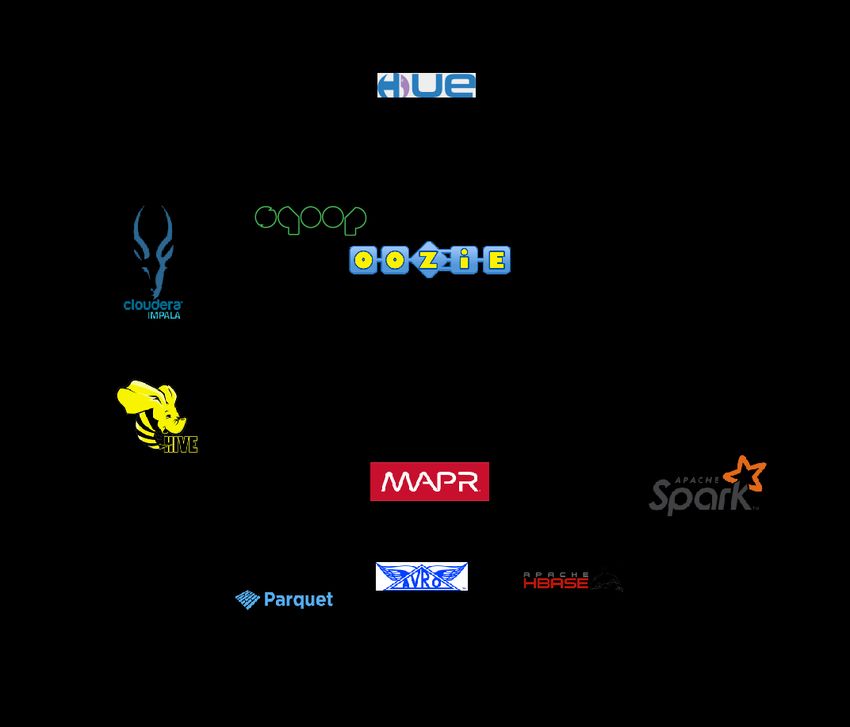
Slide 3 Notes
Okay so now that that’s out of the way, a dive a bit deeper into the digital landscape of BNZ.

We have five main ways our customer can interact with us digitally, which we refer to as channels.

The unauthenticated Website – before the password
• Product Pages, Help and Support, Landing Pages

Internet Banking
• Reactive web app (we’ll get back to this later)
• Mobile App

Internet Banking for Business
• Business Banking Platform
• Multi User Sites
• Mobile App

While our customer will generally just call it our website, internally its not so simple. So what does this mean?
Business Challenges
Slide 4 Notes
Ask why you might apply for a Credit Card?

Lets take a typical customer journey
1. Customer sit down at they laptop, opens a browser and clicks on the BNZ bookmark
2. They land on the home page
3. Click on the login button
4. Now they land on their account view,
5. Check their balances and notice they have significantly less than they expected
6. Open up their account and have a look at some recent transactions and realise their rates have were due and the automatic payment has gone
   out
7. Now they remember they got an email about a credit card from us.
8. Open their mobile find the email and click on the link
9. Land on the bnz website, navigate a few credit card pages
10.Fill out and application form and get a credit card.
11.Now they remember they logged in to pay their insurance so go back to their internet banking and make a transaction on their new card

So far we have had:
• Two sets of data from Google Analytics
• Logging data spread across 4 different tables
• Forms data
• CRM data
• And raw data in our core banking systems
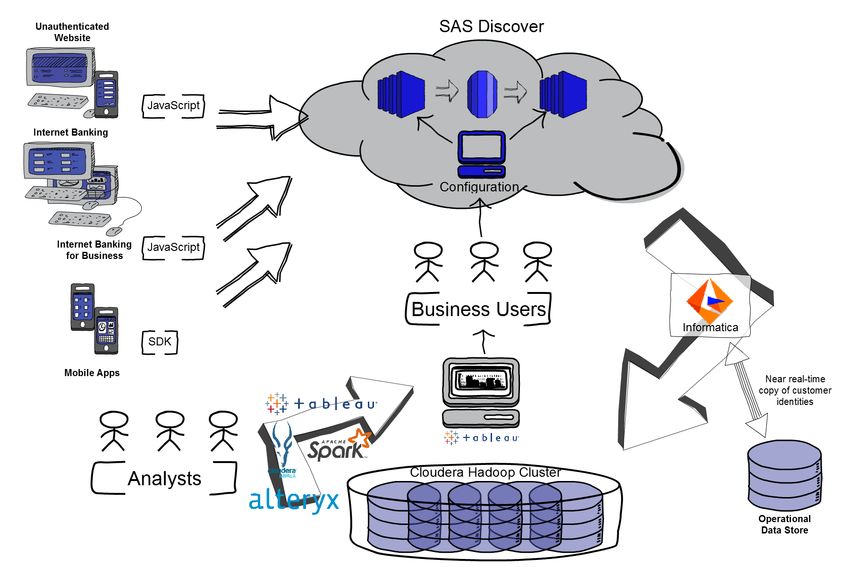
Customer Intelligence 360 Discover
Slide 5 Notes

     • We decided to implement CI360 Discover as a single tool to capture data across all out digital
       channels
     • Discover is a Cloud based analytics collection tool
     • Provides not only the ability to capture data but to create data by configuring rules
     • This can be done by analysts or business users and for the most part does not require developers
Risk vs The Cloud
Simplify risk requirements
Capture by excluding Personally
As in any large company, Everything Identifiable Information
(PII)
everything needs to managed
within an accepted level of risk Use SAS® Discover Form
Exclude PII and Field Level Rules
VS
Control not Analyse all the potential
We needed to capture as much based on points where this could
data as possible, even data we content occur
don’t know we need yet
Analyses Work with Risk to
proved evaluate putting PII in
unfeasible the cloudSlide 6 Notes
• dealt with their risk team at some point. In any company there is a need ensure an
acceptable level of risk.
• customer data is increasingly being misused
• Increasing regulation (GDPR) for the horde of emails on updated privacy policies
On the other side we have ‘Big Data’ (or in the case of NZ mildly large data) and data science
use cases.
• capture everything we can.
• year on year trend analyses for an executive report.
• train a traditional models, implement real-time machine learning ..
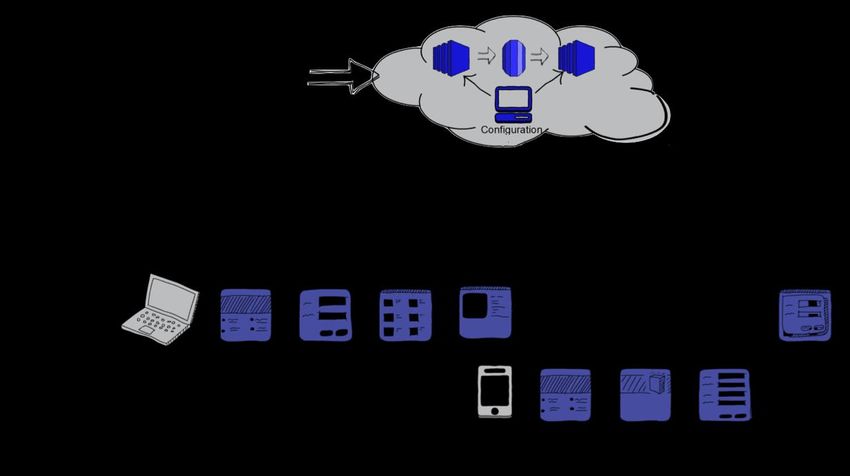
To make our lives easier and reduce risk we decided to try to exclude PII data …Implementation of SAS® Discover ▪ Phase 1 ‒ ‘One line of JavaScript’ (SDKs for the Mobile Apps) ▪ Phase 2 ‒ Track customer identities using a secure hash ‒ Get data from SAS® CI360 Discover to our Cloudera® Hadoop Cluster ‒ Reverse the hash and join with our customer data ‒ Build a Visual Analytics Suite
Slide 7 Notes

Phase 1
- The famous one line of Javascript. To the surprise of the developer it proved to be pretty much just that. Channel by channel we quickly got tracking up and
  running and were able to see data arriving in the cloud
- We started setting up basic rules to track behaviour.
- At the same time we put the SDK into the mobile apps and connected a few prexisitng hooks to start captureing the various screens.

- Difficulties – Singe Page Apps. We have a bunch of single page apps that drive our digital channels. The retail internet banking channel and the way we present
  and submit forms across WWW. We quickly found that while we could capture the majority of event it still proved difficult to capture goals and screens within
  these apps without reverting to hard coded events

Phase 2
- Create a service to start sending a unique hash to SAS Discover to uniquely identify users and implement this in each channel (ongoing)
- Build a process to get the data from SAS Discover back to BNZ. For this we engaged our enterprise data team to build a robust pipeline from AWS to our on premis
  Cloudera Cluster. At the time of the initial plan SAS Discover was only able to output its data to an Oracle or PostgreSQL database, however we were fortunate to
  be one of the first organisation to be able to use the new API that enabled us to get data directly from the service itself.
- Build a process to get the customer identifier, this involved building near real-time feeds between various source data systems to allow us to use this within an
  analytics pipeline. This is an interesting space where operational data is now being required by analytics tooling.
- Build a Visual Analytics Suite. Using Tableau we are able to build out an ever increasing suite of visual analytics that can satisfy standard (80%) of the business
  question (this is also somewhat ongoing)
Final Implementation

1. All five of our channels are
   connected to CI360
2. Business users are able to
   create rules
3. The raw data flows back into to
   the data lake using
   Informatica® via the CI360 REST
   API
4. Business users can use a suite
   of visual analytics in Tableau®
5. The analytics team is also able
   to use the raw data
Slide 8 Notes

      1.   All five of our channels are connected to SAS® Discover. We are able to track our
           users as they move between desktop channels or even use multiple devices at the
           same time.
      2.   Business users are able to create rules to group pages and screens together, and
           determine goals and business processes they want to track.
      3.   The raw data flows back into to the BNZ ecosystem using Informatica® via the SAS®
           Discover REST API. New data is available on an hourly basis with any extra business
           rules applied.
      4.   Business users can use a suite of visual analytics in Tableau® to answer the majority
           of their question s.
      5.   The analytics team is also able to use the raw data to generate insights or build
           advanced models.
The Data Lake - Hadoop is Not a Thing
Traditional Analytics Tools
1. A data storage mechanism: usually
some sort of table made of columns
containing a type of data
2. A way to import new data into the
table
3. A way to manipulate the data, either
through a visual editor or code
4. A way to view the output in a table or
graph
5. A way to export dataSlide 9 Notes • Building a data lake and one of the most common technologies to do this is Hadoop. • We within digital we have been using our Cloudera Hadoop cluster in anger for about 2 years • ‘Hadoop is not a thing’. • I mean this in the way that it is not like the tools we are used to.
Hadoop is Lots of Little Things

1.       Data Storage Mechanism: Data is stored in a distributed file system
         called HDFS. It works like any drive on your computer, you can put any
         type of file on it. It is predominantly a write once architecture.
2.       Importing Data:
     ‒     Sqoop for reading and writing from relational databases
     ‒     Flume for dealing with streams
     ‒     WebHDFS for files via a REST API
3.       Data Manipulation, is where Hadoop excels:
     ‒     MapReduce uses HDFS’s native functionality
     ‒     Hive and Impala provide a familiar SQL interface
     ‒     Spark is a vastly powerful data engine that has Python and R APIs for Data Science and
           Machine Learning
4.       Viewing the data: Web interfaces such as Cloudera® Hue provide a
         simple user interface for the various tools
5.       Due to the massive nature of much of the data on Hadoop, it’s often
         best to just leave the data there.
Slide 10 Notes
1. Data Storage Mechanism. Data is stored in a distributed file system called HDFS. Unlike traditional analytics tools it works like a folder on your computer and can take any
type of file. The most common files for the analyst to load are
1. CSVs or text files, but HDFS can support
2. unstructured tests such as log files,
3. JSONs or
4. images.
5. It also has some extra formats for storing data. In particular, Parquet files form the closest analogy to the traditional table, they are highly typed and the columns
have specific names. Parquet also uses column instead of row based storage, which makes it ideal for the big wide tables that you often get in big data.
2. Importing Data. Hadoop has many ways to import data:
1. Sqoop for reading and writing from relational databases,
2. Flume for dealing with streams, and
3. WebHDFS for files via a REST API.
4. While some of these tools can perform minor transformations, they are only really good at landing the original data into HDFS.
3. When it comes to data manipulation, there is plenty of choice. MapReduce is a java based language that uses HDFS’s native functionality. Hive has been built on this to
provide a familiar SQL interface. Impala uses the table metadata from Hive but performs much faster, thanks to its in-memory engine. Finally, Spark is a vastly powerful data
engine that has Python and R APIs for Data Science and Machine Learning. Learning each of these, their strengths and limitations and how to combine them into an
analytics pipeline is much more complex than traditional tools.
4. A way to output the data. Cloudera Hue provides a quick way to interact directly with the cluster, but lacks much of the visual output we are used to from tools like SAS®.
Thankfully the SQL engines provide connectors to modern visualization tools like Tableau ®.
5. Due to the massive nature of much of the data on Hadoop, it’s often best to just leave the data there.Creating the Event Stream:
Updates on Hadoop
To maintain a small set of
transitory data in the same
‘table’ using partitions, on each
run:
1. Picks up any new start facts, the
partition with the partial facts and
any new end fact
2. Writes any completed facts to the
relevant monthly partition
3. Overwrite the temporary partition
with any un-joined factsSlide 11 Notes
CI360 Discover outputs some standardized streams of data:
• Pages
• Session
• Forms
• Etc
Most of these have two parts which I call:
• Starting Part/Fact: This is the immutable data at the time of
the event. When it happened, where it was
• Ending Part/Fact: This is the information about the event as a
whole, like loading time or number of pages viewed that we
don’t know until all the possible actions are finishedSAS® Discover Data Architecture
1. Informatica® retrieves new data from the CI360
REST API
2. Informatica® writes the optimised data model to
production
1. Create Event Streams. Most of the key event streams in
SAS® Discover have two parts: one stream records the
event at the start, another processed later to describe
the entire event.
2. Create Identity Map: Using the most recent partition of
the identity tables and near real-time data feed from the
Operational Data Store to decode the hashed customer
identities.
3. Data Engineering team creates the Enrichment
tables, using Spark and Alteryx to fill out the
360° degree view of our users.
4. Analytics team and data scientists able to use
the data to answer solve business problemsSlide 12 Notes
Informatica® retrieves new data from the SAS® Discover REST API
Check for new data
Informatica retrieves s3 bcket address and single use credentials for each new file
Download the fact tables in chucks and appends to existing data
Download the full identity map and appends a new partition in a time series
Informatica® writes the optimised data model to production
Create Event Streams. Most of the key event streams in SAS® Discover have two parts: one stream records the event at the start, when a person lands
on a page. The other is processed later to describe the entire event, loading time and time spent on page. To get a complete view of the stream we
need to join the data from both tables. However, the starting fact arrives up to four hours before the ending fact. Being able to react quickly is
increasingly important, so we need a way to temporarily add the partial facts to the output stream. To do this, we make use of partitions. This allows
us to maintain a small set of transitory data that is co-located in the same ‘table’ as the final data. On each run, the process picks up any new start
facts, the partition with the partial facts and any new end fact. It then writes any completed facts to the relevant monthly partition and any un-joined
facts overwrite the previous partial partition (See Figure 7).
Create Identity Map. The identity map is much easier. Informatica picks up the most recent partition of the identity tables, joins them together and
then uses the near real-time data feed from the Operational Data Store to decode the hashed customer identities. SAS Discover allows us to have
multiple levels of identities, so we need to flatten the identity table to allow one-to-one joining with our time series and enrichment tables.
Data Engineering team creates the Enrichment tables. Now that we have an hourly feed of customer data, we need to add customer attributes such as
segment, digital activation, or product holding. Our analytics team and data engineers use the other data within the raw zone to start to fill out the 360o
degree view of our users.What we have learned
For SAS® CI360 Discover the one
line of JavaScript was just that
Sometimes, what looks like the
harder path is the easier one Tracking customer
interactions are only the
first step of the process
The data lake isn’t always
smooth sailingSlide 13 Notes
What’s next:
• Building a scalable system to deliver a single customer view
to deliver a consistent omni channel personalised experienceWhat’s next
Building an agile scalable pipeline to
deliver a single customer view and
enable a consistent omni channel
personalised experienceYou can also read